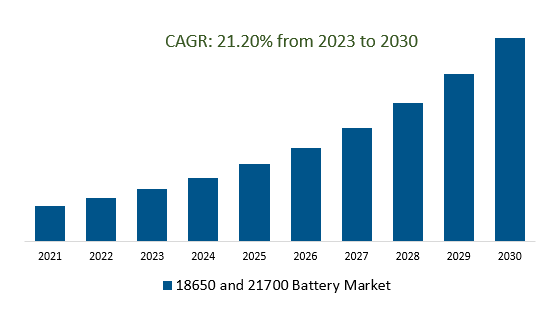
The global 18650 and 21700 Battery Market Size is estimated to register 21.2 % growth over the forecast period from 2023 to 2030.
The market growth is driven by the 18650 battery market continued to thrive due to its versatile use across consumer electronics, power tools, e-cigarettes, and early-stage electric vehicles, driven by its established presence in various industries. Further, the demand for compact yet powerful energy solutions in various sectors, including EVs and renewable energy storage, drove interest in the increased energy density of 21700 batteries.
Leading companies are focusing on Niche Applications, Energy Density Improvements, EV Dominance, Industrial Applications, Advancements in Chemistry, and others to boost market shares in the industry.
Market Overview
18650 batteries have been a staple in various applications, including laptops, power tools, e-cigarettes, and electric vehicles (EVs). They are named after their dimensions: 18mm in diameter and 65mm in length. These batteries gained popularity due to their high energy density and relatively mature manufacturing processes. 21700 batteries are a newer battery format, named after their dimensions: 21mm in diameter and 70mm in length. They were developed to address some of the limitations of the 18650 format and have gained significant attention in recent years, particularly in the electric vehicle and energy storage sectors.
Market Dynamics
Market Trends: Companies are launching EV Transition to attract consumer base
electric vehicle (EV) adoption, several manufacturers used 18650 batteries to power electric and hybrid vehicles. While these batteries provided a suitable energy source, they had limitations in terms of energy density and capacity compared to newer formats.
The limitations of 18650 batteries became more pronounced as EVs demanded higher energy storage to extend driving ranges. This led to the exploration of alternative battery formats with greater capacity and performance.
Market Driver- Versatility demand for efficient 18650 and 21700 Battery Market
The 18650 battery is recognized for its versatility across consumer electronics, power tools, e-cigarettes, and some early electric vehicles, benefiting from its established market presence. In contrast, the larger and more powerful 21700 battery has gained prominence for its versatility in addressing higher capacity and performance demands, finding applications in mainstream electric vehicles, renewable energy storage, industrial use, and high-performance electronics.
Market Opportunity-Introduction of Standardization Potential
The 18650 battery market has some standardization due to its long-standing use, while the 21700 format holds stronger potential for standardization, being newer and more adaptable, with discussions about establishing it as a common industry standard, particularly in electric vehicles and renewable energy storage.
Market Segmentation
18650 Battery: The 18650 battery, named after its dimensions of 18mm in diameter and 65mm in length, has been a staple in various industries. Its versatile nature has allowed it to serve as a power source in consumer electronics, power tools, e-cigarettes, and some early electric vehicles. Its relatively mature manufacturing processes and wide availability have made it a reliable choice for applications that prioritize compatibility and moderate energy density. while the 18650 battery's energy density limitations became more pronounced, its continued use in various niches was driven by its compatibility with existing devices and systems.
New Energy Vehicles: The 18650battery format was initially employed in the early stages of new energy vehicles, but limitations in energy density led to the exploration of alternatives like the 21700 battery, which due to its larger size and improved capacity, has become a dominant choice for powering modern electric vehicles, driving the growth of the new energy vehicle market by enhancing driving ranges and overall performance.
Segmentation
By Type
- 18650 Battery
- 21700 Battery
By Application
- New Energy Vehicles
- Electric Tool
- UAV
- Others
By Region
- North America (United States, Canada, Mexico)
- Europe (Germany, France, United Kingdom, Spain, Italy, Others)
- Asia Pacific (China, India, Japan, South Korea, Australia, Others)
- Latin America (Brazil, Argentina, Others)
- Middle East and Africa (Saudi Arabia, UAE, Kuwait, Other Middle East, South Africa, Nigeria, Other Africa)
Key Players
Leading companies profiled in the study include-
- Samsung SDI
- Murata
- Amperex Technology Limited
- Panasonic
- LG
- EVE Energy Co., Ltd.
- BAK Power
- Chilwee
- Jiangsu Tenpower Lithium Co., Ltd.
- CALB
- BYD
- Highstar
- Lishen
- Changhong New Energy
- Great Power
- Tianneng Co.,Ltd
18650 and 21700 Battery Market Outlook 2023
1 Market Overview
1.1 Introduction to the 18650 and 21700 Battery Market
1.2 Scope of the Study
1.3 Research Objective
1.3.1 Key Market Scope and Segments
1.3.2 Players Covered
1.3.3 Years Considered
2 Executive Summary
2.1 2023 18650 and 21700 Battery Industry- Market Statistics
3 Market Dynamics
3.1 Market Drivers
3.2 Market Challenges
3.3 Market Opportunities
3.4 Market Trends
4 Market Factor Analysis
4.1 Porter’s Five Forces
4.2 Market Entropy
4.2.1 Global 18650 and 21700 Battery Market Companies with Area Served
4.2.2 Products Offerings Global 18650 and 21700 Battery Market
5 COVID-19 Impact Analysis and Outlook Scenarios
5.1.1 Covid-19 Impact Analysis
5.1.2 Post-COVID-19 Scenario- Low Growth Case
5.1.3 Post-COVID-19 Scenario- Reference Growth Case
5.1.4 Post-COVID-19 Scenario- Low Growth Case
6 Global 18650 and 21700 Battery Market Trends
6.1 Global 18650 and 21700 Battery Revenue (USD Million) and CAGR (%) by Type (2018-2030)
6.2 Global 18650 and 21700 Battery Revenue (USD Million) and CAGR (%) by Applications (2018-2030)
6.3 Global 18650 and 21700 Battery Revenue (USD Million) and CAGR (%) by Regions (2018-2030)
7 Global 18650 and 21700 Battery Market Revenue (USD Million) by Type, and Applications (2018-2022)
7.1 Global 18650 and 21700 Battery Revenue (USD Million) by Type (2018-2022)
7.1.1 Global 18650 and 21700 Battery Revenue (USD Million), Market Share (%) by Type (2018-2022)
7.2 Global 18650 and 21700 Battery Revenue (USD Million) by Applications (2018-2022)
7.2.1 Global 18650 and 21700 Battery Revenue (USD Million), Market Share (%) by Applications (2018-2022)
8 Global 18650 and 21700 Battery Development Regional Status and Outlook
8.1 Global 18650 and 21700 Battery Revenue (USD Million) By Regions (2018-2022)
8.2 North America 18650 and 21700 Battery Revenue (USD Million) by Type, and Application (2018-2022)
8.2.1 North America 18650 and 21700 Battery Revenue (USD Million) by Country (2018-2022)
8.2.2 North America 18650 and 21700 Battery Revenue (USD Million) by Type (2018-2022)
8.2.3 North America 18650 and 21700 Battery Revenue (USD Million) by Applications (2018-2022)
8.3 Europe 18650 and 21700 Battery Revenue (USD Million), by Type, and Applications (USD Million) (2018-2022)
8.3.1 Europe 18650 and 21700 Battery Revenue (USD Million), by Country (2018-2022)
8.3.2 Europe 18650 and 21700 Battery Revenue (USD Million) by Type (2018-2022)
8.3.3 Europe 18650 and 21700 Battery Revenue (USD Million) by Applications (2018-2022)
8.4 Asia Pacific 18650 and 21700 Battery Revenue (USD Million), and Revenue (USD Million) by Type, and Applications (2018-2022)
8.4.1 Asia Pacific 18650 and 21700 Battery Revenue (USD Million) by Country (2018-2022)
8.4.2 Asia Pacific 18650 and 21700 Battery Revenue (USD Million) by Type (2018-2022)
8.4.3 Asia Pacific 18650 and 21700 Battery Revenue (USD Million) by Applications (2018-2022)
8.5 South America 18650 and 21700 Battery Revenue (USD Million), by Type, and Applications (2018-2022)
8.5.1 South America 18650 and 21700 Battery Revenue (USD Million), by Country (2018-2022)
8.5.2 South America 18650 and 21700 Battery Revenue (USD Million) by Type (2018-2022)
8.5.3 South America 18650 and 21700 Battery Revenue (USD Million) by Applications (2018-2022)
8.6 Middle East and Africa 18650 and 21700 Battery Revenue (USD Million), by Type, Technology, Application, Thickness (2018-2022)
8.6.1 Middle East and Africa 18650 and 21700 Battery Revenue (USD Million) by Country (2018-2022)
8.6.2 Middle East and Africa 18650 and 21700 Battery Revenue (USD Million) by Type (2018-2022)
8.6.3 Middle East and Africa 18650 and 21700 Battery Revenue (USD Million) by Applications (2018-2022)
9 Company Profiles
10 Global 18650 and 21700 Battery Market Revenue (USD Million), by Type, and Applications (2023-2030)
10.1 Global 18650 and 21700 Battery Revenue (USD Million) and Market Share (%) by Type (2023-2030)
10.1.1 Global 18650 and 21700 Battery Revenue (USD Million), and Market Share (%) by Type (2023-2030)
10.2 Global 18650 and 21700 Battery Revenue (USD Million) and Market Share (%) by Applications (2023-2030)
10.2.1 Global 18650 and 21700 Battery Revenue (USD Million), and Market Share (%) by Applications (2023-2030)
11 Global 18650 and 21700 Battery Development Regional Status and Outlook Forecast
11.1 Global 18650 and 21700 Battery Revenue (USD Million) By Regions (2023-2030)
11.2 North America 18650 and 21700 Battery Revenue (USD Million) by Type, and Applications (2023-2030)
11.2.1 North America 18650 and 21700 Battery Revenue (USD) Million by Country (2023-2030)
11.2.2 North America 18650 and 21700 Battery Revenue (USD Million), by Type (2023-2030)
11.2.3 North America 18650 and 21700 Battery Revenue (USD Million), Market Share (%) by Applications (2023-2030)
11.3 Europe 18650 and 21700 Battery Revenue (USD Million), by Type, and Applications (2023-2030)
11.3.1 Europe 18650 and 21700 Battery Revenue (USD Million), by Country (2023-2030)
11.3.2 Europe 18650 and 21700 Battery Revenue (USD Million), by Type (2023-2030)
11.3.3 Europe 18650 and 21700 Battery Revenue (USD Million), by Applications (2023-2030)
11.4 Asia Pacific 18650 and 21700 Battery Revenue (USD Million) by Type, and Applications (2023-2030)
11.4.1 Asia Pacific 18650 and 21700 Battery Revenue (USD Million), by Country (2023-2030)
11.4.2 Asia Pacific 18650 and 21700 Battery Revenue (USD Million), by Type (2023-2030)
11.4.3 Asia Pacific 18650 and 21700 Battery Revenue (USD Million), by Applications (2023-2030)
11.5 South America 18650 and 21700 Battery Revenue (USD Million), by Type, and Applications (2023-2030)
11.5.1 South America 18650 and 21700 Battery Revenue (USD Million), by Country (2023-2030)
11.5.2 South America 18650 and 21700 Battery Revenue (USD Million), by Type (2023-2030)
11.5.3 South America 18650 and 21700 Battery Revenue (USD Million), by Applications (2023-2030)
11.6 Middle East and Africa 18650 and 21700 Battery Revenue (USD Million), by Type, and Applications (2023-2030)
11.6.1 Middle East and Africa 18650 and 21700 Battery Revenue (USD Million), by Region (2023-2030)
11.6.2 Middle East and Africa 18650 and 21700 Battery Revenue (USD Million), by Type (2023-2030)
11.6.3 Middle East and Africa 18650 and 21700 Battery Revenue (USD Million), by Applications (2023-2030)
12 Methodology and Data Sources
12.1 Methodology/Research Approach
12.1.1 Research Programs/Design
12.1.2 Market Size Estimation
12.1.3 Market Breakdown and Data Triangulation
12.2 Data Sources
12.2.1 Secondary Sources
12.2.2 Primary Sources
12.3 Disclaimer
List Of Tables
Table 1 Market Segmentation Analysis
Table 2 Global 18650 and 21700 Battery Market Companies with Areas Served
Table 3 Products Offerings Global 18650 and 21700 Battery Market
Table 4 Low Growth Scenario Forecasts
Table 5 Reference Case Growth Scenario
Table 6 High Growth Case Scenario
Table 7 Global 18650 and 21700 Battery Revenue (USD Million) And CAGR (%) By Type (2018-2030)
Table 8 Global 18650 and 21700 Battery Revenue (USD Million) And CAGR (%) By Applications (2018-2030)
Table 9 Global 18650 and 21700 Battery Revenue (USD Million) And CAGR (%) By Regions (2018-2030)
Table 10 Global 18650 and 21700 Battery Revenue (USD Million) By Type (2018-2022)
Table 11 Global 18650 and 21700 Battery Revenue Market Share (%) By Type (2018-2022)
Table 12 Global 18650 and 21700 Battery Revenue (USD Million) By Applications (2018-2022)
Table 13 Global 18650 and 21700 Battery Revenue Market Share (%) By Applications (2018-2022)
Table 14 Global 18650 and 21700 Battery Market Revenue (USD Million) By Regions (2018-2022)
Table 15 Global 18650 and 21700 Battery Market Share (%) By Regions (2018-2022)
Table 16 North America 18650 and 21700 Battery Revenue (USD Million) By Country (2018-2022)
Table 17 North America 18650 and 21700 Battery Revenue (USD Million) By Type (2018-2022)
Table 18 North America 18650 and 21700 Battery Revenue (USD Million) By Applications (2018-2022)
Table 19 Europe 18650 and 21700 Battery Revenue (USD Million) By Country (2018-2022)
Table 20 Europe 18650 and 21700 Battery Revenue (USD Million) By Type (2018-2022)
Table 21 Europe 18650 and 21700 Battery Revenue (USD Million) By Applications (2018-2022)
Table 22 Asia Pacific 18650 and 21700 Battery Revenue (USD Million) By Country (2018-2022)
Table 23 Asia Pacific 18650 and 21700 Battery Revenue (USD Million) By Type (2018-2022)
Table 24 Asia Pacific 18650 and 21700 Battery Revenue (USD Million) By Applications (2018-2022)
Table 25 South America 18650 and 21700 Battery Revenue (USD Million) By Country (2018-2022)
Table 26 South America 18650 and 21700 Battery Revenue (USD Million) By Type (2018-2022)
Table 27 South America 18650 and 21700 Battery Revenue (USD Million) By Applications (2018-2022)
Table 28 Middle East and Africa 18650 and 21700 Battery Revenue (USD Million) By Region (2018-2022)
Table 29 Middle East and Africa 18650 and 21700 Battery Revenue (USD Million) By Type (2018-2022)
Table 30 Middle East and Africa 18650 and 21700 Battery Revenue (USD Million) By Applications (2018-2022)
Table 31 Financial Analysis
Table 32 Global 18650 and 21700 Battery Revenue (USD Million) By Type (2023-2030)
Table 33 Global 18650 and 21700 Battery Revenue Market Share (%) By Type (2023-2030)
Table 34 Global 18650 and 21700 Battery Revenue (USD Million) By Applications (2023-2030)
Table 35 Global 18650 and 21700 Battery Revenue Market Share (%) By Applications (2023-2030)
Table 36 Global 18650 and 21700 Battery Market Revenue (USD Million), And Revenue (USD Million) By Regions (2023-2030)
Table 37 North America 18650 and 21700 Battery Revenue (USD)By Country (2023-2030)
Table 38 North America 18650 and 21700 Battery Revenue (USD Million) By Type (2023-2030)
Table 39 North America 18650 and 21700 Battery Revenue (USD Million) By Applications (2023-2030)
Table 40 Europe 18650 and 21700 Battery Revenue (USD Million) By Country (2023-2030)
Table 41 Europe 18650 and 21700 Battery Revenue (USD Million) By Type (2023-2030)
Table 42 Europe 18650 and 21700 Battery Revenue (USD Million) By Applications (2023-2030)
Table 43 Asia Pacific 18650 and 21700 Battery Revenue (USD Million) By Country (2023-2030)
Table 44 Asia Pacific 18650 and 21700 Battery Revenue (USD Million) By Type (2023-2030)
Table 45 Asia Pacific 18650 and 21700 Battery Revenue (USD Million) By Applications (2023-2030)
Table 46 South America 18650 and 21700 Battery Revenue (USD Million) By Country (2023-2030)
Table 47 South America 18650 and 21700 Battery Revenue (USD Million) By Type (2023-2030)
Table 48 South America 18650 and 21700 Battery Revenue (USD Million) By Applications (2023-2030)
Table 49 Middle East and Africa 18650 and 21700 Battery Revenue (USD Million) By Region (2023-2030)
Table 50 Middle East and Africa 18650 and 21700 Battery Revenue (USD Million) By Region (2023-2030)
Table 51 Middle East and Africa 18650 and 21700 Battery Revenue (USD Million) By Type (2023-2030)
Table 52 Middle East and Africa 18650 and 21700 Battery Revenue (USD Million) By Applications (2023-2030)
Table 53 Research Programs/Design for This Report
Table 54 Key Data Information from Secondary Sources
Table 55 Key Data Information from Primary Sources
List Of Figures
Figure 1 Market Scope
Figure 2 Porter’s Five Forces
Figure 3 Global 18650 and 21700 Battery Revenue (USD Million) By Type (2018-2022)
Figure 4 Global 18650 and 21700 Battery Revenue Market Share (%) By Type (2022)
Figure 5 Global 18650 and 21700 Battery Revenue (USD Million) By Applications (2018-2022)
Figure 6 Global 18650 and 21700 Battery Revenue Market Share (%) By Applications (2022)
Figure 7 Global 18650 and 21700 Battery Market Revenue (USD Million) By Regions (2018-2022)
Figure 8 Global 18650 and 21700 Battery Market Share (%) By Regions (2022)
Figure 9 North America 18650 and 21700 Battery Revenue (USD Million) By Country (2018-2022)
Figure 10 North America 18650 and 21700 Battery Revenue (USD Million) By Type (2018-2022)
Figure 11 North America 18650 and 21700 Battery Revenue (USD Million) By Applications (2018-2022)
Figure 12 Europe 18650 and 21700 Battery Revenue (USD Million) By Country (2018-2022)
Figure 13 Europe 18650 and 21700 Battery Revenue (USD Million) By Type (2018-2022)
Figure 14 Europe 18650 and 21700 Battery Revenue (USD Million) By Applications (2018-2022)
Figure 15 Asia Pacific 18650 and 21700 Battery Revenue (USD Million) By Country (2018-2022)
Figure 16 Asia Pacific 18650 and 21700 Battery Revenue (USD Million) By Type (2018-2022)
Figure 17 Asia Pacific 18650 and 21700 Battery Revenue (USD Million) By Applications (2018-2022)
Figure 18 South America 18650 and 21700 Battery Revenue (USD Million) By Country (2018-2022)
Figure 19 South America 18650 and 21700 Battery Revenue (USD Million) By Type (2018-2022)
Figure 20 South America 18650 and 21700 Battery Revenue (USD Million) By Applications (2018-2022)
Figure 21 Middle East and Africa 18650 and 21700 Battery Revenue (USD Million) By Region (2018-2022)
Figure 22 Middle East and Africa 18650 and 21700 Battery Revenue (USD Million) By Type (2018-2022)
Figure 23 Middle East and Africa 18650 and 21700 Battery Revenue (USD Million) By Applications (2018-2022)
Figure 24 Global 18650 and 21700 Battery Revenue (USD Million) By Type (2023-2030)
Figure 25 Global 18650 and 21700 Battery Revenue Market Share (%) By Type (2030)
Figure 26 Global 18650 and 21700 Battery Revenue (USD Million) By Applications (2023-2030)
Figure 27 Global 18650 and 21700 Battery Revenue Market Share (%) By Applications (2030)
Figure 28 Global 18650 and 21700 Battery Market Revenue (USD Million) By Regions (2023-2030)
Figure 29 North America 18650 and 21700 Battery Revenue (USD Million) By Country (2023-2030)
Figure 30 North America 18650 and 21700 Battery Revenue (USD Million) By Type (2023-2030)
Figure 31 North America 18650 and 21700 Battery Revenue (USD Million) By Applications (2023-2030)
Figure 32 Europe 18650 and 21700 Battery Revenue (USD Million) By Country (2023-2030)
Figure 33 Europe 18650 and 21700 Battery Revenue (USD Million) By Type (2023-2030)
Figure 34 Europe 18650 and 21700 Battery Revenue (USD Million) By Applications (2023-2030)
Figure 35 Asia Pacific 18650 and 21700 Battery Revenue (USD Million) By Country (2023-2030)
Figure 36 Asia Pacific 18650 and 21700 Battery Revenue (USD Million) By Type (2023-2030)
Figure 37 Asia Pacific 18650 and 21700 Battery Revenue (USD Million) By Applications (2023-2030)
Figure 38 South America 18650 and 21700 Battery Revenue (USD Million) By Country (2023-2030)
Figure 39 South America 18650 and 21700 Battery Revenue (USD Million) By Type (2023-2030)
Figure 40 South America 18650 and 21700 Battery Revenue (USD Million) By Applications (2023-2030)
Figure 41 Middle East and Africa 18650 and 21700 Battery Revenue (USD Million) By Region (2023-2030)
Figure 42 Middle East and Africa 18650 and 21700 Battery Revenue (USD Million) By Region (2023-2030)
Figure 43 Middle East and Africa 18650 and 21700 Battery Revenue (USD Million) By Type (2023-2030)
Figure 44 Middle East and Africa 18650 and 21700 Battery Revenue (USD Million) By Applications (2023-2030)
Figure 45 Bottom-Up and Top-Down Approaches For This Report
Figure 46 Data Triangulation
