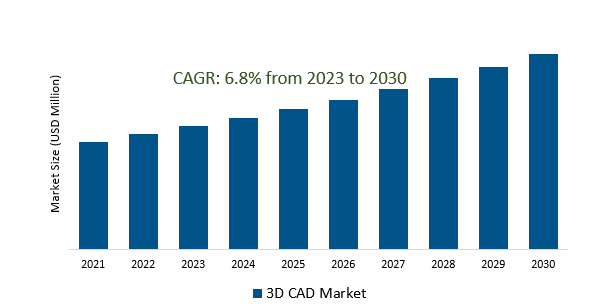
The 3D CAD Market Size is estimated to register 6.8% growth over the forecast period from 2023 to 2030.
3D CAD Market Overview
The growing need for innovation and product differentiation across industries is driving the adoption of advanced 3D CAD software. This shift towards digitalization fuels the demand for efficient design creation, modification, and simulation. The construction and architecture industries' growth and the shift towards Building Information Modeling (BIM) techniques contribute to the increased growth int the market. Features like flexibility, scalability, and collaborative capabilities, allowing designers to work remotely and collaborate on projects in real-time are increasingly contributing to the market growth. Increased availability and use of mobile-compatible applications, allowing designers to access and edit designs on smartphones and tablets, facilitating on-the-go design iterations and reviews.
3D CAD Market Dynamics
Market Trends- Convergence of CAD, CAE, and CAM in 3D CAD (Computer-Aided Design) Market.
Digital continuity enhancing traceability, facilitates design changes, and supports compliance and quality control efforts are the major factors.
Integrating CAD, CAE, and CAM functionalities is enabling engineers and designers to iterate and optimize designs while considering manufacturing constraints and simulations, thus reducing errors and enhancing overall product quality.
Businesses are experiencing minimization of rework, shorten development cycles, and optimize manufacturing processes, leading to reduced time-to-market and increased competitiveness.
Market Driver- Quality Focus and Design for Manufacturing (DFM) are driving the market demand.
Emphasis on the importance of creating designs that not only meet aesthetic and functional criteria but also consider manufacturability and efficiency in the production phase is contributing to the market growth.
Businesses are increasingly prioritizing quality in design processes ensuring that designs are optimized for the manufacturing process, reducing production costs, minimizing errors, and enhancing overall product quality.
The integration of DFM principles is enabling designers and engineers to simulate and evaluate the manufacturability of designs early in the development cycle to mitigate potential manufacturing issues is driving the market growth.
Market Opportunity- Expansive Impact of Construction and Architecture Growth in the 3D CAD Market.
The demand for precise and visually immersive representations of architectural designs, as well as the need for efficient collaboration among architects, engineers, and construction professionals are the major factors driving the market demand.
Companies within these sectors are seeking innovative CAD tools that enable enhanced visualization, simulation, and modeling of building designs to improve project efficiency, reduce errors, and optimize construction processes.
Furthermore, the adoption of Building Information Modeling (BIM) methodologies within the Construction and Architecture sectors is a significant driver, compelling the integration of 3D CAD solutions capable of supporting BIM workflows.
Market Share Analysis- Cloud will register the fastest growth
The 3D CAD Market is analyzed across Cloud and On-premises. Cloud is poised to register the fastest growth. They offer scalability, enabling users to adapt resources based on project requirements without the need for substantial hardware investments. This scalability feature facilitates cost-efficiency, particularly for smaller firms or projects requiring variable computational power. Further, the cloud fosters enhanced collaboration among global design teams by providing real-time access to centralized project data. This accessibility allows simultaneous editing, version control, and seamless communication across dispersed teams, thereby streamlining workflows and reducing project lead times. Design files stored on cloud servers are safeguarded against local hardware failures or data loss, ensuring data integrity and continuity of work processes.
Market Share Analysis- Architecture, Engineering, and Construction (AEC) held a significant market share in 2023
The 3D CAD Market is analyzed across various applications including Architecture, Engineering, Construction (AEC), Manufacturing, Automotive, Healthcare, Media & Entertainment & Others. Of these, Architecture, Engineering, and Construction (AEC) held a significant market share in 2023. In the AEC industry, 3D CAD software plays a pivotal role in enabling architects, engineers, and construction professionals to streamline design processes, enhance collaboration, and optimize project outcomes. Architects utilize CAD tools to create intricate, detailed, and realistic 3D models of buildings and structures, facilitating visualization and conceptualization during the design phase. These tools aid in creating accurate blueprints, floor plans, and architectural renderings, enabling stakeholders to visualize spatial relationships, aesthetics, and structural elements of buildings before construction commences. Engineers in the AEC sector utilize CAD software for structural analysis, designing systems, and infrastructure planning, ensuring the integrity and safety of building designs.
3D CAD Market Segmentation
By Type
By Application
- Architecture, Engineering, Construction (AEC)
- Manufacturing
- Automotive
- Healthcare
- Media & Entertainment
- Others
By Region
- North America (United States, Canada, Mexico)
- Europe (Germany, France, United Kingdom, Spain, Italy, Others)
- Asia Pacific (China, India, Japan, South Korea, Australia, Others)
- Latin America (Brazil, Argentina, Others)
- Middle East and Africa (Saudi Arabia, UAE, Kuwait, Other Middle East, South Africa, Nigeria, Other Africa)
3D CAD Market Companies
- Autodesk Inc
- Bentley Systems Inc
- Bricsvs NV
- Beijing generous Digital Technology Co Ltd
- Dassault Systemes
- Graphisoft
- Hexagon AB
- Oracle
- PTC
- Schott Systeme GmbH
- Siemens
- Dassault Systemes Solidworks Corporation
- ZWSOFT Co Ltd
*List not exhaustive
3D CAD Market Outlook 2023
1 Market Overview
1.1 Introduction to the 3D CAD Market
1.2 Scope of the Study
1.3 Research Objective
1.3.1 Key Market Scope and Segments
1.3.2 Players Covered
1.3.3 Years Considered
2 Executive Summary
2.1 2023 3D CAD Industry- Market Statistics
3 Market Dynamics
3.1 Market Drivers
3.2 Market Challenges
3.3 Market Opportunities
3.4 Market Trends
4 Market Factor Analysis
4.1 Porter’s Five Forces
4.2 Market Entropy
4.2.1 Global 3D CAD Market Companies with Area Served
4.2.2 Products Offerings Global 3D CAD Market
5 COVID-19 Impact Analysis and Outlook Scenarios
5.1.1 Covid-19 Impact Analysis
5.1.2 post-COVID-19 Scenario- Low Growth Case
5.1.3 post-COVID-19 Scenario- Reference Growth Case
5.1.4 post-COVID-19 Scenario- Low Growth Case
6 Global 3D CAD Market Trends
6.1 Global 3D CAD Revenue (USD Million) and CAGR (%) by Type (2018-2030)
6.2 Global 3D CAD Revenue (USD Million) and CAGR (%) by Applications (2018-2030)
6.3 Global 3D CAD Revenue (USD Million) and CAGR (%) by regions (2018-2030)
7 Global 3D CAD Market Revenue (USD Million) by Type, and Applications (2018-2022)
7.1 Global 3D CAD Revenue (USD Million) by Type (2018-2022)
7.1.1 Global 3D CAD Revenue (USD Million), Market Share (%) by Type (2018-2022)
7.2 Global 3D CAD Revenue (USD Million) by Applications (2018-2022)
7.2.1 Global 3D CAD Revenue (USD Million), Market Share (%) by Applications (2018-2022)
8 Global 3D CAD Development Regional Status and Outlook
8.1 Global 3D CAD Revenue (USD Million) By Regions (2018-2022)
8.2 North America 3D CAD Revenue (USD Million) by Type, and Application (2018-2022)
8.2.1 North America 3D CAD Revenue (USD Million) by Country (2018-2022)
8.2.2 North America 3D CAD Revenue (USD Million) by Type (2018-2022)
8.2.3 North America 3D CAD Revenue (USD Million) by Applications (2018-2022)
8.3 Europe 3D CAD Revenue (USD Million), by Type, and Applications (USD Million) (2018-2022)
8.3.1 Europe 3D CAD Revenue (USD Million), by Country (2018-2022)
8.3.2 Europe 3D CAD Revenue (USD Million) by Type (2018-2022)
8.3.3 Europe 3D CAD Revenue (USD Million) by Applications (2018-2022)
8.4 Asia Pacific 3D CAD Revenue (USD Million), and Revenue (USD Million) by Type, and Applications (2018-2022)
8.4.1 Asia Pacific 3D CAD Revenue (USD Million) by Country (2018-2022)
8.4.2 Asia Pacific 3D CAD Revenue (USD Million) by Type (2018-2022)
8.4.3 Asia Pacific 3D CAD Revenue (USD Million) by Applications (2018-2022)
8.5 South America 3D CAD Revenue (USD Million), by Type, and Applications (2018-2022)
8.5.1 South America 3D CAD Revenue (USD Million), by Country (2018-2022)
8.5.2 South America 3D CAD Revenue (USD Million) by Type (2018-2022)
8.5.3 South America 3D CAD Revenue (USD Million) by Applications (2018-2022)
8.6 Middle East and Africa 3D CAD Revenue (USD Million), by Type, Technology, Application, Thickness (2018-2022)
8.6.1 Middle East and Africa 3D CAD Revenue (USD Million) by Country (2018-2022)
8.6.2 Middle East and Africa 3D CAD Revenue (USD Million) by Type (2018-2022)
8.6.3 Middle East and Africa 3D CAD Revenue (USD Million) by Applications (2018-2022)
9 Company Profiles
10 Global 3D CAD Market Revenue (USD Million), by Type, and Applications (2023-2030)
10.1 Global 3D CAD Revenue (USD Million) and Market Share (%) by Type (2023-2030)
10.1.1 Global 3D CAD Revenue (USD Million), and Market Share (%) by Type (2023-2030)
10.2 Global 3D CAD Revenue (USD Million) and Market Share (%) by Applications (2023-2030)
10.2.1 Global 3D CAD Revenue (USD Million), and Market Share (%) by Applications (2023-2030)
11 Global 3D CAD Development Regional Status and Outlook Forecast
11.1 Global 3D CAD Revenue (USD Million) By Regions (2023-2030)
11.2 North America 3D CAD Revenue (USD Million) by Type, and Applications (2023-2030)
11.2.1 North America 3D CAD Revenue (USD) Million by Country (2023-2030)
11.2.2 North America 3D CAD Revenue (USD Million), by Type (2023-2030)
11.2.3 North America 3D CAD Revenue (USD Million), Market Share (%) by Applications (2023-2030)
11.3 Europe 3D CAD Revenue (USD Million), by Type, and Applications (2023-2030)
11.3.1 Europe 3D CAD Revenue (USD Million), by Country (2023-2030)
11.3.2 Europe 3D CAD Revenue (USD Million), by Type (2023-2030)
11.3.3 Europe 3D CAD Revenue (USD Million), by Applications (2023-2030)
11.4 Asia Pacific 3D CAD Revenue (USD Million) by Type, and Applications (2023-2030)
11.4.1 Asia Pacific 3D CAD Revenue (USD Million), by Country (2023-2030)
11.4.2 Asia Pacific 3D CAD Revenue (USD Million), by Type (2023-2030)
11.4.3 Asia Pacific 3D CAD Revenue (USD Million), by Applications (2023-2030)
11.5 South America 3D CAD Revenue (USD Million), by Type, and Applications (2023-2030)
11.5.1 South America 3D CAD Revenue (USD Million), by Country (2023-2030)
11.5.2 South America 3D CAD Revenue (USD Million), by Type (2023-2030)
11.5.3 South America 3D CAD Revenue (USD Million), by Applications (2023-2030)
11.6 Middle East and Africa 3D CAD Revenue (USD Million), by Type, and Applications (2023-2030)
11.6.1 Middle East and Africa 3D CAD Revenue (USD Million), by region (2023-2030)
11.6.2 Middle East and Africa 3D CAD Revenue (USD Million), by Type (2023-2030)
11.6.3 Middle East and Africa 3D CAD Revenue (USD Million), by Applications (2023-2030)
12 Methodology and Data Sources
12.1 Methodology/Research Approach
12.1.1 Research Programs/Design
12.1.2 Market Size Estimation
12.1.3 Market Breakdown and Data Triangulation
12.2 Data Sources
12.2.1 Secondary Sources
12.2.2 Primary Sources
12.3 Disclaimer
List of Tables
Table 1 Market Segmentation Analysis
Table 2 Global 3D CAD Market Companies with Areas Served
Table 3 Products Offerings Global 3D CAD Market
Table 4 Low Growth Scenario Forecasts
Table 5 Reference Case Growth Scenario
Table 6 High Growth Case Scenario
Table 7 Global 3D CAD Revenue (USD Million) And CAGR (%) By Type (2018-2030)
Table 8 Global 3D CAD Revenue (USD Million) And CAGR (%) By Applications (2018-2030)
Table 9 Global 3D CAD Revenue (USD Million) And CAGR (%) By Regions (2018-2030)
Table 10 Global 3D CAD Revenue (USD Million) By Type (2018-2022)
Table 11 Global 3D CAD Revenue Market Share (%) By Type (2018-2022)
Table 12 Global 3D CAD Revenue (USD Million) By Applications (2018-2022)
Table 13 Global 3D CAD Revenue Market Share (%) By Applications (2018-2022)
Table 14 Global 3D CAD Market Revenue (USD Million) By Regions (2018-2022)
Table 15 Global 3D CAD Market Share (%) By Regions (2018-2022)
Table 16 North America 3D CAD Revenue (USD Million) By Country (2018-2022)
Table 17 North America 3D CAD Revenue (USD Million) By Type (2018-2022)
Table 18 North America 3D CAD Revenue (USD Million) By Applications (2018-2022)
Table 19 Europe 3D CAD Revenue (USD Million) By Country (2018-2022)
Table 20 Europe 3D CAD Revenue (USD Million) By Type (2018-2022)
Table 21 Europe 3D CAD Revenue (USD Million) By Applications (2018-2022)
Table 22 Asia Pacific 3D CAD Revenue (USD Million) By Country (2018-2022)
Table 23 Asia Pacific 3D CAD Revenue (USD Million) By Type (2018-2022)
Table 24 Asia Pacific 3D CAD Revenue (USD Million) By Applications (2018-2022)
Table 25 South America 3D CAD Revenue (USD Million) By Country (2018-2022)
Table 26 South America 3D CAD Revenue (USD Million) By Type (2018-2022)
Table 27 South America 3D CAD Revenue (USD Million) By Applications (2018-2022)
Table 28 Middle East and Africa 3D CAD Revenue (USD Million) By Region (2018-2022)
Table 29 Middle East and Africa 3D CAD Revenue (USD Million) By Type (2018-2022)
Table 30 Middle East and Africa 3D CAD Revenue (USD Million) By Applications (2018-2022)
Table 31 Financial Analysis
Table 32 Global 3D CAD Revenue (USD Million) By Type (2023-2030)
Table 33 Global 3D CAD Revenue Market Share (%) By Type (2023-2030)
Table 34 Global 3D CAD Revenue (USD Million) By Applications (2023-2030)
Table 35 Global 3D CAD Revenue Market Share (%) By Applications (2023-2030)
Table 36 Global 3D CAD Market Revenue (USD Million), And Revenue (USD Million) By Regions (2023-2030)
Table 37 North America 3D CAD Revenue (USD)By Country (2023-2030)
Table 38 North America 3D CAD Revenue (USD Million) By Type (2023-2030)
Table 39 North America 3D CAD Revenue (USD Million) By Applications (2023-2030)
Table 40 Europe 3D CAD Revenue (USD Million) By Country (2023-2030)
Table 41 Europe 3D CAD Revenue (USD Million) By Type (2023-2030)
Table 42 Europe 3D CAD Revenue (USD Million) By Applications (2023-2030)
Table 43 Asia Pacific 3D CAD Revenue (USD Million) By Country (2023-2030)
Table 44 Asia Pacific 3D CAD Revenue (USD Million) By Type (2023-2030)
Table 45 Asia Pacific 3D CAD Revenue (USD Million) By Applications (2023-2030)
Table 46 South America 3D CAD Revenue (USD Million) By Country (2023-2030)
Table 47 South America 3D CAD Revenue (USD Million) By Type (2023-2030)
Table 48 South America 3D CAD Revenue (USD Million) By Applications (2023-2030)
Table 49 Middle East and Africa 3D CAD Revenue (USD Million) By Region (2023-2030)
Table 50 Middle East and Africa 3D CAD Revenue (USD Million) By Region (2023-2030)
Table 51 Middle East and Africa 3D CAD Revenue (USD Million) By Type (2023-2030)
Table 52 Middle East and Africa 3D CAD Revenue (USD Million) By Applications (2023-2030)
Table 53 Research Programs/Design for This Report
Table 54 Key Data Information from Secondary Sources
Table 55 Key Data Information from Primary Sources
List of Figures
Figure 1 Market Scope
Figure 2 Porter’s Five Forces
Figure 3 Global 3D CAD Revenue (USD Million) By Type (2018-2022)
Figure 4 Global 3D CAD Revenue Market Share (%) By Type (2022)
Figure 5 Global 3D CAD Revenue (USD Million) By Applications (2018-2022)
Figure 6 Global 3D CAD Revenue Market Share (%) By Applications (2022)
Figure 7 Global 3D CAD Market Revenue (USD Million) By Regions (2018-2022)
Figure 8 Global 3D CAD Market Share (%) By Regions (2022)
Figure 9 North America 3D CAD Revenue (USD Million) By Country (2018-2022)
Figure 10 North America 3D CAD Revenue (USD Million) By Type (2018-2022)
Figure 11 North America 3D CAD Revenue (USD Million) By Applications (2018-2022)
Figure 12 Europe 3D CAD Revenue (USD Million) By Country (2018-2022)
Figure 13 Europe 3D CAD Revenue (USD Million) By Type (2018-2022)
Figure 14 Europe 3D CAD Revenue (USD Million) By Applications (2018-2022)
Figure 15 Asia Pacific 3D CAD Revenue (USD Million) By Country (2018-2022)
Figure 16 Asia Pacific 3D CAD Revenue (USD Million) By Type (2018-2022)
Figure 17 Asia Pacific 3D CAD Revenue (USD Million) By Applications (2018-2022)
Figure 18 South America 3D CAD Revenue (USD Million) By Country (2018-2022)
Figure 19 South America 3D CAD Revenue (USD Million) By Type (2018-2022)
Figure 20 South America 3D CAD Revenue (USD Million) By Applications (2018-2022)
Figure 21 Middle East and Africa 3D CAD Revenue (USD Million) By Region (2018-2022)
Figure 22 Middle East and Africa 3D CAD Revenue (USD Million) By Type (2018-2022)
Figure 23 Middle East and Africa 3D CAD Revenue (USD Million) By Applications (2018-2022)
Figure 24 Global 3D CAD Revenue (USD Million) By Type (2023-2030)
Figure 25 Global 3D CAD Revenue Market Share (%) By Type (2030)
Figure 26 Global 3D CAD Revenue (USD Million) By Applications (2023-2030)
Figure 27 Global 3D CAD Revenue Market Share (%) By Applications (2030)
Figure 28 Global 3D CAD Market Revenue (USD Million) By Regions (2023-2030)
Figure 29 North America 3D CAD Revenue (USD Million) By Country (2023-2030)
Figure 30 North America 3D CAD Revenue (USD Million) By Type (2023-2030)
Figure 31 North America 3D CAD Revenue (USD Million) By Applications (2023-2030)
Figure 32 Europe 3D CAD Revenue (USD Million) By Country (2023-2030)
Figure 33 Europe 3D CAD Revenue (USD Million) By Type (2023-2030)
Figure 34 Europe 3D CAD Revenue (USD Million) By Applications (2023-2030)
Figure 35 Asia Pacific 3D CAD Revenue (USD Million) By Country (2023-2030)
Figure 36 Asia Pacific 3D CAD Revenue (USD Million) By Type (2023-2030)
Figure 37 Asia Pacific 3D CAD Revenue (USD Million) By Applications (2023-2030)
Figure 38 South America 3D CAD Revenue (USD Million) By Country (2023-2030)
Figure 39 South America 3D CAD Revenue (USD Million) By Type (2023-2030)
Figure 40 South America 3D CAD Revenue (USD Million) By Applications (2023-2030)
Figure 41 Middle East and Africa 3D CAD Revenue (USD Million) By Region (2023-2030)
Figure 42 Middle East and Africa 3D CAD Revenue (USD Million) By Region (2023-2030)
Figure 43 Middle East and Africa 3D CAD Revenue (USD Million) By Type (2023-2030)
Figure 44 Middle East and Africa 3D CAD Revenue (USD Million) By Applications (2023-2030)
Figure 45 Bottom-Up and Top-Down Approaches for This Report
Figure 46 Data Triangulation
