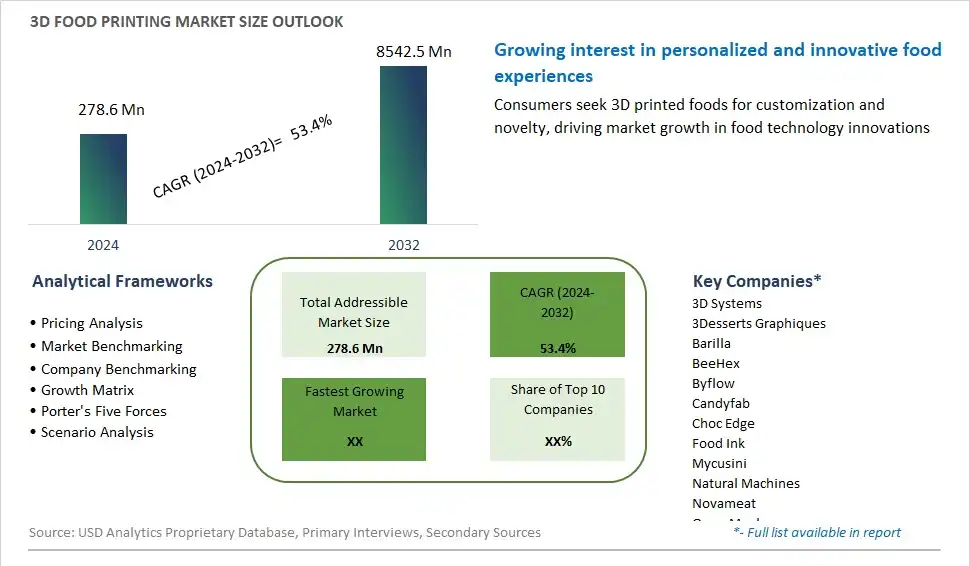
Global 3D Food Printing Market Size is valued at $278.6 Million in 2024 and is forecast to register a growth rate (CAGR) of 53.4% to reach $8542.5 Million by 2032.
The global 3D Food Printing Market Comprehensive Study analyzes and forecasts the market size across 6 regions and 24 countries for diverse segments -By Ingredient (Dough, Fruits and vegetables, Proteins, Sauces, Dairy Products, Carbohydrates, Others), By End-User (Education, Government, Defense, Commercial, Others), By Technology (Extrusion-based printing, Binder jetting, Selective laser sintering, Inkjet printing)
An Introduction to 3D Food Printing Market
In 2024, 3D food printing technology represents a cutting-edge innovation in the culinary world, offering unprecedented opportunities for customization, creativity, and sustainability in food production. This revolutionary technology utilizes edible ingredients and food-grade materials to create intricate and customizable shapes, textures, and designs, allowing chefs, food manufacturers, and consumers to experiment with novel culinary creations. From personalized chocolates and intricate sugar sculptures to bespoke pasta shapes and nutritionally optimized snacks, 3D food printing opens up a world of possibilities for food customization and innovation. With advancements in printing technology, materials science, and culinary expertise, 3D food printing is poised to revolutionize the way we prepare, consume, and experience food, offering solutions to challenges such as food waste, supply chain inefficiencies, and dietary restrictions. As interest and investment in 3D food printing continue to grow, the technology holds the potential to transform the future of food production and consumption, ushering in a new era of culinary creativity, sustainability, and accessibility.
3D Food Printing Competitive Landscape
The market report analyses the leading companies in the industry including 3D Systems, 3Desserts Graphiques, Barilla, BeeHex, Byflow, Candyfab, Choc Edge, Food Ink, Mycusini, Natural Machines, Novameat, Open Meals, Procusini, Redefine Meat Ltd, Savoureat Ltd, Systems & Materials Research Corp, The Sugar Lab, TNO, Wiibox, Zmorph, and Others.
3D Food Printing Market Dynamics
3D Food Printing Market Trend: Advancements in Technology and Customization
A significant trend in the 3D food printing market is the continuous advancements in technology and customization capabilities. As technology evolves, 3D food printing systems are becoming more sophisticated, enabling the creation of intricate and customized food designs with greater precision and efficiency. This trend is driven by the increasing demand for personalized food experiences, as consumers seek unique and visually appealing dishes tailored to their preferences and dietary needs. From personalized cake decorations to intricately designed pasta shapes, 3D food printing offers endless possibilities for culinary creativity and customization. Additionally, advancements in food-grade materials and printing techniques are expanding the range of ingredients that can be used in 3D food printing, further fueling innovation and experimentation in the market.
Market Driver: Demand for Sustainable and Novel Food Production Methods
A significant driver propelling the growth of the 3D food printing market is the increasing demand for sustainable and novel food production methods. As concerns about food sustainability, waste reduction, and environmental impact grow, there's a greater emphasis on exploring alternative approaches to food manufacturing and distribution. 3D food printing offers a promising solution to these challenges by enabling more efficient use of ingredients, reduced food waste, and customizable portion sizes. Additionally, 3D food printing has the potential to revolutionize the way food is produced and distributed, offering opportunities for on-demand food production, localized manufacturing, and supply chain optimization. The growing interest in sustainable food systems and innovative technologies is driving investment and innovation in the 3D food printing market, driving market expansion and adoption across various sectors.
Market Opportunity: Expansion into Culinary Education and Food Service Industries
An opportunity within the 3D food printing market lies in expansion into culinary education and the food service industries to showcase the potential of this technology and drive adoption. While 3D food printing is still relatively niche, there's room for growth and integration into culinary curriculums, professional kitchens, and food service establishments. By partnering with culinary schools, chefs, and hospitality businesses, 3D food printing companies can offer training programs, workshops, and consulting services to educate chefs and culinary professionals about the possibilities and applications of 3D food printing in menu development, food presentation, and guest experiences. Additionally, there's potential for collaboration with food service providers to integrate 3D food printing technology into their operations, offering customers unique and customizable dining experiences. By leveraging partnerships and educational initiatives, 3D food printing companies can drive awareness, acceptance, and adoption of this innovative technology in the culinary and food service industries, unlocking new market opportunities and revenue streams.
3D Food Printing Market Share Analysis: Proteins market is poised to register the fastest growth rae over the forecast period to 2032
The protein segment is the fastest growing in the 3D food printing market, driven by the increasing demand for customized and nutritious food products. 3D food printing allows for precise control over the nutritional content and texture of printed foods, making it an ideal solution for producing protein-rich foods tailored to specific dietary needs and preferences. This technology is particularly beneficial for the growing number of consumers seeking high-protein diets for health, fitness, and dietary reasons. Innovations in alternative proteins, such as plant-based and lab-grown meat, are also contributing to the segment's growth. 3D printing technology can efficiently utilize these novel protein sources to create complex and appealing food structures that would be challenging to achieve through traditional manufacturing methods. Furthermore, the application of 3D food printing in healthcare settings for personalized nutrition and in the foodservice industry for creating unique culinary experiences is driving the adoption of protein-based 3D printed foods. As the technology continues to evolve, the protein segment is expected to see substantial growth, capitalizing on the trend towards personalized and sustainable nutrition solutions.
3D Food Printing Market Share Analysis: Commercial Segment market is poised to register the fastest growth rae over the forecast period to 2032
The commercial segment is the fastest growing in the 3D food printing market, driven by its wide-ranging applications and the increasing adoption by restaurants, bakeries, and food service providers. Businesses in the commercial sector are leveraging 3D food printing technology to enhance culinary creativity, improve efficiency, and offer unique dining experiences that attract customers. This technology allows chefs and food manufacturers to produce intricate and customized food designs that are otherwise difficult to achieve with traditional methods, catering to the growing consumer demand for personalized and visually appealing food. Additionally, 3D food printing offers significant benefits in terms of reducing food waste and optimizing ingredient usage, which aligns with the increasing focus on sustainability in the food industry. The ability to innovate and quickly bring new products to market provides a competitive edge for commercial enterprises, particularly in the high-end and specialty food markets. As technology becomes more accessible and cost-effective, its adoption is expanding from niche gourmet restaurants to more mainstream foodservice operations. Consequently, the commercial segment is experiencing rapid growth, transforming how food is prepared, presented, and consumed in the hospitality and retail sectors.
3D Food Printing Market Share Analysis: Extrusion-Based Printing market is poised to register the fastest growth rae over the forecast period to 2032
Extrusion-based printing is the largest and fastest growing segment in the 3D food printing market, primarily due to its versatility, ease of use, and ability to handle a wide range of food materials. This technology works by extruding food pastes or purees through a nozzle to build up layers and create complex shapes and designs. The flexibility of extrusion-based printing allows it to accommodate various ingredients, including dough, chocolate, cheese, and even protein pastes, making it suitable for diverse culinary applications. Its relatively straightforward mechanism and compatibility with numerous food types make it a popular choice for both commercial kitchens and research institutions exploring innovative food solutions. Additionally, extrusion-based printers are often more affordable and easier to scale compared to other 3D food printing technologies, further driving their adoption in the market. The continuous improvements in nozzle design and material handling capabilities are enhancing the precision and quality of printed foods, making this technology increasingly attractive for creating customized, nutritious, and visually appealing food products. As the demand for personalized nutrition and unique culinary experiences grows, extrusion-based printing is expected to maintain its leading position and drive significant advancements in the 3D food printing industry.
3D Food Printing Market Segmentation
By Ingredient
Dough
Fruits and vegetables
Proteins
Sauces
Dairy Products
Carbohydrates
Others
By End-User
Education
Government
Defense
Commercial
Others
By Technology
Extrusion-based printing
Binder jetting
Selective laser sintering
Inkjet printing
Countries Analyzed
North America (US, Canada, Mexico)
Europe (Germany, UK, France, Spain, Italy, Russia, Rest of Europe)
Asia Pacific (China, India, Japan, South Korea, Australia, South East Asia, Rest of Asia)
South America (Brazil, Argentina, Rest of South America)
Middle East and Africa (Saudi Arabia, UAE, Rest of Middle East, South Africa, Egypt, Rest of Africa)
3D Food Printing Companies Profiled in the Study
3D Systems
3Desserts Graphiques
Barilla
BeeHex
Byflow
Candyfab
Choc Edge
Food Ink
Mycusini
Natural Machines
Novameat
Open Meals
Procusini
Redefine Meat Ltd
Savoureat Ltd
Systems & Materials Research Corp
The Sugar Lab
TNO
Wiibox
Zmorph
*- List Not Exhaustive
Chapter 1. TABLE OF CONTENTS
Chapter 2. Introduction to 3D Food Printing Market
2.1. Market Overview
2.2. Key Statistics and Report Highlights
2.3. Scope of the Comprehensive Study
2.3.1. Market Definition
2.3.2 Countries and Regions Covered
2.3.3 Research Objective
2.3.4 Units, Currency, and Conversions
2.3.5 Industry Value Chain
2.4. Key Market Segments
2.5. Key Companies
2.6. Study Period
Chapter 3. Strategic Analysis Review
3.1. 3D Food Printing Pricing Analysis and Forecast
3.2. Porter’s Five Forces
3.3. Market Ecosystem
3.4. SWOT Analysis
3.5. Regulatory Scenario
3.3. Effects of Inflation, Russia-Ukraine War, moderating economic growth, and other macroeconomic factors
Chapter 4. Competitive Landscape
4.1. Market Share Analysis
4.1.1. Global 3D Food Printing Market Share by Company, 2023
4.1.2. Product Offerings of Leading 3D Food Printing Companies
4.2. Market Entropy
4.2.1. New Product Launches in the Industry
4.2.2. Mergers, Acquisitions, Joint ventures, and Partnerships
4.3. Key Strategies and Best Practices
Chapter 5. Global Market Projections: Best, Reference, and Low Case Scenarios
5.1. Growth Analysis- Case Scenario Definitions
5.2. Low Growth Case Scenario Forecasts
5.3. Reference Growth Case Scenario Forecasts
5.4. High Growth Case Scenario Forecasts
Chapter 6. Market Dynamics
6.1. 3D Food Printing Market Drivers
6.2. 3D Food Printing Market Challenges
6.6. 3D Food Printing Market Opportunities
6.4. 3D Food Printing Market Trends
Chapter 7. Global 3D Food Printing Market Outlook Trends
7.1. Global 3D Food Printing Revenue (USD Million) and CAGR (%) by Type (2021-2032)
7.2. Global 3D Food Printing Revenue (USD Million) and CAGR (%) by Application (2021-2032)
7.3. Global 3D Food Printing Revenue (USD Million) and CAGR (%) by Product (2021-2032)
By Ingredient
Dough
Fruits and vegetables
Proteins
Sauces
Dairy Products
Carbohydrates
Others
By End-User
Education
Government
Defense
Commercial
Others
By Technology
Extrusion-based printing
Binder jetting
Selective laser sintering
Inkjet printing
Chapter 8. Global 3D Food Printing Regional Analysis and Outlook
8.1. Global 3D Food Printing Revenue (USD Million) By Regions (2021- 2032)
8.2. North America 3D Food Printing Revenue (USD Million) by Country (2021-2032)
8.2.1. United States 3D Food Printing Regional Analysis and Outlook
8.2.2. Canada 3D Food Printing Regional Analysis and Outlook
8.2.3. Mexico 3D Food Printing Regional Analysis and Outlook
8.3. Europe 3D Food Printing Revenue (USD Million), by Country (2021-2032)
8.3.1. Germany 3D Food Printing Regional Analysis and Outlook
8.3.2. France 3D Food Printing Regional Analysis and Outlook
8.3.3. United Kingdom 3D Food Printing Regional Analysis and Outlook
8.3.4. Spain 3D Food Printing Regional Analysis and Outlook
8.3.5. Italy 3D Food Printing Regional Analysis and Outlook
8.3.6. Russia 3D Food Printing Regional Analysis and Outlook
8.3.7. Rest of Europe 3D Food Printing Regional Analysis and Outlook
8.4. Asia Pacific 3D Food Printing Revenue (USD Million) by Country (2021-2032)
8.4.1. China 3D Food Printing Regional Analysis and Outlook
8.4.2. Japan 3D Food Printing Regional Analysis and Outlook
8.4.3. India 3D Food Printing Regional Analysis and Outlook
8.4.4. South Korea 3D Food Printing Regional Analysis and Outlook
8.4.5. Australia 3D Food Printing Regional Analysis and Outlook
8.4.6. South East Asia 3D Food Printing Regional Analysis and Outlook
8.4.7. Rest of Asia Pacific 3D Food Printing Regional Analysis and Outlook
8.5. South America 3D Food Printing Revenue (USD Million), by Country (2021-2032)
8.5.1. Brazil 3D Food Printing Regional Analysis and Outlook
8.5.2. Argentina 3D Food Printing Regional Analysis and Outlook
8.5.3. Rest of South America 3D Food Printing Regional Analysis and Outlook
8.6. Middle East and Africa 3D Food Printing Revenue (USD Million) by Country (2021-2032)
8.6.1. Middle East 3D Food Printing Regional Analysis and Outlook
8.6.2. Africa 3D Food Printing Regional Analysis and Outlook
Chapter 9. North America 3D Food Printing Analysis and Outlook
9.1. North America 3D Food Printing Revenue (USD Million) by Segments (2021-2032)
9.1.1. North America 3D Food Printing Revenue (USD Million) by Type (2021-2032)
9.1.2. North America 3D Food Printing Revenue (USD Million) by Application (2021-2032)
9.1.3. North America 3D Food Printing Revenue (USD Million) by Product (2021-2032)
By Ingredient
Dough
Fruits and vegetables
Proteins
Sauces
Dairy Products
Carbohydrates
Others
By End-User
Education
Government
Defense
Commercial
Others
By Technology
Extrusion-based printing
Binder jetting
Selective laser sintering
Inkjet printing
Chapter 10. Europe 3D Food Printing Analysis and Outlook
10.1. Europe 3D Food Printing Revenue (USD Million), by Segments (USD Million) (2021-2032)
10.1.1. Europe 3D Food Printing Revenue (USD Million) by Type (2021-2032)
10.1.2. Europe 3D Food Printing Revenue (USD Million) by Application (2021-2032)
10.1.3. Europe 3D Food Printing Revenue (USD Million) by Product (2021-2032)
By Ingredient
Dough
Fruits and vegetables
Proteins
Sauces
Dairy Products
Carbohydrates
Others
By End-User
Education
Government
Defense
Commercial
Others
By Technology
Extrusion-based printing
Binder jetting
Selective laser sintering
Inkjet printing
Chapter 11. Asia Pacific 3D Food Printing Analysis and Outlook
11.1. Asia Pacific 3D Food Printing Revenue (USD Million), and Revenue (USD Million) by Segments (2021-2032)
11.1.1. Asia Pacific 3D Food Printing Revenue (USD Million) by Type (2021-2032)
11.1.2. Asia Pacific 3D Food Printing Revenue (USD Million) by Application (2021-2032)
11.1.3. Asia Pacific 3D Food Printing Revenue (USD Million) by Product (2021-2032)
By Ingredient
Dough
Fruits and vegetables
Proteins
Sauces
Dairy Products
Carbohydrates
Others
By End-User
Education
Government
Defense
Commercial
Others
By Technology
Extrusion-based printing
Binder jetting
Selective laser sintering
Inkjet printing
Chapter 12. South America 3D Food Printing Analysis and Outlook
12.1. South America 3D Food Printing Revenue (USD Million), by Segments (2021-2032)
12.1.1. South America 3D Food Printing Revenue (USD Million) by Type (2021-2032)
12.1.2. South America 3D Food Printing Revenue (USD Million) by Application (2021-2032)
12.1.3. South America 3D Food Printing Revenue (USD Million) by Product (2021-2032)
By Ingredient
Dough
Fruits and vegetables
Proteins
Sauces
Dairy Products
Carbohydrates
Others
By End-User
Education
Government
Defense
Commercial
Others
By Technology
Extrusion-based printing
Binder jetting
Selective laser sintering
Inkjet printing
Chapter 13. Middle East and Africa 3D Food Printing Analysis and Outlook
13.1. Middle East and Africa 3D Food Printing Revenue (USD Million), by Segments (2021-2032)
13.1.1. Middle East and Africa 3D Food Printing Revenue (USD Million) by Type (2021-2032)
13.1.2. Middle East and Africa 3D Food Printing Revenue (USD Million) by Application (2021-2032)
13.1.3. Middle East and Africa 3D Food Printing Revenue (USD Million) by Product (2021-2032)
By Ingredient
Dough
Fruits and vegetables
Proteins
Sauces
Dairy Products
Carbohydrates
Others
By End-User
Education
Government
Defense
Commercial
Others
By Technology
Extrusion-based printing
Binder jetting
Selective laser sintering
Inkjet printing
Chapter 14. 3D Food Printing Company Profiles
14.1 Business Overview
14.2 Product Profiles
14.3 SWOT Profiles
14.5 Recent Developments
14.6 Financial Profile
List of Companies
3D Systems
3Desserts Graphiques
Barilla
BeeHex
Byflow
Candyfab
Choc Edge
Food Ink
Mycusini
Natural Machines
Novameat
Open Meals
Procusini
Redefine Meat Ltd
Savoureat Ltd
Systems & Materials Research Corp
The Sugar Lab
TNO
Wiibox
Zmorph
15. Methodology and Data Sources
15.1 Customization Offerings
15.2 Subscription Services
15.3 Related Reports
15.4 Publisher Expertise
LIST OF TABLES
Table 1 Market Segmentation Analysis
Table 2 Global 3D Food Printing Market Share of Leading Companies, 2023
Table 3 Product Offerings of Leading Companies
Table 4 Low Growth Scenario Forecasts
Table 5 Reference Case Growth Scenario
Table 6 High Growth Case Scenario
Table 7 Global 3D Food Printing Revenue (USD Million) And CAGR (%) By Type (2021-2032)
Table 8 Global 3D Food Printing Revenue (USD Million) And CAGR (%) By Application (2021-2032)
Table 9 Global 3D Food Printing Revenue (USD Million) And CAGR (%) By Product (2021-2032)
Table 10 Global 3D Food Printing Market Revenue (USD Million) By Regions (2021-2032)
Table 11 Global 3D Food Printing Market Share (%) By Regions (2021-2032)
Table 12 North America 3D Food Printing Revenue (USD Million) By Country (2021-2032)
Table 13 Europe 3D Food Printing Revenue (USD Million) By Country (2021-2032)
Table 14 Asia Pacific 3D Food Printing Revenue (USD Million) By Country (2021-2032)
Table 15 South America 3D Food Printing Revenue (USD Million) By Country (2021-2032)
Table 16 Middle East and Africa 3D Food Printing Revenue (USD Million) By Region (2021-2032)
Table 17 North America 3D Food Printing Revenue (USD Million) By Type (2021-2032)
Table 18 North America 3D Food Printing Revenue (USD Million) By Application (2021-2032)
Table 19 North America 3D Food Printing Revenue (USD Million) By Product (2021-2032)
Table 20 Europe 3D Food Printing Revenue (USD Million) By Type (2021-2032)
Table 21 Europe 3D Food Printing Revenue (USD Million) By Application (2021-2032)
Table 22 Europe 3D Food Printing Revenue (USD Million) By Product (2021-2032)
Table 23 Asia Pacific 3D Food Printing Revenue (USD Million) By Type (2021-2032)
Table 24 Asia Pacific 3D Food Printing Revenue (USD Million) By Application (2021-2032)
Table 25 Asia Pacific 3D Food Printing Revenue (USD Million) By Product (2021-2032)
Table 26 South America 3D Food Printing Revenue (USD Million) By Type (2021-2032)
Table 27 South America 3D Food Printing Revenue (USD Million) By Application (2021-2032)
Table 28 South America 3D Food Printing Revenue (USD Million) By Product (2021-2032)
Table 29 Middle East and Africa 3D Food Printing Revenue (USD Million) By Type (2021-2032)
Table 30 Middle East and Africa 3D Food Printing Revenue (USD Million) By Application (2021-2032)
Table 31 Middle East and Africa 3D Food Printing Revenue (USD Million) By Product (2021-2032)
LIST OF FIGURES
Figure 1. Market Scope
Figure 2. Pricing Forecasts Per Unit, 2023- 2032
Figure 3. Porter’s Five Forces
Figure 4. Global 3D Food Printing Market Revenue (USD Million) By Regions (2021-2032)
Figure 5. Global 3D Food Printing Market Share (%) By Regions (2023)
Figure 6. North America 3D Food Printing Revenue (USD Million) By Country (2021-2032)
Figure 7. United States 3D Food Printing Revenue (USD Million) By Country (2021-2032)
Figure 8. Canada 3D Food Printing Revenue (USD Million) By Country (2021-2032)
Figure 9. Mexico 3D Food Printing Revenue (USD Million) By Country (2021-2032)
Figure 10. Europe 3D Food Printing Revenue (USD Million) By Country (2021-2032)
Figure 11. Germany 3D Food Printing Revenue (USD Million) By Country (2021-2032)
Figure 12. France 3D Food Printing Revenue (USD Million) By Country (2021-2032)
Figure 13. United Kingdom 3D Food Printing Revenue (USD Million) By Country (2021-2032)
Figure 14. Spain 3D Food Printing Revenue (USD Million) By Country (2021-2032)
Figure 15. Italy 3D Food Printing Revenue (USD Million) By Country (2021-2032)
Figure 16. Russia 3D Food Printing Revenue (USD Million) By Country (2021-2032)
Figure 17. Rest of Europe 3D Food Printing Revenue (USD Million) By Country (2021-2032)
Figure 11. Asia Pacific 3D Food Printing Revenue (USD Million) By Country (2021-2032)
Figure 12. China 3D Food Printing Revenue (USD Million) By Country (2021-2032)
Figure 13. Japan 3D Food Printing Revenue (USD Million) By Country (2021-2032)
Figure 14. India 3D Food Printing Revenue (USD Million) By Country (2021-2032)
Figure 15. South Korea 3D Food Printing Revenue (USD Million) By Country (2021-2032)
Figure 16. Australia 3D Food Printing Revenue (USD Million) By Country (2021-2032)
Figure 17. South East Asia 3D Food Printing Revenue (USD Million) By Country (2021-2032)
Figure 18. South America 3D Food Printing Revenue (USD Million) By Country (2021-2032)
Figure 19. Brazil 3D Food Printing Revenue (USD Million) By Country (2021-2032)
Figure 20. Argentina 3D Food Printing Revenue (USD Million) By Country (2021-2032)
Figure 21. Rest of Asia Pacific 3D Food Printing Revenue (USD Million) By Country (2021-2032)
Figure 22. Middle East and Africa 3D Food Printing Revenue (USD Million) By Region (2021-2032)
Figure 23. Saudi Arabia 3D Food Printing Revenue (USD Million) By Region (2021-2032)
Figure 24. The UAE 3D Food Printing Revenue (USD Million) By Region (2021-2032)
Figure 25. Rest of Middle East 3D Food Printing Revenue (USD Million) By Region (2021-2032)
Figure 26. South Africa 3D Food Printing Revenue (USD Million) By Region (2021-2032)
Figure 27. Africa 3D Food Printing Revenue (USD Million) By Region (2021-2032)
Figure 28. North America 3D Food Printing Revenue (USD Million) By Type (2021-2032)
Figure 29. North America 3D Food Printing Revenue (USD Million) By Application (2021-2032)
Figure 30. North America 3D Food Printing Revenue (USD Million) By Product (2021-2032)
Figure 31. Europe 3D Food Printing Revenue (USD Million) By Type (2021-2032)
Figure 32. Europe 3D Food Printing Revenue (USD Million) By Application (2021-2032)
Figure 33. Europe 3D Food Printing Revenue (USD Million) By Product (2021-2032)
Figure 34. Asia Pacific 3D Food Printing Revenue (USD Million) By Type (2021-2032)
Figure 35. Asia Pacific 3D Food Printing Revenue (USD Million) By Application (2021-2032)
Figure 36. Asia Pacific 3D Food Printing Revenue (USD Million) By Product (2021-2032)
Figure 37. South America 3D Food Printing Revenue (USD Million) By Type (2021-2032)
Figure 38. South America 3D Food Printing Revenue (USD Million) By Application (2021-2032)
Figure 39. South America 3D Food Printing Revenue (USD Million) By Product (2021-2032)
Figure 40. Middle East and Africa 3D Food Printing Revenue (USD Million) By Type (2021-2032)
Figure 41. Middle East and Africa 3D Food Printing Revenue (USD Million) By Application (2021-2032)
Figure 42. Middle East and Africa 3D Food Printing Revenue (USD Million) By Product (2021-2032)
By Ingredient
Dough
Fruits and vegetables
Proteins
Sauces
Dairy Products
Carbohydrates
Others
By End-User
Education
Government
Defense
Commercial
Others
By Technology
Extrusion-based printing
Binder jetting
Selective laser sintering
Inkjet printing
Countries Analyzed
North America (US, Canada, Mexico)
Europe (Germany, UK, France, Spain, Italy, Russia, Rest of Europe)
Asia Pacific (China, India, Japan, South Korea, Australia, South East Asia, Rest of Asia)
South America (Brazil, Argentina, Rest of South America)
Middle East and Africa (Saudi Arabia, UAE, Rest of Middle East, South Africa, Egypt, Rest of Africa)
