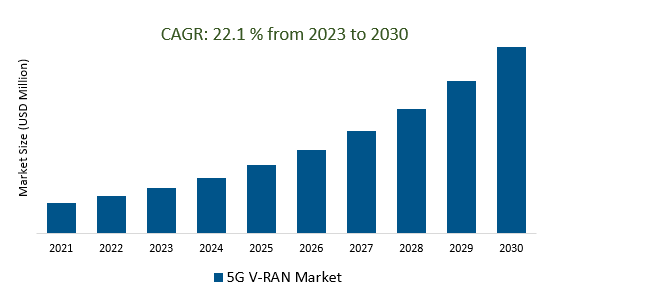
The Global 5G V-RAN Market Size is estimated to register 22.1% growth over the forecast period from 2023 to 2030.
The market growth is driven by the increasing growth of smart cities and urbanization trends are driving the need for advanced connectivity solutions, V-RAN can support the diverse requirements of smart city applications. Leading Companies focusing on 5G Network Expansion, Network Slicing, Open RAN Initiatives, Green and Sustainable Solutions, Smart Cities and IoT, and others to boost market shares in the industry.
Market Overview
The 5G Virtual Radio Access Network (V-RAN) market is experiencing significant growth as 5G networks expand globally. V-RAN, a virtualized and software-based approach, decouples hardware and software, enhancing flexibility and efficiency. Key trends include cost efficiency, network densification, network slicing, and the rise of Open RAN initiatives. Challenges include integration complexity and interoperability issues. The future outlook is positive, with V-RAN set to become increasingly crucial in various industries, supporting applications like IoT, smart cities, and edge computing as 5G networks mature and evolve.
Market Dynamics
Market Trends- The rollout of 5G networks is driving demand for virtualized RAN (V-RAN), as V-RAN offers a number of benefits for 5G networks, such as flexibility, agility, and cost-effectiveness.
The rollout of 5G networks is driving robust demand for virtualized Radio Access Network (V-RAN) solutions, owing to their capacity to significantly enhance the performance and economics of 5G infrastructure. V-RAN technology is a game-changer, providing exceptional flexibility to allocate network resources dynamically, agility to adapt to rapidly changing service demands, and cost-effectiveness through the decoupling of hardware and software components.
Market Driver- The growing demand for enhanced mobile services, such as high-speed data, low latency, and network slicing, is driving the demand for 5G V-RAN.
The 5G V-RAN market is witnessing a surge in demand, primarily attributed to the growing consumer and industrial appetite for advanced mobile services that 5G technology can provide. These services encompass high-speed data transmission, ultra-low latency, and the capability to create distinct virtual networks through network slicing. As consumer preferences for high-definition video streaming, online gaming, and emerging technologies like augmented reality and virtual reality continue to grow, 5G V-RAN's role in facilitating these services becomes increasingly indispensable.
Market Opportunity- The introduction of global connectivity and IoT is driving demand for 5G V-RAN, as V-RAN is essential for supporting the massive scale, low latency, and ultra-reliable connectivity requirements of global IoT applications
The 5G V-RAN market is experiencing a surge in demand, catalyzed by the global expansion of connectivity and the proliferation of Internet of Things (IoT) devices. V-RAN technology plays a pivotal role in meeting the intricate demands of global IoT applications. With the need for massive-scale connectivity, ultra-low latency, and utmost reliability, V-RAN provides a critical solution for delivering on these requirements.
Market Share Analysis- Distributed Unit 5G V-RAN Market will register the fastest growth
The Global 5G V-RAN Market is analyzed across Radio Units, Distributed Units, Central Units, and others. Distributed Units are poised to register the fastest growth. The Distributed Unit (DU) in the 5G V-RAN market is a critical component responsible for baseband processing, enabling virtualization and decentralization of the radio access network. Its growth aligns with the broader 5G V-RAN market, as it plays a pivotal role in delivering high-speed, low-latency 5G services and applications, ranging from enhanced mobile broadband to IoT and edge computing.
Market Share Analysis- Commercial held a significant market share in 2023
The Global 5G V-RAN Market is analyzed across various Organizations including Residential, Commercial, and others. Of these, Commercial held a significant market share in 2023. The commercial 5G V-RAN market is rapidly expanding, meeting the needs of businesses and industries seeking cost-effective, scalable, and high-performance network solutions. This technology enables high-speed data, low latency, and customized network slicing for diverse applications and services, making it a pivotal force in the evolving landscape of commercial connectivity and digital services.
5G V-RAN Market Segmentation
By Type
- Radio Unit
- Distributed Unit
- Central Unit
- Others
By Application
By Region
- North America (United States, Canada, Mexico)
- Europe (Germany, France, United Kingdom, Spain, Italy, Others)
- Asia Pacific (China, India, Japan, South Korea, Australia, Others)
- Latin America (Brazil, Argentina, Others)
- Middle East and Africa (Saudi Arabia, UAE, Kuwait, Other Middle East, South Africa, Nigeria, Other Africa)
5G V-RAN Market Companies
- Fujitsu
- Huawei Technologies
- Intel
- Juniper Networks
- Mavenir Systems
- Hewlett Packard Enterprise
- Microsemi Corporation
- NEC Corporation
- Nokia Corporation
- MTI Mobile
*List not exhaustive
5G V RAN Market Outlook 2023
1 Market Overview
1.1 Introduction to the 5G V RAN Market
1.2 Scope of the Study
1.3 Research Objective
1.3.1 Key Market Scope and Segments
1.3.2 Players Covered
1.3.3 Years Considered
2 Executive Summary
2.1 2023 5G V RAN Industry- Market Statistics
3 Market Dynamics
3.1 Market Drivers
3.2 Market Challenges
3.3 Market Opportunities
3.4 Market Trends
4 Market Factor Analysis
4.1 Porter’s Five Forces
4.2 Market Entropy
4.2.1 Global 5G V RAN Market Companies with Area Served
4.2.2 Products Offerings Global 5G V RAN Market
5 COVID-19 Impact Analysis and Outlook Scenarios
5.1.1 Covid-19 Impact Analysis
5.1.2 post-COVID-19 Scenario- Low Growth Case
5.1.3 post-COVID-19 Scenario- Reference Growth Case
5.1.4 post-COVID-19 Scenario- Low Growth Case
6 Global 5G V RAN Market Trends
6.1 Global 5G V RAN Revenue (USD Million) and CAGR (%) by Type (2018-2030)
6.2 Global 5G V RAN Revenue (USD Million) and CAGR (%) by Applications (2018-2030)
6.3 Global 5G V RAN Revenue (USD Million) and CAGR (%) by regions (2018-2030)
7 Global 5G V RAN Market Revenue (USD Million) by Type, and Applications (2018-2022)
7.1 Global 5G V RAN Revenue (USD Million) by Type (2018-2022)
7.1.1 Global 5G V RAN Revenue (USD Million), Market Share (%) by Type (2018-2022)
7.2 Global 5G V RAN Revenue (USD Million) by Applications (2018-2022)
7.2.1 Global 5G V RAN Revenue (USD Million), Market Share (%) by Applications (2018-2022)
8 Global 5G V RAN Development Regional Status and Outlook
8.1 Global 5G V RAN Revenue (USD Million) By Regions (2018-2022)
8.2 North America 5G V RAN Revenue (USD Million) by Type, and Application (2018-2022)
8.2.1 North America 5G V RAN Revenue (USD Million) by Country (2018-2022)
8.2.2 North America 5G V RAN Revenue (USD Million) by Type (2018-2022)
8.2.3 North America 5G V RAN Revenue (USD Million) by Applications (2018-2022)
8.3 Europe 5G V RAN Revenue (USD Million), by Type, and Applications (USD Million) (2018-2022)
8.3.1 Europe 5G V RAN Revenue (USD Million), by Country (2018-2022)
8.3.2 Europe 5G V RAN Revenue (USD Million) by Type (2018-2022)
8.3.3 Europe 5G V RAN Revenue (USD Million) by Applications (2018-2022)
8.4 Asia Pacific 5G V RAN Revenue (USD Million), and Revenue (USD Million) by Type, and Applications (2018-2022)
8.4.1 Asia Pacific 5G V RAN Revenue (USD Million) by Country (2018-2022)
8.4.2 Asia Pacific 5G V RAN Revenue (USD Million) by Type (2018-2022)
8.4.3 Asia Pacific 5G V RAN Revenue (USD Million) by Applications (2018-2022)
8.5 South America 5G V RAN Revenue (USD Million), by Type, and Applications (2018-2022)
8.5.1 South America 5G V RAN Revenue (USD Million), by Country (2018-2022)
8.5.2 South America 5G V RAN Revenue (USD Million) by Type (2018-2022)
8.5.3 South America 5G V RAN Revenue (USD Million) by Applications (2018-2022)
8.6 Middle East and Africa 5G V RAN Revenue (USD Million), by Type, Technology, Application, Thickness (2018-2022)
8.6.1 Middle East and Africa 5G V RAN Revenue (USD Million) by Country (2018-2022)
8.6.2 Middle East and Africa 5G V RAN Revenue (USD Million) by Type (2018-2022)
8.6.3 Middle East and Africa 5G V RAN Revenue (USD Million) by Applications (2018-2022)
9 Company Profiles
10 Global 5G V RAN Market Revenue (USD Million), by Type, and Applications (2023-2030)
10.1 Global 5G V RAN Revenue (USD Million) and Market Share (%) by Type (2023-2030)
10.1.1 Global 5G V RAN Revenue (USD Million), and Market Share (%) by Type (2023-2030)
10.2 Global 5G V RAN Revenue (USD Million) and Market Share (%) by Applications (2023-2030)
10.2.1 Global 5G V RAN Revenue (USD Million), and Market Share (%) by Applications (2023-2030)
11 Global 5G V RAN Development Regional Status and Outlook Forecast
11.1 Global 5G V RAN Revenue (USD Million) By Regions (2023-2030)
11.2 North America 5G V RAN Revenue (USD Million) by Type, and Applications (2023-2030)
11.2.1 North America 5G V RAN Revenue (USD) Million by Country (2023-2030)
11.2.2 North America 5G V RAN Revenue (USD Million), by Type (2023-2030)
11.2.3 North America 5G V RAN Revenue (USD Million), Market Share (%) by Applications (2023-2030)
11.3 Europe 5G V RAN Revenue (USD Million), by Type, and Applications (2023-2030)
11.3.1 Europe 5G V RAN Revenue (USD Million), by Country (2023-2030)
11.3.2 Europe 5G V RAN Revenue (USD Million), by Type (2023-2030)
11.3.3 Europe 5G V RAN Revenue (USD Million), by Applications (2023-2030)
11.4 Asia Pacific 5G V RAN Revenue (USD Million) by Type, and Applications (2023-2030)
11.4.1 Asia Pacific 5G V RAN Revenue (USD Million), by Country (2023-2030)
11.4.2 Asia Pacific 5G V RAN Revenue (USD Million), by Type (2023-2030)
11.4.3 Asia Pacific 5G V RAN Revenue (USD Million), by Applications (2023-2030)
11.5 South America 5G V RAN Revenue (USD Million), by Type, and Applications (2023-2030)
11.5.1 South America 5G V RAN Revenue (USD Million), by Country (2023-2030)
11.5.2 South America 5G V RAN Revenue (USD Million), by Type (2023-2030)
11.5.3 South America 5G V RAN Revenue (USD Million), by Applications (2023-2030)
11.6 Middle East and Africa 5G V RAN Revenue (USD Million), by Type, and Applications (2023-2030)
11.6.1 Middle East and Africa 5G V RAN Revenue (USD Million), by region (2023-2030)
11.6.2 Middle East and Africa 5G V RAN Revenue (USD Million), by Type (2023-2030)
11.6.3 Middle East and Africa 5G V RAN Revenue (USD Million), by Applications (2023-2030)
12 Methodology and Data Sources
12.1 Methodology/Research Approach
12.1.1 Research Programs/Design
12.1.2 Market Size Estimation
12.1.3 Market Breakdown and Data Triangulation
12.2 Data Sources
12.2.1 Secondary Sources
12.2.2 Primary Sources
12.3 Disclaimer
List of Tables
Table 1 Market Segmentation Analysis
Table 2 Global 5G V RAN Market Companies with Areas Served
Table 3 Products Offerings Global 5G V RAN Market
Table 4 Low Growth Scenario Forecasts
Table 5 Reference Case Growth Scenario
Table 6 High Growth Case Scenario
Table 7 Global 5G V RAN Revenue (USD Million) And CAGR (%) By Type (2018-2030)
Table 8 Global 5G V RAN Revenue (USD Million) And CAGR (%) By Applications (2018-2030)
Table 9 Global 5G V RAN Revenue (USD Million) And CAGR (%) By Regions (2018-2030)
Table 10 Global 5G V RAN Revenue (USD Million) By Type (2018-2022)
Table 11 Global 5G V RAN Revenue Market Share (%) By Type (2018-2022)
Table 12 Global 5G V RAN Revenue (USD Million) By Applications (2018-2022)
Table 13 Global 5G V RAN Revenue Market Share (%) By Applications (2018-2022)
Table 14 Global 5G V RAN Market Revenue (USD Million) By Regions (2018-2022)
Table 15 Global 5G V RAN Market Share (%) By Regions (2018-2022)
Table 16 North America 5G V RAN Revenue (USD Million) By Country (2018-2022)
Table 17 North America 5G V RAN Revenue (USD Million) By Type (2018-2022)
Table 18 North America 5G V RAN Revenue (USD Million) By Applications (2018-2022)
Table 19 Europe 5G V RAN Revenue (USD Million) By Country (2018-2022)
Table 20 Europe 5G V RAN Revenue (USD Million) By Type (2018-2022)
Table 21 Europe 5G V RAN Revenue (USD Million) By Applications (2018-2022)
Table 22 Asia Pacific 5G V RAN Revenue (USD Million) By Country (2018-2022)
Table 23 Asia Pacific 5G V RAN Revenue (USD Million) By Type (2018-2022)
Table 24 Asia Pacific 5G V RAN Revenue (USD Million) By Applications (2018-2022)
Table 25 South America 5G V RAN Revenue (USD Million) By Country (2018-2022)
Table 26 South America 5G V RAN Revenue (USD Million) By Type (2018-2022)
Table 27 South America 5G V RAN Revenue (USD Million) By Applications (2018-2022)
Table 28 Middle East and Africa 5G V RAN Revenue (USD Million) By Region (2018-2022)
Table 29 Middle East and Africa 5G V RAN Revenue (USD Million) By Type (2018-2022)
Table 30 Middle East and Africa 5G V RAN Revenue (USD Million) By Applications (2018-2022)
Table 31 Financial Analysis
Table 32 Global 5G V RAN Revenue (USD Million) By Type (2023-2030)
Table 33 Global 5G V RAN Revenue Market Share (%) By Type (2023-2030)
Table 34 Global 5G V RAN Revenue (USD Million) By Applications (2023-2030)
Table 35 Global 5G V RAN Revenue Market Share (%) By Applications (2023-2030)
Table 36 Global 5G V RAN Market Revenue (USD Million), And Revenue (USD Million) By Regions (2023-2030)
Table 37 North America 5G V RAN Revenue (USD)By Country (2023-2030)
Table 38 North America 5G V RAN Revenue (USD Million) By Type (2023-2030)
Table 39 North America 5G V RAN Revenue (USD Million) By Applications (2023-2030)
Table 40 Europe 5G V RAN Revenue (USD Million) By Country (2023-2030)
Table 41 Europe 5G V RAN Revenue (USD Million) By Type (2023-2030)
Table 42 Europe 5G V RAN Revenue (USD Million) By Applications (2023-2030)
Table 43 Asia Pacific 5G V RAN Revenue (USD Million) By Country (2023-2030)
Table 44 Asia Pacific 5G V RAN Revenue (USD Million) By Type (2023-2030)
Table 45 Asia Pacific 5G V RAN Revenue (USD Million) By Applications (2023-2030)
Table 46 South America 5G V RAN Revenue (USD Million) By Country (2023-2030)
Table 47 South America 5G V RAN Revenue (USD Million) By Type (2023-2030)
Table 48 South America 5G V RAN Revenue (USD Million) By Applications (2023-2030)
Table 49 Middle East and Africa 5G V RAN Revenue (USD Million) By Region (2023-2030)
Table 50 Middle East and Africa 5G V RAN Revenue (USD Million) By Region (2023-2030)
Table 51 Middle East and Africa 5G V RAN Revenue (USD Million) By Type (2023-2030)
Table 52 Middle East and Africa 5G V RAN Revenue (USD Million) By Applications (2023-2030)
Table 53 Research Programs/Design for This Report
Table 54 Key Data Information from Secondary Sources
Table 55 Key Data Information from Primary Sources
List of Figures
Figure 1 Market Scope
Figure 2 Porter’s Five Forces
Figure 3 Global 5G V RAN Revenue (USD Million) By Type (2018-2022)
Figure 4 Global 5G V RAN Revenue Market Share (%) By Type (2022)
Figure 5 Global 5G V RAN Revenue (USD Million) By Applications (2018-2022)
Figure 6 Global 5G V RAN Revenue Market Share (%) By Applications (2022)
Figure 7 Global 5G V RAN Market Revenue (USD Million) By Regions (2018-2022)
Figure 8 Global 5G V RAN Market Share (%) By Regions (2022)
Figure 9 North America 5G V RAN Revenue (USD Million) By Country (2018-2022)
Figure 10 North America 5G V RAN Revenue (USD Million) By Type (2018-2022)
Figure 11 North America 5G V RAN Revenue (USD Million) By Applications (2018-2022)
Figure 12 Europe 5G V RAN Revenue (USD Million) By Country (2018-2022)
Figure 13 Europe 5G V RAN Revenue (USD Million) By Type (2018-2022)
Figure 14 Europe 5G V RAN Revenue (USD Million) By Applications (2018-2022)
Figure 15 Asia Pacific 5G V RAN Revenue (USD Million) By Country (2018-2022)
Figure 16 Asia Pacific 5G V RAN Revenue (USD Million) By Type (2018-2022)
Figure 17 Asia Pacific 5G V RAN Revenue (USD Million) By Applications (2018-2022)
Figure 18 South America 5G V RAN Revenue (USD Million) By Country (2018-2022)
Figure 19 South America 5G V RAN Revenue (USD Million) By Type (2018-2022)
Figure 20 South America 5G V RAN Revenue (USD Million) By Applications (2018-2022)
Figure 21 Middle East and Africa 5G V RAN Revenue (USD Million) By Region (2018-2022)
Figure 22 Middle East and Africa 5G V RAN Revenue (USD Million) By Type (2018-2022)
Figure 23 Middle East and Africa 5G V RAN Revenue (USD Million) By Applications (2018-2022)
Figure 24 Global 5G V RAN Revenue (USD Million) By Type (2023-2030)
Figure 25 Global 5G V RAN Revenue Market Share (%) By Type (2030)
Figure 26 Global 5G V RAN Revenue (USD Million) By Applications (2023-2030)
Figure 27 Global 5G V RAN Revenue Market Share (%) By Applications (2030)
Figure 28 Global 5G V RAN Market Revenue (USD Million) By Regions (2023-2030)
Figure 29 North America 5G V RAN Revenue (USD Million) By Country (2023-2030)
Figure 30 North America 5G V RAN Revenue (USD Million) By Type (2023-2030)
Figure 31 North America 5G V RAN Revenue (USD Million) By Applications (2023-2030)
Figure 32 Europe 5G V RAN Revenue (USD Million) By Country (2023-2030)
Figure 33 Europe 5G V RAN Revenue (USD Million) By Type (2023-2030)
Figure 34 Europe 5G V RAN Revenue (USD Million) By Applications (2023-2030)
Figure 35 Asia Pacific 5G V RAN Revenue (USD Million) By Country (2023-2030)
Figure 36 Asia Pacific 5G V RAN Revenue (USD Million) By Type (2023-2030)
Figure 37 Asia Pacific 5G V RAN Revenue (USD Million) By Applications (2023-2030)
Figure 38 South America 5G V RAN Revenue (USD Million) By Country (2023-2030)
Figure 39 South America 5G V RAN Revenue (USD Million) By Type (2023-2030)
Figure 40 South America 5G V RAN Revenue (USD Million) By Applications (2023-2030)
Figure 41 Middle East and Africa 5G V RAN Revenue (USD Million) By Region (2023-2030)
Figure 42 Middle East and Africa 5G V RAN Revenue (USD Million) By Region (2023-2030)
Figure 43 Middle East and Africa 5G V RAN Revenue (USD Million) By Type (2023-2030)
Figure 44 Middle East and Africa 5G V RAN Revenue (USD Million) By Applications (2023-2030)
Figure 45 Bottom-Up and Top-Down Approaches for This Report
Figure 46 Data Triangulation
