
The Global Accounts Receivable Automation Market Size is estimated to register 14.9% growth over the forecast period from 2023 to 2030.
The market growth is driven by an increasing integration of data analytics and artificial intelligence (AI) into AR automation systems is on the rise. These technologies help in predictive analytics for cash flow management and optimizing collection strategies. Leading Companies focusing on Increased Adoption, Global Expansion, Integration with Emerging Technologies, Enhanced Customer Engagement, Sustainability and ESG Integration, Working Capital Optimization, Supplier Financing and Dynamic Discounting, Cybersecurity, and others to boost market shares in the industry.
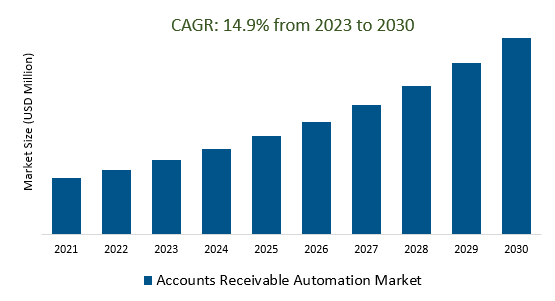
The Accounts Receivable Automation Market involves using technology to automate and optimize tasks related to managing accounts receivable, including invoice generation, payment processing, collections, and reconciliation. It's driven by the need for efficiency, cost savings, improved cash flow, and compliance with financial regulations. Challenges include integration complexity and data security concerns. The future of the market is promising, with increased digital transformation, integration of advanced technologies, and a focus on customer-centric financial solutions.
Combining accounts receivable automation software with ERP systems streamlines AR processes, heightens efficiency, cuts expenses, and guarantees data precision. This merger offers instant financial data access, a unified customer perspective, and the ability to scale for expansion. Additionally, it supports regulatory adherence and fosters a competitive edge by allowing businesses to concentrate on strategic financial choices while automating intricate tasks.
The rising demand for mobile payments and invoicing is a key driver in the Accounts Receivable Automation Market, as businesses strive to streamline AR processes and enhance customer convenience. Mobile payment options led to faster payment processing, reduced late payments, and cost savings, with the added benefits of secure transactions and alignment with sustainability goals. The integration of mobile payment methods with AR automation systems is facilitating this trend, and it reflects a broader customer-centric approach, positioning businesses to meet modern payment expectations and improve overall user experience.
Accounts receivable automation enhances working capital optimization by expediting cash flow, decreasing Days Sales Outstanding (DSO), and enabling data-informed decision-making. It also reduces bad debt risks, strengthens vendor relationships through efficient payment cycles, and employs credit assessments to mitigate risks. Additionally, it yields cost savings, supports cash flow forecasting, and fosters positive supplier connections via dynamic discounting. Furthermore, the automation aligns with sustainability and Environmental, Social, and Governance (ESG) objectives by reducing paper usage and environmental impact.
The Global Accounts Receivable Automation Market is analyzed across Software, Solutions, and others. The solution is poised to register the fastest growth. Accounts Receivable Automation solutions encompass tools and technologies designed to streamline financial processes, including automated invoice generation, payment processing, and collections management. These solutions aim to improve operational efficiency, reduce manual errors, accelerate cash flow, and enhance accounts receivable management. They often integrate with ERP systems, provide real-time financial data access, and may incorporate advanced technologies such as AI and mobile payment options. Businesses select solutions based on their specific needs, such as customer engagement, working capital optimization, and regulatory compliance.
The Global Accounts Receivable Automation Market is analyzed across various Deployment Types including On-Premises, Cloud, and others. Of these, Cloud held a significant market share in 2023. The Cloud Accounts Receivable Automation Market involves using cloud-based software to automate invoicing, payment processing, collections, and reporting. It offers scalability, real-time data access, and integration with other systems, making it a cost-effective choice for businesses of all sizes. This market reflects the broader trend of adopting cloud technology for streamlined and efficient financial operations.
By Component
By Deployment Type
By Enterprise Size
By Industry
By Region
*List not exhaustive
Accounts Receivable Automation Market Outlook 2023
1 Market Overview
1.1 Introduction to the Accounts Receivable Automation Market
1.2 Scope of the Study
1.3 Research Objective
1.3.1 Key Market Scope and Segments
1.3.2 Players Covered
1.3.3 Years Considered
2 Executive Summary
2.1 2023 Accounts Receivable Automation Industry- Market Statistics
3 Market Dynamics
3.1 Market Drivers
3.2 Market Challenges
3.3 Market Opportunities
3.4 Market Trends
4 Market Factor Analysis
4.1 Porter’s Five Forces
4.2 Market Entropy
4.2.1 Global Accounts Receivable Automation Market Companies with Area Served
4.2.2 Products Offerings Global Accounts Receivable Automation Market
5 COVID-19 Impact Analysis and Outlook Scenarios
5.1.1 Covid-19 Impact Analysis
5.1.2 post-COVID-19 Scenario- Low Growth Case
5.1.3 post-COVID-19 Scenario- Reference Growth Case
5.1.4 post-COVID-19 Scenario- Low Growth Case
6 Global Accounts Receivable Automation Market Trends
6.1 Global Accounts Receivable Automation Revenue (USD Million) and CAGR (%) by Type (2018-2030)
6.2 Global Accounts Receivable Automation Revenue (USD Million) and CAGR (%) by Applications (2018-2030)
6.3 Global Accounts Receivable Automation Revenue (USD Million) and CAGR (%) by regions (2018-2030)
7 Global Accounts Receivable Automation Market Revenue (USD Million) by Type, and Applications (2018-2022)
7.1 Global Accounts Receivable Automation Revenue (USD Million) by Type (2018-2022)
7.1.1 Global Accounts Receivable Automation Revenue (USD Million), Market Share (%) by Type (2018-2022)
7.2 Global Accounts Receivable Automation Revenue (USD Million) by Applications (2018-2022)
7.2.1 Global Accounts Receivable Automation Revenue (USD Million), Market Share (%) by Applications (2018-2022)
8 Global Accounts Receivable Automation Development Regional Status and Outlook
8.1 Global Accounts Receivable Automation Revenue (USD Million) By Regions (2018-2022)
8.2 North America Accounts Receivable Automation Revenue (USD Million) by Type, and Application (2018-2022)
8.2.1 North America Accounts Receivable Automation Revenue (USD Million) by Country (2018-2022)
8.2.2 North America Accounts Receivable Automation Revenue (USD Million) by Type (2018-2022)
8.2.3 North America Accounts Receivable Automation Revenue (USD Million) by Applications (2018-2022)
8.3 Europe Accounts Receivable Automation Revenue (USD Million), by Type, and Applications (USD Million) (2018-2022)
8.3.1 Europe Accounts Receivable Automation Revenue (USD Million), by Country (2018-2022)
8.3.2 Europe Accounts Receivable Automation Revenue (USD Million) by Type (2018-2022)
8.3.3 Europe Accounts Receivable Automation Revenue (USD Million) by Applications (2018-2022)
8.4 Asia Pacific Accounts Receivable Automation Revenue (USD Million), and Revenue (USD Million) by Type, and Applications (2018-2022)
8.4.1 Asia Pacific Accounts Receivable Automation Revenue (USD Million) by Country (2018-2022)
8.4.2 Asia Pacific Accounts Receivable Automation Revenue (USD Million) by Type (2018-2022)
8.4.3 Asia Pacific Accounts Receivable Automation Revenue (USD Million) by Applications (2018-2022)
8.5 South America Accounts Receivable Automation Revenue (USD Million), by Type, and Applications (2018-2022)
8.5.1 South America Accounts Receivable Automation Revenue (USD Million), by Country (2018-2022)
8.5.2 South America Accounts Receivable Automation Revenue (USD Million) by Type (2018-2022)
8.5.3 South America Accounts Receivable Automation Revenue (USD Million) by Applications (2018-2022)
8.6 Middle East and Africa Accounts Receivable Automation Revenue (USD Million), by Type, Technology, Application, Thickness (2018-2022)
8.6.1 Middle East and Africa Accounts Receivable Automation Revenue (USD Million) by Country (2018-2022)
8.6.2 Middle East and Africa Accounts Receivable Automation Revenue (USD Million) by Type (2018-2022)
8.6.3 Middle East and Africa Accounts Receivable Automation Revenue (USD Million) by Applications (2018-2022)
9 Company Profiles
10 Global Accounts Receivable Automation Market Revenue (USD Million), by Type, and Applications (2023-2030)
10.1 Global Accounts Receivable Automation Revenue (USD Million) and Market Share (%) by Type (2023-2030)
10.1.1 Global Accounts Receivable Automation Revenue (USD Million), and Market Share (%) by Type (2023-2030)
10.2 Global Accounts Receivable Automation Revenue (USD Million) and Market Share (%) by Applications (2023-2030)
10.2.1 Global Accounts Receivable Automation Revenue (USD Million), and Market Share (%) by Applications (2023-2030)
11 Global Accounts Receivable Automation Development Regional Status and Outlook Forecast
11.1 Global Accounts Receivable Automation Revenue (USD Million) By Regions (2023-2030)
11.2 North America Accounts Receivable Automation Revenue (USD Million) by Type, and Applications (2023-2030)
11.2.1 North America Accounts Receivable Automation Revenue (USD) Million by Country (2023-2030)
11.2.2 North America Accounts Receivable Automation Revenue (USD Million), by Type (2023-2030)
11.2.3 North America Accounts Receivable Automation Revenue (USD Million), Market Share (%) by Applications (2023-2030)
11.3 Europe Accounts Receivable Automation Revenue (USD Million), by Type, and Applications (2023-2030)
11.3.1 Europe Accounts Receivable Automation Revenue (USD Million), by Country (2023-2030)
11.3.2 Europe Accounts Receivable Automation Revenue (USD Million), by Type (2023-2030)
11.3.3 Europe Accounts Receivable Automation Revenue (USD Million), by Applications (2023-2030)
11.4 Asia Pacific Accounts Receivable Automation Revenue (USD Million) by Type, and Applications (2023-2030)
11.4.1 Asia Pacific Accounts Receivable Automation Revenue (USD Million), by Country (2023-2030)
11.4.2 Asia Pacific Accounts Receivable Automation Revenue (USD Million), by Type (2023-2030)
11.4.3 Asia Pacific Accounts Receivable Automation Revenue (USD Million), by Applications (2023-2030)
11.5 South America Accounts Receivable Automation Revenue (USD Million), by Type, and Applications (2023-2030)
11.5.1 South America Accounts Receivable Automation Revenue (USD Million), by Country (2023-2030)
11.5.2 South America Accounts Receivable Automation Revenue (USD Million), by Type (2023-2030)
11.5.3 South America Accounts Receivable Automation Revenue (USD Million), by Applications (2023-2030)
11.6 Middle East and Africa Accounts Receivable Automation Revenue (USD Million), by Type, and Applications (2023-2030)
11.6.1 Middle East and Africa Accounts Receivable Automation Revenue (USD Million), by region (2023-2030)
11.6.2 Middle East and Africa Accounts Receivable Automation Revenue (USD Million), by Type (2023-2030)
11.6.3 Middle East and Africa Accounts Receivable Automation Revenue (USD Million), by Applications (2023-2030)
12 Methodology and Data Sources
12.1 Methodology/Research Approach
12.1.1 Research Programs/Design
12.1.2 Market Size Estimation
12.1.3 Market Breakdown and Data Triangulation
12.2 Data Sources
12.2.1 Secondary Sources
12.2.2 Primary Sources
12.3 Disclaimer
List of Tables
Table 1 Market Segmentation Analysis
Table 2 Global Accounts Receivable Automation Market Companies with Areas Served
Table 3 Products Offerings Global Accounts Receivable Automation Market
Table 4 Low Growth Scenario Forecasts
Table 5 Reference Case Growth Scenario
Table 6 High Growth Case Scenario
Table 7 Global Accounts Receivable Automation Revenue (USD Million) And CAGR (%) By Type (2018-2030)
Table 8 Global Accounts Receivable Automation Revenue (USD Million) And CAGR (%) By Applications (2018-2030)
Table 9 Global Accounts Receivable Automation Revenue (USD Million) And CAGR (%) By Regions (2018-2030)
Table 10 Global Accounts Receivable Automation Revenue (USD Million) By Type (2018-2022)
Table 11 Global Accounts Receivable Automation Revenue Market Share (%) By Type (2018-2022)
Table 12 Global Accounts Receivable Automation Revenue (USD Million) By Applications (2018-2022)
Table 13 Global Accounts Receivable Automation Revenue Market Share (%) By Applications (2018-2022)
Table 14 Global Accounts Receivable Automation Market Revenue (USD Million) By Regions (2018-2022)
Table 15 Global Accounts Receivable Automation Market Share (%) By Regions (2018-2022)
Table 16 North America Accounts Receivable Automation Revenue (USD Million) By Country (2018-2022)
Table 17 North America Accounts Receivable Automation Revenue (USD Million) By Type (2018-2022)
Table 18 North America Accounts Receivable Automation Revenue (USD Million) By Applications (2018-2022)
Table 19 Europe Accounts Receivable Automation Revenue (USD Million) By Country (2018-2022)
Table 20 Europe Accounts Receivable Automation Revenue (USD Million) By Type (2018-2022)
Table 21 Europe Accounts Receivable Automation Revenue (USD Million) By Applications (2018-2022)
Table 22 Asia Pacific Accounts Receivable Automation Revenue (USD Million) By Country (2018-2022)
Table 23 Asia Pacific Accounts Receivable Automation Revenue (USD Million) By Type (2018-2022)
Table 24 Asia Pacific Accounts Receivable Automation Revenue (USD Million) By Applications (2018-2022)
Table 25 South America Accounts Receivable Automation Revenue (USD Million) By Country (2018-2022)
Table 26 South America Accounts Receivable Automation Revenue (USD Million) By Type (2018-2022)
Table 27 South America Accounts Receivable Automation Revenue (USD Million) By Applications (2018-2022)
Table 28 Middle East and Africa Accounts Receivable Automation Revenue (USD Million) By Region (2018-2022)
Table 29 Middle East and Africa Accounts Receivable Automation Revenue (USD Million) By Type (2018-2022)
Table 30 Middle East and Africa Accounts Receivable Automation Revenue (USD Million) By Applications (2018-2022)
Table 31 Financial Analysis
Table 32 Global Accounts Receivable Automation Revenue (USD Million) By Type (2023-2030)
Table 33 Global Accounts Receivable Automation Revenue Market Share (%) By Type (2023-2030)
Table 34 Global Accounts Receivable Automation Revenue (USD Million) By Applications (2023-2030)
Table 35 Global Accounts Receivable Automation Revenue Market Share (%) By Applications (2023-2030)
Table 36 Global Accounts Receivable Automation Market Revenue (USD Million), And Revenue (USD Million) By Regions (2023-2030)
Table 37 North America Accounts Receivable Automation Revenue (USD)By Country (2023-2030)
Table 38 North America Accounts Receivable Automation Revenue (USD Million) By Type (2023-2030)
Table 39 North America Accounts Receivable Automation Revenue (USD Million) By Applications (2023-2030)
Table 40 Europe Accounts Receivable Automation Revenue (USD Million) By Country (2023-2030)
Table 41 Europe Accounts Receivable Automation Revenue (USD Million) By Type (2023-2030)
Table 42 Europe Accounts Receivable Automation Revenue (USD Million) By Applications (2023-2030)
Table 43 Asia Pacific Accounts Receivable Automation Revenue (USD Million) By Country (2023-2030)
Table 44 Asia Pacific Accounts Receivable Automation Revenue (USD Million) By Type (2023-2030)
Table 45 Asia Pacific Accounts Receivable Automation Revenue (USD Million) By Applications (2023-2030)
Table 46 South America Accounts Receivable Automation Revenue (USD Million) By Country (2023-2030)
Table 47 South America Accounts Receivable Automation Revenue (USD Million) By Type (2023-2030)
Table 48 South America Accounts Receivable Automation Revenue (USD Million) By Applications (2023-2030)
Table 49 Middle East and Africa Accounts Receivable Automation Revenue (USD Million) By Region (2023-2030)
Table 50 Middle East and Africa Accounts Receivable Automation Revenue (USD Million) By Region (2023-2030)
Table 51 Middle East and Africa Accounts Receivable Automation Revenue (USD Million) By Type (2023-2030)
Table 52 Middle East and Africa Accounts Receivable Automation Revenue (USD Million) By Applications (2023-2030)
Table 53 Research Programs/Design for This Report
Table 54 Key Data Information from Secondary Sources
Table 55 Key Data Information from Primary Sources
List of Figures
Figure 1 Market Scope
Figure 2 Porter’s Five Forces
Figure 3 Global Accounts Receivable Automation Revenue (USD Million) By Type (2018-2022)
Figure 4 Global Accounts Receivable Automation Revenue Market Share (%) By Type (2022)
Figure 5 Global Accounts Receivable Automation Revenue (USD Million) By Applications (2018-2022)
Figure 6 Global Accounts Receivable Automation Revenue Market Share (%) By Applications (2022)
Figure 7 Global Accounts Receivable Automation Market Revenue (USD Million) By Regions (2018-2022)
Figure 8 Global Accounts Receivable Automation Market Share (%) By Regions (2022)
Figure 9 North America Accounts Receivable Automation Revenue (USD Million) By Country (2018-2022)
Figure 10 North America Accounts Receivable Automation Revenue (USD Million) By Type (2018-2022)
Figure 11 North America Accounts Receivable Automation Revenue (USD Million) By Applications (2018-2022)
Figure 12 Europe Accounts Receivable Automation Revenue (USD Million) By Country (2018-2022)
Figure 13 Europe Accounts Receivable Automation Revenue (USD Million) By Type (2018-2022)
Figure 14 Europe Accounts Receivable Automation Revenue (USD Million) By Applications (2018-2022)
Figure 15 Asia Pacific Accounts Receivable Automation Revenue (USD Million) By Country (2018-2022)
Figure 16 Asia Pacific Accounts Receivable Automation Revenue (USD Million) By Type (2018-2022)
Figure 17 Asia Pacific Accounts Receivable Automation Revenue (USD Million) By Applications (2018-2022)
Figure 18 South America Accounts Receivable Automation Revenue (USD Million) By Country (2018-2022)
Figure 19 South America Accounts Receivable Automation Revenue (USD Million) By Type (2018-2022)
Figure 20 South America Accounts Receivable Automation Revenue (USD Million) By Applications (2018-2022)
Figure 21 Middle East and Africa Accounts Receivable Automation Revenue (USD Million) By Region (2018-2022)
Figure 22 Middle East and Africa Accounts Receivable Automation Revenue (USD Million) By Type (2018-2022)
Figure 23 Middle East and Africa Accounts Receivable Automation Revenue (USD Million) By Applications (2018-2022)
Figure 24 Global Accounts Receivable Automation Revenue (USD Million) By Type (2023-2030)
Figure 25 Global Accounts Receivable Automation Revenue Market Share (%) By Type (2030)
Figure 26 Global Accounts Receivable Automation Revenue (USD Million) By Applications (2023-2030)
Figure 27 Global Accounts Receivable Automation Revenue Market Share (%) By Applications (2030)
Figure 28 Global Accounts Receivable Automation Market Revenue (USD Million) By Regions (2023-2030)
Figure 29 North America Accounts Receivable Automation Revenue (USD Million) By Country (2023-2030)
Figure 30 North America Accounts Receivable Automation Revenue (USD Million) By Type (2023-2030)
Figure 31 North America Accounts Receivable Automation Revenue (USD Million) By Applications (2023-2030)
Figure 32 Europe Accounts Receivable Automation Revenue (USD Million) By Country (2023-2030)
Figure 33 Europe Accounts Receivable Automation Revenue (USD Million) By Type (2023-2030)
Figure 34 Europe Accounts Receivable Automation Revenue (USD Million) By Applications (2023-2030)
Figure 35 Asia Pacific Accounts Receivable Automation Revenue (USD Million) By Country (2023-2030)
Figure 36 Asia Pacific Accounts Receivable Automation Revenue (USD Million) By Type (2023-2030)
Figure 37 Asia Pacific Accounts Receivable Automation Revenue (USD Million) By Applications (2023-2030)
Figure 38 South America Accounts Receivable Automation Revenue (USD Million) By Country (2023-2030)
Figure 39 South America Accounts Receivable Automation Revenue (USD Million) By Type (2023-2030)
Figure 40 South America Accounts Receivable Automation Revenue (USD Million) By Applications (2023-2030)
Figure 41 Middle East and Africa Accounts Receivable Automation Revenue (USD Million) By Region (2023-2030)
Figure 42 Middle East and Africa Accounts Receivable Automation Revenue (USD Million) By Region (2023-2030)
Figure 43 Middle East and Africa Accounts Receivable Automation Revenue (USD Million) By Type (2023-2030)
Figure 44 Middle East and Africa Accounts Receivable Automation Revenue (USD Million) By Applications (2023-2030)
Figure 45 Bottom-Up and Top-Down Approaches for This Report
Figure 46 Data Triangulation
By Component
By Deployment Type
By Enterprise Size
By Industry
By Region