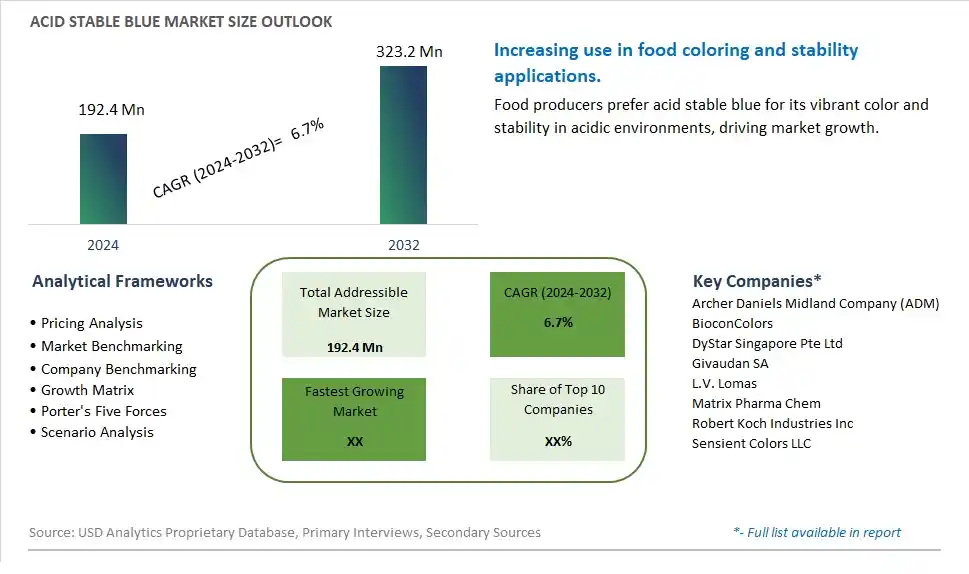
Global Acid Stable Blue Market Size is valued at $192.4 Million in 2024 and is forecast to register a growth rate (CAGR) of 6.7% to reach $323.2 Million by 2032.
The global Acid Stable Blue Market Comprehensive Study analyzes and forecasts the market size across 6 regions and 24 countries for diverse segments -By Type (Organic, Conventional), By Form (Powder, Emulsion, Liquid), By Solubility (Water Soluble, Oil Soluble), By Application (Confectionery, Beverages, Bakery, Dairy Product, Others)
An Introduction to Acid Stable Blue Market
The Acid Stable Blue market in 2024 is growing steadily, fueled by its essential applications in the food and beverage industry, particularly in products requiring stable and vibrant blue coloring under acidic conditions. Innovations in food colorant technologies and increasing consumer demand for visually appealing and safe food products are driving market growth. Regulatory approvals and a shift towards natural and synthetic colorant blends are further enhancing the market’s scope. Additionally, the expanding processed food sector in emerging markets is creating new opportunities for acid stable blue colorants, bolstering its global market presence.
Acid Stable Blue Competitive Landscape
The market report analyses the leading companies in the industry including Archer Daniels Midland Company (ADM), BioconColors, DyStar Singapore Pte Ltd, Givaudan SA, L.V. Lomas, Matrix Pharma Chem, Robert Koch Industries Inc, Sensient Colors LLC, and Others.
Acid Stable Blue Market Dynamics
Acid Stable Blue Market Trend: Increasing Use of Natural Colorants
The market for Acid Stable Blue is witnessing a significant trend towards the increasing use of natural colorants in various industries, particularly in food and beverages, pharmaceuticals, and cosmetics. Consumers are becoming more health-conscious and are demanding natural and clean-label products, leading to a shift away from synthetic colorants. Acid Stable Blue, being a natural pigment, is gaining popularity due to its stability in acidic environments and its ability to maintain vibrant color under various processing conditions. This trend is further supported by regulatory bodies favoring natural over synthetic additives, enhancing the appeal and adoption of Acid Stable Blue across multiple applications.
Acid Stable Blue Market Driver: Rising Demand for Color Stability in Acidic Products
The primary driver for the Acid Stable Blue market is the rising demand for color stability in acidic products. Industries such as food and beverages require colorants that can withstand acidic conditions without degrading, as many products, including fruit-flavored beverages, yogurts, and pickles, have low pH levels. Acid Stable Blue offers superior stability and consistency, ensuring that the color remains vibrant and appealing throughout the product's shelf life. This characteristic is particularly crucial for maintaining the visual appeal and perceived quality of the product, driving manufacturers to increasingly adopt Acid Stable Blue in their formulations.
Acid Stable Blue Market Opportunity: Expansion into Emerging Markets
A significant opportunity for the Acid Stable Blue market lies in the expansion into emerging markets. Regions such as Asia-Pacific, Latin America, and Africa are experiencing rapid economic growth, urbanization, and changes in consumer lifestyles. As these regions develop, there is an increasing demand for processed and packaged foods, beverages, and cosmetic products that require stable and attractive colorants. By entering these emerging markets, manufacturers of Acid Stable Blue can tap into the growing consumer base and cater to the rising demand for high-quality, naturally colored products. Strategic partnerships with local producers and investment in marketing and distribution networks can further enhance market penetration and growth in these regions.
Acid Stable Blue Market Share Analysis: Conventional segment generated the highest revenue share in the industry
The Conventional segment is the largest in the Acid Stable Blue Market by type. This segment's prominence is primarily due to its widespread use and established presence in various industries, including food and beverages, textiles, and cosmetics. Conventional acid stable blue dyes are favored for their costeffectiveness and reliable performance in providing vibrant, stable colors in acidic conditions. They are extensively used in applications where consistency and stability are crucial, such as in soft drinks, candies, and certain cosmetic products. The longstanding use of conventional dyes has also led to wellestablished supply chains and manufacturing processes, further reinforcing their dominant market position. While there is growing interest in organic alternatives, the conventional segment continues to lead due to its broad applicability, economic advantages, and proven efficacy in diverse industrial applications.
Acid Stable Blue Market Share Analysis: Liquid segment generated the highest revenue share in the industry
The Liquid segment within the Acid Stable Blue Market is projected to be the fastest growing segment by 2032. This rapid growth is driven by the increasing demand for convenience and ease of use in various industrial applications. Liquid forms of acid stable blue dyes are preferred in industries such as food and beverages, pharmaceuticals, and cosmetics due to their easy mixability, precise dosing, and uniform distribution. The liquid form eliminates the need for dissolving powders, thus reducing preparation time and minimizing handling issues. Additionally, advancements in liquid dye formulations have improved their stability and shelf life, making them more attractive to manufacturers. The growing trend towards automated production processes in these industries also favors the use of liquid dyes, which can be easily integrated into automated systems for consistent and efficient color application. As industries continue to seek more efficient and userfriendly solutions, the liquid segment is expected to see substantial growth through 2032.
Acid Stable Blue Market Share Analysis: Water Soluble is the fastest growing segment over the forecast period to 2032
The Water Soluble segment is the largest in the Acid Stable Blue Market by solubility. This segment's dominance is due to the widespread application and versatility of watersoluble dyes in various industries, including food and beverages, pharmaceuticals, textiles, and cosmetics. Watersoluble acid stable blue dyes are preferred for their ease of use, excellent solubility in aqueous solutions, and ability to produce vibrant and consistent colors. They are extensively used in products like beverages, confectioneries, and personal care items, where waterbased formulations are common. Additionally, the compatibility of watersoluble dyes with a wide range of formulations and their costeffectiveness further contribute to their leading market position. The wellestablished supply chains and manufacturing processes for watersoluble dyes also support their continued dominance in the market. As industries increasingly prioritize environmentally friendly and efficient coloring solutions, the watersoluble segment is expected to maintain its leadership position.
Acid Stable Blue Market Share Analysis: Beverages segment generated the highest revenue share in the industry
The Beverages segment within the Acid Stable Blue Market is projected to be the fastest growing segment by 2032. This growth is driven by the rising consumer demand for visually appealing and diverse beverage options. Acid stable blue dyes are increasingly used in a variety of beverages, including soft drinks, energy drinks, sports drinks, and flavored waters, to provide vibrant and stable colors that enhance product attractiveness and brand differentiation. The trend towards innovative and eyecatching product presentations in the beverage industry is propelling the use of bright and stable colorants like acid stable blue. Additionally, the expansion of the global beverage market, particularly in emerging economies where consumer spending on nonalcoholic drinks is increasing, further supports this growth. As companies continue to develop new beverage products and flavors, the need for stable and appealing color solutions will drive the demand for acid stable blue dyes, making the beverages segment the fastest growing application area through 2032.
Acid Stable Blue Market Segmentation
By Type
Organic
Conventional
By Form
Powder
Emulsion
Liquid
By Solubility
Water Soluble
Oil Soluble
By Application
Confectionery
Beverages
Bakery
Dairy Product
Others
Countries Analyzed
North America (US, Canada, Mexico)
Europe (Germany, UK, France, Spain, Italy, Russia, Rest of Europe)
Asia Pacific (China, India, Japan, South Korea, Australia, South East Asia, Rest of Asia)
South America (Brazil, Argentina, Rest of South America)
Middle East and Africa (Saudi Arabia, UAE, Rest of Middle East, South Africa, Egypt, Rest of Africa)
Acid Stable Blue Companies Profiled in the Study
Archer Daniels Midland Company (ADM)
BioconColors
DyStar Singapore Pte Ltd
Givaudan SA
L.V. Lomas
Matrix Pharma Chem
Robert Koch Industries Inc
Sensient Colors LLC
*- List Not Exhaustive
Chapter 1. TABLE OF CONTENTS
Chapter 2. Introduction to Acid Stable Blue Market
2.1. Market Overview
2.2. Key Statistics and Report Highlights
2.3. Scope of the Comprehensive Study
2.3.1. Market Definition
2.3.2 Countries and Regions Covered
2.3.3 Research Objective
2.3.4 Units, Currency, and Conversions
2.3.5 Industry Value Chain
2.4. Key Market Segments
2.5. Key Companies
2.6. Study Period
Chapter 3. Strategic Analysis Review
3.1. Acid Stable Blue Pricing Analysis and Forecast
3.2. Porter’s Five Forces
3.3. Market Ecosystem
3.4. SWOT Analysis
3.5. Regulatory Scenario
3.3. Effects of Inflation, Russia-Ukraine War, moderating economic growth, and other macroeconomic factors
Chapter 4. Competitive Landscape
4.1. Market Share Analysis
4.1.1. Global Acid Stable Blue Market Share by Company, 2023
4.1.2. Product Offerings of Leading Acid Stable Blue Companies
4.2. Market Entropy
4.2.1. New Product Launches in the Industry
4.2.2. Mergers, Acquisitions, Joint ventures, and Partnerships
4.3. Key Strategies and Best Practices
Chapter 5. Global Market Projections: Best, Reference, and Low Case Scenarios
5.1. Growth Analysis- Case Scenario Definitions
5.2. Low Growth Case Scenario Forecasts
5.3. Reference Growth Case Scenario Forecasts
5.4. High Growth Case Scenario Forecasts
Chapter 6. Market Dynamics
6.1. Acid Stable Blue Market Drivers
6.2. Acid Stable Blue Market Challenges
6.6. Acid Stable Blue Market Opportunities
6.4. Acid Stable Blue Market Trends
Chapter 7. Global Acid Stable Blue Market Outlook Trends
7.1. Global Acid Stable Blue Revenue (USD Million) and CAGR (%) by Type (2021-2032)
7.2. Global Acid Stable Blue Revenue (USD Million) and CAGR (%) by Application (2021-2032)
7.3. Global Acid Stable Blue Revenue (USD Million) and CAGR (%) by Product (2021-2032)
By Type
Organic
Conventional
By Form
Powder
Emulsion
Liquid
By Solubility
Water Soluble
Oil Soluble
By Application
Confectionery
Beverages
Bakery
Dairy Product
Others
Chapter 8. Global Acid Stable Blue Regional Analysis and Outlook
8.1. Global Acid Stable Blue Revenue (USD Million) By Regions (2021- 2032)
8.2. North America Acid Stable Blue Revenue (USD Million) by Country (2021-2032)
8.2.1. United States Acid Stable Blue Regional Analysis and Outlook
8.2.2. Canada Acid Stable Blue Regional Analysis and Outlook
8.2.3. Mexico Acid Stable Blue Regional Analysis and Outlook
8.3. Europe Acid Stable Blue Revenue (USD Million), by Country (2021-2032)
8.3.1. Germany Acid Stable Blue Regional Analysis and Outlook
8.3.2. France Acid Stable Blue Regional Analysis and Outlook
8.3.3. United Kingdom Acid Stable Blue Regional Analysis and Outlook
8.3.4. Spain Acid Stable Blue Regional Analysis and Outlook
8.3.5. Italy Acid Stable Blue Regional Analysis and Outlook
8.3.6. Russia Acid Stable Blue Regional Analysis and Outlook
8.3.7. Rest of Europe Acid Stable Blue Regional Analysis and Outlook
8.4. Asia Pacific Acid Stable Blue Revenue (USD Million) by Country (2021-2032)
8.4.1. China Acid Stable Blue Regional Analysis and Outlook
8.4.2. Japan Acid Stable Blue Regional Analysis and Outlook
8.4.3. India Acid Stable Blue Regional Analysis and Outlook
8.4.4. South Korea Acid Stable Blue Regional Analysis and Outlook
8.4.5. Australia Acid Stable Blue Regional Analysis and Outlook
8.4.6. South East Asia Acid Stable Blue Regional Analysis and Outlook
8.4.7. Rest of Asia Pacific Acid Stable Blue Regional Analysis and Outlook
8.5. South America Acid Stable Blue Revenue (USD Million), by Country (2021-2032)
8.5.1. Brazil Acid Stable Blue Regional Analysis and Outlook
8.5.2. Argentina Acid Stable Blue Regional Analysis and Outlook
8.5.3. Rest of South America Acid Stable Blue Regional Analysis and Outlook
8.6. Middle East and Africa Acid Stable Blue Revenue (USD Million) by Country (2021-2032)
8.6.1. Middle East Acid Stable Blue Regional Analysis and Outlook
8.6.2. Africa Acid Stable Blue Regional Analysis and Outlook
Chapter 9. North America Acid Stable Blue Analysis and Outlook
9.1. North America Acid Stable Blue Revenue (USD Million) by Segments (2021-2032)
9.1.1. North America Acid Stable Blue Revenue (USD Million) by Type (2021-2032)
9.1.2. North America Acid Stable Blue Revenue (USD Million) by Application (2021-2032)
9.1.3. North America Acid Stable Blue Revenue (USD Million) by Product (2021-2032)
By Type
Organic
Conventional
By Form
Powder
Emulsion
Liquid
By Solubility
Water Soluble
Oil Soluble
By Application
Confectionery
Beverages
Bakery
Dairy Product
Others
Chapter 10. Europe Acid Stable Blue Analysis and Outlook
10.1. Europe Acid Stable Blue Revenue (USD Million), by Segments (USD Million) (2021-2032)
10.1.1. Europe Acid Stable Blue Revenue (USD Million) by Type (2021-2032)
10.1.2. Europe Acid Stable Blue Revenue (USD Million) by Application (2021-2032)
10.1.3. Europe Acid Stable Blue Revenue (USD Million) by Product (2021-2032)
By Type
Organic
Conventional
By Form
Powder
Emulsion
Liquid
By Solubility
Water Soluble
Oil Soluble
By Application
Confectionery
Beverages
Bakery
Dairy Product
Others
Chapter 11. Asia Pacific Acid Stable Blue Analysis and Outlook
11.1. Asia Pacific Acid Stable Blue Revenue (USD Million), and Revenue (USD Million) by Segments (2021-2032)
11.1.1. Asia Pacific Acid Stable Blue Revenue (USD Million) by Type (2021-2032)
11.1.2. Asia Pacific Acid Stable Blue Revenue (USD Million) by Application (2021-2032)
11.1.3. Asia Pacific Acid Stable Blue Revenue (USD Million) by Product (2021-2032)
By Type
Organic
Conventional
By Form
Powder
Emulsion
Liquid
By Solubility
Water Soluble
Oil Soluble
By Application
Confectionery
Beverages
Bakery
Dairy Product
Others
Chapter 12. South America Acid Stable Blue Analysis and Outlook
12.1. South America Acid Stable Blue Revenue (USD Million), by Segments (2021-2032)
12.1.1. South America Acid Stable Blue Revenue (USD Million) by Type (2021-2032)
12.1.2. South America Acid Stable Blue Revenue (USD Million) by Application (2021-2032)
12.1.3. South America Acid Stable Blue Revenue (USD Million) by Product (2021-2032)
By Type
Organic
Conventional
By Form
Powder
Emulsion
Liquid
By Solubility
Water Soluble
Oil Soluble
By Application
Confectionery
Beverages
Bakery
Dairy Product
Others
Chapter 13. Middle East and Africa Acid Stable Blue Analysis and Outlook
13.1. Middle East and Africa Acid Stable Blue Revenue (USD Million), by Segments (2021-2032)
13.1.1. Middle East and Africa Acid Stable Blue Revenue (USD Million) by Type (2021-2032)
13.1.2. Middle East and Africa Acid Stable Blue Revenue (USD Million) by Application (2021-2032)
13.1.3. Middle East and Africa Acid Stable Blue Revenue (USD Million) by Product (2021-2032)
By Type
Organic
Conventional
By Form
Powder
Emulsion
Liquid
By Solubility
Water Soluble
Oil Soluble
By Application
Confectionery
Beverages
Bakery
Dairy Product
Others
Chapter 14. Acid Stable Blue Company Profiles
14.1 Business Overview
14.2 Product Profiles
14.3 SWOT Profiles
14.5 Recent Developments
14.6 Financial Profile
List of Companies
Archer Daniels Midland Company (ADM)
BioconColors
DyStar Singapore Pte Ltd
Givaudan SA
L.V. Lomas
Matrix Pharma Chem
Robert Koch Industries Inc
Sensient Colors LLC
15. Methodology and Data Sources
15.1 Customization Offerings
15.2 Subscription Services
15.3 Related Reports
15.4 Publisher Expertise
LIST OF TABLES
Table 1 Market Segmentation Analysis
Table 2 Global Acid Stable Blue Market Share of Leading Companies, 2023
Table 3 Product Offerings of Leading Companies
Table 4 Low Growth Scenario Forecasts
Table 5 Reference Case Growth Scenario
Table 6 High Growth Case Scenario
Table 7 Global Acid Stable Blue Revenue (USD Million) And CAGR (%) By Type (2021-2032)
Table 8 Global Acid Stable Blue Revenue (USD Million) And CAGR (%) By Application (2021-2032)
Table 9 Global Acid Stable Blue Revenue (USD Million) And CAGR (%) By Product (2021-2032)
Table 10 Global Acid Stable Blue Market Revenue (USD Million) By Regions (2021-2032)
Table 11 Global Acid Stable Blue Market Share (%) By Regions (2021-2032)
Table 12 North America Acid Stable Blue Revenue (USD Million) By Country (2021-2032)
Table 13 Europe Acid Stable Blue Revenue (USD Million) By Country (2021-2032)
Table 14 Asia Pacific Acid Stable Blue Revenue (USD Million) By Country (2021-2032)
Table 15 South America Acid Stable Blue Revenue (USD Million) By Country (2021-2032)
Table 16 Middle East and Africa Acid Stable Blue Revenue (USD Million) By Region (2021-2032)
Table 17 North America Acid Stable Blue Revenue (USD Million) By Type (2021-2032)
Table 18 North America Acid Stable Blue Revenue (USD Million) By Application (2021-2032)
Table 19 North America Acid Stable Blue Revenue (USD Million) By Product (2021-2032)
Table 20 Europe Acid Stable Blue Revenue (USD Million) By Type (2021-2032)
Table 21 Europe Acid Stable Blue Revenue (USD Million) By Application (2021-2032)
Table 22 Europe Acid Stable Blue Revenue (USD Million) By Product (2021-2032)
Table 23 Asia Pacific Acid Stable Blue Revenue (USD Million) By Type (2021-2032)
Table 24 Asia Pacific Acid Stable Blue Revenue (USD Million) By Application (2021-2032)
Table 25 Asia Pacific Acid Stable Blue Revenue (USD Million) By Product (2021-2032)
Table 26 South America Acid Stable Blue Revenue (USD Million) By Type (2021-2032)
Table 27 South America Acid Stable Blue Revenue (USD Million) By Application (2021-2032)
Table 28 South America Acid Stable Blue Revenue (USD Million) By Product (2021-2032)
Table 29 Middle East and Africa Acid Stable Blue Revenue (USD Million) By Type (2021-2032)
Table 30 Middle East and Africa Acid Stable Blue Revenue (USD Million) By Application (2021-2032)
Table 31 Middle East and Africa Acid Stable Blue Revenue (USD Million) By Product (2021-2032)
LIST OF FIGURES
Figure 1. Market Scope
Figure 2. Pricing Forecasts Per Unit, 2023- 2032
Figure 3. Porter’s Five Forces
Figure 4. Global Acid Stable Blue Market Revenue (USD Million) By Regions (2021-2032)
Figure 5. Global Acid Stable Blue Market Share (%) By Regions (2023)
Figure 6. North America Acid Stable Blue Revenue (USD Million) By Country (2021-2032)
Figure 7. United States Acid Stable Blue Revenue (USD Million) By Country (2021-2032)
Figure 8. Canada Acid Stable Blue Revenue (USD Million) By Country (2021-2032)
Figure 9. Mexico Acid Stable Blue Revenue (USD Million) By Country (2021-2032)
Figure 10. Europe Acid Stable Blue Revenue (USD Million) By Country (2021-2032)
Figure 11. Germany Acid Stable Blue Revenue (USD Million) By Country (2021-2032)
Figure 12. France Acid Stable Blue Revenue (USD Million) By Country (2021-2032)
Figure 13. United Kingdom Acid Stable Blue Revenue (USD Million) By Country (2021-2032)
Figure 14. Spain Acid Stable Blue Revenue (USD Million) By Country (2021-2032)
Figure 15. Italy Acid Stable Blue Revenue (USD Million) By Country (2021-2032)
Figure 16. Russia Acid Stable Blue Revenue (USD Million) By Country (2021-2032)
Figure 17. Rest of Europe Acid Stable Blue Revenue (USD Million) By Country (2021-2032)
Figure 11. Asia Pacific Acid Stable Blue Revenue (USD Million) By Country (2021-2032)
Figure 12. China Acid Stable Blue Revenue (USD Million) By Country (2021-2032)
Figure 13. Japan Acid Stable Blue Revenue (USD Million) By Country (2021-2032)
Figure 14. India Acid Stable Blue Revenue (USD Million) By Country (2021-2032)
Figure 15. South Korea Acid Stable Blue Revenue (USD Million) By Country (2021-2032)
Figure 16. Australia Acid Stable Blue Revenue (USD Million) By Country (2021-2032)
Figure 17. South East Asia Acid Stable Blue Revenue (USD Million) By Country (2021-2032)
Figure 18. South America Acid Stable Blue Revenue (USD Million) By Country (2021-2032)
Figure 19. Brazil Acid Stable Blue Revenue (USD Million) By Country (2021-2032)
Figure 20. Argentina Acid Stable Blue Revenue (USD Million) By Country (2021-2032)
Figure 21. Rest of Asia Pacific Acid Stable Blue Revenue (USD Million) By Country (2021-2032)
Figure 22. Middle East and Africa Acid Stable Blue Revenue (USD Million) By Region (2021-2032)
Figure 23. Saudi Arabia Acid Stable Blue Revenue (USD Million) By Region (2021-2032)
Figure 24. The UAE Acid Stable Blue Revenue (USD Million) By Region (2021-2032)
Figure 25. Rest of Middle East Acid Stable Blue Revenue (USD Million) By Region (2021-2032)
Figure 26. South Africa Acid Stable Blue Revenue (USD Million) By Region (2021-2032)
Figure 27. Africa Acid Stable Blue Revenue (USD Million) By Region (2021-2032)
Figure 28. North America Acid Stable Blue Revenue (USD Million) By Type (2021-2032)
Figure 29. North America Acid Stable Blue Revenue (USD Million) By Application (2021-2032)
Figure 30. North America Acid Stable Blue Revenue (USD Million) By Product (2021-2032)
Figure 31. Europe Acid Stable Blue Revenue (USD Million) By Type (2021-2032)
Figure 32. Europe Acid Stable Blue Revenue (USD Million) By Application (2021-2032)
Figure 33. Europe Acid Stable Blue Revenue (USD Million) By Product (2021-2032)
Figure 34. Asia Pacific Acid Stable Blue Revenue (USD Million) By Type (2021-2032)
Figure 35. Asia Pacific Acid Stable Blue Revenue (USD Million) By Application (2021-2032)
Figure 36. Asia Pacific Acid Stable Blue Revenue (USD Million) By Product (2021-2032)
Figure 37. South America Acid Stable Blue Revenue (USD Million) By Type (2021-2032)
Figure 38. South America Acid Stable Blue Revenue (USD Million) By Application (2021-2032)
Figure 39. South America Acid Stable Blue Revenue (USD Million) By Product (2021-2032)
Figure 40. Middle East and Africa Acid Stable Blue Revenue (USD Million) By Type (2021-2032)
Figure 41. Middle East and Africa Acid Stable Blue Revenue (USD Million) By Application (2021-2032)
Figure 42. Middle East and Africa Acid Stable Blue Revenue (USD Million) By Product (2021-2032)
By Type
Organic
Conventional
By Form
Powder
Emulsion
Liquid
By Solubility
Water Soluble
Oil Soluble
By Application
Confectionery
Beverages
Bakery
Dairy Product
Others
Countries Analyzed
North America (US, Canada, Mexico)
Europe (Germany, UK, France, Spain, Italy, Russia, Rest of Europe)
Asia Pacific (China, India, Japan, South Korea, Australia, South East Asia, Rest of Asia)
South America (Brazil, Argentina, Rest of South America)
Middle East and Africa (Saudi Arabia, UAE, Rest of Middle East, South Africa, Egypt, Rest of Africa)
