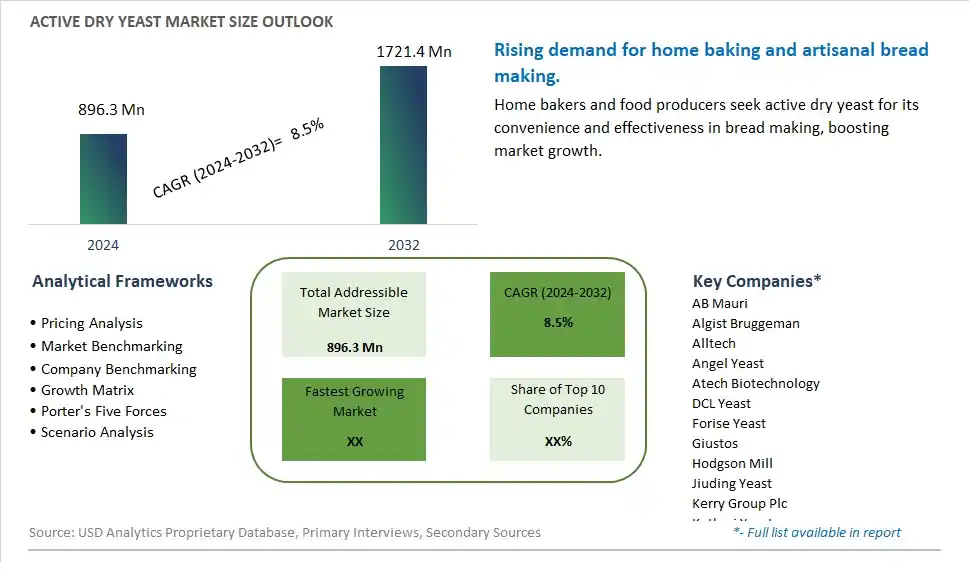
Global Active Dry Yeast Market Size is valued at $896.3 Million in 2024 and is forecast to register a growth rate (CAGR) of 8.5% to reach $1721.4 Million by 2032.
The global Active Dry Yeast Market Comprehensive Study analyzes and forecasts the market size across 6 regions and 24 countries for diverse segments -By Type (Food Grade, Feed Grade, Others), By Application (Bakery Fermentation, Feed Fermentation, Wine Fermentation, Others)
An Introduction to Active Dry Yeast Market
The Active Dry Yeast market in 2024 is witnessing substantial growth due to its critical role in the baking and brewing industries. The segment benefits from the rising demand for baked goods, beer, and bioethanol production. Innovations in yeast strains and fermentation processes are enhancing product performance and shelf life, making active dry yeast a versatile ingredient. The market is also supported by the increasing trend towards home baking and the craft beer movement, which are driving demand for high-quality, reliable yeast products among both consumers and small-scale producers.
Active Dry Yeast Competitive Landscape
The market report analyses the leading companies in the industry including AB Mauri, Algist Bruggeman, Alltech, Angel Yeast, Atech Biotechnology, DCL Yeast, Forise Yeast, Giustos, Hodgson Mill, Jiuding Yeast, Kerry Group Plc, Kothari Yeast, Lallemand, Leiber, Lessaffre Group, Pakmaya, Royal DSM N.V., Sunkeen, Xinghe Yeast, and Others.
Active Dry Yeast Market Dynamics
Active Dry Yeast Market Trend: Rising Popularity of Home Baking
The market for active dry yeast is experiencing a significant trend towards the rising popularity of home baking. This trend has been particularly accelerated by the global pandemic, where lockdowns and increased time spent at home led many consumers to explore baking as a hobby. Home bakers prefer active dry yeast for its convenience, long shelf life, and reliable performance in producing baked goods with excellent texture and flavor. Social media platforms and cooking blogs have further fueled this trend by sharing a plethora of recipes and baking techniques, making baking more accessible and enjoyable for a broader audience.
Active Dry Yeast Market Driver: Growing Demand for Baked Goods
The primary driver for the active dry yeast market is the growing demand for baked goods. This demand spans both the commercial and home baking sectors, driven by an increasing preference for fresh and artisanal bakery products. Active dry yeast plays a crucial role in the production of a wide range of baked items, including bread, pastries, and pizza dough, due to its effectiveness and ease of use. Additionally, the rise in health-conscious consumers seeking out whole grain and specialty bread has contributed to the sustained demand for active dry yeast, as it is a key ingredient in these products. The proliferation of small bakeries and home-based baking businesses also supports this growth.
Active Dry Yeast Market Opportunity: Innovation in Product Formulations
A significant opportunity for the active dry yeast market lies in innovation in product formulations. As consumer preferences evolve towards healthier and more diverse dietary options, there is potential to develop active dry yeast products tailored to specific needs, such as gluten-free, organic, or fortified with additional nutrients. Collaborating with food scientists and nutritionists to create specialized yeast formulations can cater to niche markets and attract health-conscious consumers. Furthermore, expanding the use of active dry yeast beyond traditional baking into areas such as brewing and fermentation for plant-based products can open new avenues for market growth. Strategic marketing and education on the benefits and versatility of these innovative yeast products can enhance consumer adoption and drive market expansion.
Active Dry Yeast Market Share Analysis: Food Grade segment generated the highest revenue share in the industry
The Food Grade segment is the largest in the Active Dry Yeast Market by type. This segment's dominance is driven by the widespread use of active dry yeast in the food and beverage industry, particularly in baking and brewing. Food grade active dry yeast is a crucial ingredient in the production of bread, pastries, and other baked goods due to its ability to leaven dough and impart desirable texture and flavor. Additionally, its use in the brewing industry for the fermentation of beer and other alcoholic beverages further contributes to its significant market share. The rising consumer demand for bakery products and craft beers, coupled with the growing trend of home baking and brewing, has fueled the demand for highquality, foodgrade active dry yeast. Manufacturers are also focusing on producing yeast variants that cater to specific dietary needs, such as glutenfree and organic options, further boosting the segment's growth and solidifying its position as the largest in the market.
Active Dry Yeast Market Share Analysis: Bakery Fermentation segment generated the highest revenue share in the industry
The Bakery Fermentation segment within the Active Dry Yeast Market is projected to be the fastest growing segment by 2032. This growth is primarily driven by the increasing global demand for bakery products, including bread, pastries, cakes, and other baked goods. The surge in home baking trends, especially fueled by the Recent past, has significantly boosted the consumption of active dry yeast for bakery fermentation. Additionally, the expansion of the bakery industry in emerging markets, where urbanization and rising disposable incomes are contributing to higher consumption of bakery products, supports this growth trajectory. Innovations in baking techniques and the development of new bakery product variants, such as glutenfree and organic options, are further driving the demand for active dry yeast in this segment. As consumer preferences continue to shift towards convenient, readytoeat, and fresh bakery items, the bakery fermentation segment is expected to see substantial growth, making it the fastest growing application area through 2032.
Active Dry Yeast Market Segmentation
By Type
Food Grade
Feed Grade
Others
By Application
Bakery Fermentation
Feed Fermentation
Wine Fermentation
Others
Countries Analyzed
North America (US, Canada, Mexico)
Europe (Germany, UK, France, Spain, Italy, Russia, Rest of Europe)
Asia Pacific (China, India, Japan, South Korea, Australia, South East Asia, Rest of Asia)
South America (Brazil, Argentina, Rest of South America)
Middle East and Africa (Saudi Arabia, UAE, Rest of Middle East, South Africa, Egypt, Rest of Africa)
Active Dry Yeast Companies Profiled in the Study
AB Mauri
Algist Bruggeman
Alltech
Angel Yeast
Atech Biotechnology
DCL Yeast
Forise Yeast
Giustos
Hodgson Mill
Jiuding Yeast
Kerry Group Plc
Kothari Yeast
Lallemand
Leiber
Lessaffre Group
Pakmaya
Royal DSM N.V.
Sunkeen
Xinghe Yeast
*- List Not Exhaustive
Chapter 1. TABLE OF CONTENTS
Chapter 2. Introduction to Active Dry Yeast Market
2.1. Market Overview
2.2. Key Statistics and Report Highlights
2.3. Scope of the Comprehensive Study
2.3.1. Market Definition
2.3.2 Countries and Regions Covered
2.3.3 Research Objective
2.3.4 Units, Currency, and Conversions
2.3.5 Industry Value Chain
2.4. Key Market Segments
2.5. Key Companies
2.6. Study Period
Chapter 3. Strategic Analysis Review
3.1. Active Dry Yeast Pricing Analysis and Forecast
3.2. Porter’s Five Forces
3.3. Market Ecosystem
3.4. SWOT Analysis
3.5. Regulatory Scenario
3.3. Effects of Inflation, Russia-Ukraine War, moderating economic growth, and other macroeconomic factors
Chapter 4. Competitive Landscape
4.1. Market Share Analysis
4.1.1. Global Active Dry Yeast Market Share by Company, 2023
4.1.2. Product Offerings of Leading Active Dry Yeast Companies
4.2. Market Entropy
4.2.1. New Product Launches in the Industry
4.2.2. Mergers, Acquisitions, Joint ventures, and Partnerships
4.3. Key Strategies and Best Practices
Chapter 5. Global Market Projections: Best, Reference, and Low Case Scenarios
5.1. Growth Analysis- Case Scenario Definitions
5.2. Low Growth Case Scenario Forecasts
5.3. Reference Growth Case Scenario Forecasts
5.4. High Growth Case Scenario Forecasts
Chapter 6. Market Dynamics
6.1. Active Dry Yeast Market Drivers
6.2. Active Dry Yeast Market Challenges
6.6. Active Dry Yeast Market Opportunities
6.4. Active Dry Yeast Market Trends
Chapter 7. Global Active Dry Yeast Market Outlook Trends
7.1. Global Active Dry Yeast Revenue (USD Million) and CAGR (%) by Type (2021-2032)
7.2. Global Active Dry Yeast Revenue (USD Million) and CAGR (%) by Application (2021-2032)
7.3. Global Active Dry Yeast Revenue (USD Million) and CAGR (%) by Product (2021-2032)
By Type
Food Grade
Feed Grade
Others
By Application
Bakery Fermentation
Feed Fermentation
Wine Fermentation
Others
Chapter 8. Global Active Dry Yeast Regional Analysis and Outlook
8.1. Global Active Dry Yeast Revenue (USD Million) By Regions (2021- 2032)
8.2. North America Active Dry Yeast Revenue (USD Million) by Country (2021-2032)
8.2.1. United States Active Dry Yeast Regional Analysis and Outlook
8.2.2. Canada Active Dry Yeast Regional Analysis and Outlook
8.2.3. Mexico Active Dry Yeast Regional Analysis and Outlook
8.3. Europe Active Dry Yeast Revenue (USD Million), by Country (2021-2032)
8.3.1. Germany Active Dry Yeast Regional Analysis and Outlook
8.3.2. France Active Dry Yeast Regional Analysis and Outlook
8.3.3. United Kingdom Active Dry Yeast Regional Analysis and Outlook
8.3.4. Spain Active Dry Yeast Regional Analysis and Outlook
8.3.5. Italy Active Dry Yeast Regional Analysis and Outlook
8.3.6. Russia Active Dry Yeast Regional Analysis and Outlook
8.3.7. Rest of Europe Active Dry Yeast Regional Analysis and Outlook
8.4. Asia Pacific Active Dry Yeast Revenue (USD Million) by Country (2021-2032)
8.4.1. China Active Dry Yeast Regional Analysis and Outlook
8.4.2. Japan Active Dry Yeast Regional Analysis and Outlook
8.4.3. India Active Dry Yeast Regional Analysis and Outlook
8.4.4. South Korea Active Dry Yeast Regional Analysis and Outlook
8.4.5. Australia Active Dry Yeast Regional Analysis and Outlook
8.4.6. South East Asia Active Dry Yeast Regional Analysis and Outlook
8.4.7. Rest of Asia Pacific Active Dry Yeast Regional Analysis and Outlook
8.5. South America Active Dry Yeast Revenue (USD Million), by Country (2021-2032)
8.5.1. Brazil Active Dry Yeast Regional Analysis and Outlook
8.5.2. Argentina Active Dry Yeast Regional Analysis and Outlook
8.5.3. Rest of South America Active Dry Yeast Regional Analysis and Outlook
8.6. Middle East and Africa Active Dry Yeast Revenue (USD Million) by Country (2021-2032)
8.6.1. Middle East Active Dry Yeast Regional Analysis and Outlook
8.6.2. Africa Active Dry Yeast Regional Analysis and Outlook
Chapter 9. North America Active Dry Yeast Analysis and Outlook
9.1. North America Active Dry Yeast Revenue (USD Million) by Segments (2021-2032)
9.1.1. North America Active Dry Yeast Revenue (USD Million) by Type (2021-2032)
9.1.2. North America Active Dry Yeast Revenue (USD Million) by Application (2021-2032)
9.1.3. North America Active Dry Yeast Revenue (USD Million) by Product (2021-2032)
By Type
Food Grade
Feed Grade
Others
By Application
Bakery Fermentation
Feed Fermentation
Wine Fermentation
Others
Chapter 10. Europe Active Dry Yeast Analysis and Outlook
10.1. Europe Active Dry Yeast Revenue (USD Million), by Segments (USD Million) (2021-2032)
10.1.1. Europe Active Dry Yeast Revenue (USD Million) by Type (2021-2032)
10.1.2. Europe Active Dry Yeast Revenue (USD Million) by Application (2021-2032)
10.1.3. Europe Active Dry Yeast Revenue (USD Million) by Product (2021-2032)
By Type
Food Grade
Feed Grade
Others
By Application
Bakery Fermentation
Feed Fermentation
Wine Fermentation
Others
Chapter 11. Asia Pacific Active Dry Yeast Analysis and Outlook
11.1. Asia Pacific Active Dry Yeast Revenue (USD Million), and Revenue (USD Million) by Segments (2021-2032)
11.1.1. Asia Pacific Active Dry Yeast Revenue (USD Million) by Type (2021-2032)
11.1.2. Asia Pacific Active Dry Yeast Revenue (USD Million) by Application (2021-2032)
11.1.3. Asia Pacific Active Dry Yeast Revenue (USD Million) by Product (2021-2032)
By Type
Food Grade
Feed Grade
Others
By Application
Bakery Fermentation
Feed Fermentation
Wine Fermentation
Others
Chapter 12. South America Active Dry Yeast Analysis and Outlook
12.1. South America Active Dry Yeast Revenue (USD Million), by Segments (2021-2032)
12.1.1. South America Active Dry Yeast Revenue (USD Million) by Type (2021-2032)
12.1.2. South America Active Dry Yeast Revenue (USD Million) by Application (2021-2032)
12.1.3. South America Active Dry Yeast Revenue (USD Million) by Product (2021-2032)
By Type
Food Grade
Feed Grade
Others
By Application
Bakery Fermentation
Feed Fermentation
Wine Fermentation
Others
Chapter 13. Middle East and Africa Active Dry Yeast Analysis and Outlook
13.1. Middle East and Africa Active Dry Yeast Revenue (USD Million), by Segments (2021-2032)
13.1.1. Middle East and Africa Active Dry Yeast Revenue (USD Million) by Type (2021-2032)
13.1.2. Middle East and Africa Active Dry Yeast Revenue (USD Million) by Application (2021-2032)
13.1.3. Middle East and Africa Active Dry Yeast Revenue (USD Million) by Product (2021-2032)
By Type
Food Grade
Feed Grade
Others
By Application
Bakery Fermentation
Feed Fermentation
Wine Fermentation
Others
Chapter 14. Active Dry Yeast Company Profiles
14.1 Business Overview
14.2 Product Profiles
14.3 SWOT Profiles
14.5 Recent Developments
14.6 Financial Profile
List of Companies
AB Mauri
Algist Bruggeman
Alltech
Angel Yeast
Atech Biotechnology
DCL Yeast
Forise Yeast
Giustos
Hodgson Mill
Jiuding Yeast
Kerry Group Plc
Kothari Yeast
Lallemand
Leiber
Lessaffre Group
Pakmaya
Royal DSM N.V.
Sunkeen
Xinghe Yeast
15. Methodology and Data Sources
15.1 Customization Offerings
15.2 Subscription Services
15.3 Related Reports
15.4 Publisher Expertise
LIST OF TABLES
Table 1 Market Segmentation Analysis
Table 2 Global Active Dry Yeast Market Share of Leading Companies, 2023
Table 3 Product Offerings of Leading Companies
Table 4 Low Growth Scenario Forecasts
Table 5 Reference Case Growth Scenario
Table 6 High Growth Case Scenario
Table 7 Global Active Dry Yeast Revenue (USD Million) And CAGR (%) By Type (2021-2032)
Table 8 Global Active Dry Yeast Revenue (USD Million) And CAGR (%) By Application (2021-2032)
Table 9 Global Active Dry Yeast Revenue (USD Million) And CAGR (%) By Product (2021-2032)
Table 10 Global Active Dry Yeast Market Revenue (USD Million) By Regions (2021-2032)
Table 11 Global Active Dry Yeast Market Share (%) By Regions (2021-2032)
Table 12 North America Active Dry Yeast Revenue (USD Million) By Country (2021-2032)
Table 13 Europe Active Dry Yeast Revenue (USD Million) By Country (2021-2032)
Table 14 Asia Pacific Active Dry Yeast Revenue (USD Million) By Country (2021-2032)
Table 15 South America Active Dry Yeast Revenue (USD Million) By Country (2021-2032)
Table 16 Middle East and Africa Active Dry Yeast Revenue (USD Million) By Region (2021-2032)
Table 17 North America Active Dry Yeast Revenue (USD Million) By Type (2021-2032)
Table 18 North America Active Dry Yeast Revenue (USD Million) By Application (2021-2032)
Table 19 North America Active Dry Yeast Revenue (USD Million) By Product (2021-2032)
Table 20 Europe Active Dry Yeast Revenue (USD Million) By Type (2021-2032)
Table 21 Europe Active Dry Yeast Revenue (USD Million) By Application (2021-2032)
Table 22 Europe Active Dry Yeast Revenue (USD Million) By Product (2021-2032)
Table 23 Asia Pacific Active Dry Yeast Revenue (USD Million) By Type (2021-2032)
Table 24 Asia Pacific Active Dry Yeast Revenue (USD Million) By Application (2021-2032)
Table 25 Asia Pacific Active Dry Yeast Revenue (USD Million) By Product (2021-2032)
Table 26 South America Active Dry Yeast Revenue (USD Million) By Type (2021-2032)
Table 27 South America Active Dry Yeast Revenue (USD Million) By Application (2021-2032)
Table 28 South America Active Dry Yeast Revenue (USD Million) By Product (2021-2032)
Table 29 Middle East and Africa Active Dry Yeast Revenue (USD Million) By Type (2021-2032)
Table 30 Middle East and Africa Active Dry Yeast Revenue (USD Million) By Application (2021-2032)
Table 31 Middle East and Africa Active Dry Yeast Revenue (USD Million) By Product (2021-2032)
LIST OF FIGURES
Figure 1. Market Scope
Figure 2. Pricing Forecasts Per Unit, 2023- 2032
Figure 3. Porter’s Five Forces
Figure 4. Global Active Dry Yeast Market Revenue (USD Million) By Regions (2021-2032)
Figure 5. Global Active Dry Yeast Market Share (%) By Regions (2023)
Figure 6. North America Active Dry Yeast Revenue (USD Million) By Country (2021-2032)
Figure 7. United States Active Dry Yeast Revenue (USD Million) By Country (2021-2032)
Figure 8. Canada Active Dry Yeast Revenue (USD Million) By Country (2021-2032)
Figure 9. Mexico Active Dry Yeast Revenue (USD Million) By Country (2021-2032)
Figure 10. Europe Active Dry Yeast Revenue (USD Million) By Country (2021-2032)
Figure 11. Germany Active Dry Yeast Revenue (USD Million) By Country (2021-2032)
Figure 12. France Active Dry Yeast Revenue (USD Million) By Country (2021-2032)
Figure 13. United Kingdom Active Dry Yeast Revenue (USD Million) By Country (2021-2032)
Figure 14. Spain Active Dry Yeast Revenue (USD Million) By Country (2021-2032)
Figure 15. Italy Active Dry Yeast Revenue (USD Million) By Country (2021-2032)
Figure 16. Russia Active Dry Yeast Revenue (USD Million) By Country (2021-2032)
Figure 17. Rest of Europe Active Dry Yeast Revenue (USD Million) By Country (2021-2032)
Figure 11. Asia Pacific Active Dry Yeast Revenue (USD Million) By Country (2021-2032)
Figure 12. China Active Dry Yeast Revenue (USD Million) By Country (2021-2032)
Figure 13. Japan Active Dry Yeast Revenue (USD Million) By Country (2021-2032)
Figure 14. India Active Dry Yeast Revenue (USD Million) By Country (2021-2032)
Figure 15. South Korea Active Dry Yeast Revenue (USD Million) By Country (2021-2032)
Figure 16. Australia Active Dry Yeast Revenue (USD Million) By Country (2021-2032)
Figure 17. South East Asia Active Dry Yeast Revenue (USD Million) By Country (2021-2032)
Figure 18. South America Active Dry Yeast Revenue (USD Million) By Country (2021-2032)
Figure 19. Brazil Active Dry Yeast Revenue (USD Million) By Country (2021-2032)
Figure 20. Argentina Active Dry Yeast Revenue (USD Million) By Country (2021-2032)
Figure 21. Rest of Asia Pacific Active Dry Yeast Revenue (USD Million) By Country (2021-2032)
Figure 22. Middle East and Africa Active Dry Yeast Revenue (USD Million) By Region (2021-2032)
Figure 23. Saudi Arabia Active Dry Yeast Revenue (USD Million) By Region (2021-2032)
Figure 24. The UAE Active Dry Yeast Revenue (USD Million) By Region (2021-2032)
Figure 25. Rest of Middle East Active Dry Yeast Revenue (USD Million) By Region (2021-2032)
Figure 26. South Africa Active Dry Yeast Revenue (USD Million) By Region (2021-2032)
Figure 27. Africa Active Dry Yeast Revenue (USD Million) By Region (2021-2032)
Figure 28. North America Active Dry Yeast Revenue (USD Million) By Type (2021-2032)
Figure 29. North America Active Dry Yeast Revenue (USD Million) By Application (2021-2032)
Figure 30. North America Active Dry Yeast Revenue (USD Million) By Product (2021-2032)
Figure 31. Europe Active Dry Yeast Revenue (USD Million) By Type (2021-2032)
Figure 32. Europe Active Dry Yeast Revenue (USD Million) By Application (2021-2032)
Figure 33. Europe Active Dry Yeast Revenue (USD Million) By Product (2021-2032)
Figure 34. Asia Pacific Active Dry Yeast Revenue (USD Million) By Type (2021-2032)
Figure 35. Asia Pacific Active Dry Yeast Revenue (USD Million) By Application (2021-2032)
Figure 36. Asia Pacific Active Dry Yeast Revenue (USD Million) By Product (2021-2032)
Figure 37. South America Active Dry Yeast Revenue (USD Million) By Type (2021-2032)
Figure 38. South America Active Dry Yeast Revenue (USD Million) By Application (2021-2032)
Figure 39. South America Active Dry Yeast Revenue (USD Million) By Product (2021-2032)
Figure 40. Middle East and Africa Active Dry Yeast Revenue (USD Million) By Type (2021-2032)
Figure 41. Middle East and Africa Active Dry Yeast Revenue (USD Million) By Application (2021-2032)
Figure 42. Middle East and Africa Active Dry Yeast Revenue (USD Million) By Product (2021-2032)
By Type
Food Grade
Feed Grade
Others
By Application
Bakery Fermentation
Feed Fermentation
Wine Fermentation
Others
Countries Analyzed
North America (US, Canada, Mexico)
Europe (Germany, UK, France, Spain, Italy, Russia, Rest of Europe)
Asia Pacific (China, India, Japan, South Korea, Australia, South East Asia, Rest of Asia)
South America (Brazil, Argentina, Rest of South America)
Middle East and Africa (Saudi Arabia, UAE, Rest of Middle East, South Africa, Egypt, Rest of Africa)
