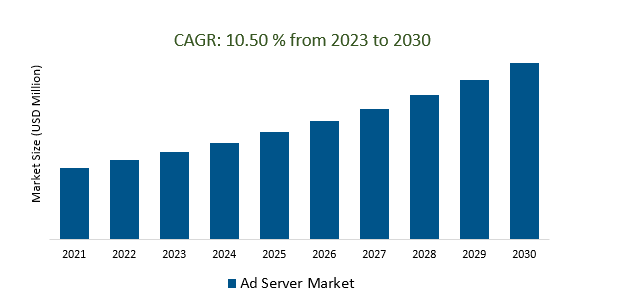
The Global Ad Server Market Size is estimated to register 10.5% growth over the forecast period from 2023 to 2030.
The market growth is driven by the increasing continued growth of digital advertising is a primary driver for the Ad Server Market. As more businesses shift their advertising budgets from traditional media to digital platforms, the demand for ad-serving solutions increases. Leading companies that are focused on, Growth in Digital Advertising Spending, Mobile-First and Mobile-Only, Programmatic Advertising Advancements, Connected TV (CTV) and OTT Advertising, Ad Blocker Countermeasures, and others to boost market shares in the industry.
Market Overview
The Ad Server Market comprises technology platforms that manage and deliver online advertisements, serving as a vital component of the digital advertising ecosystem. It caters to publishers, advertisers, and ad networks, offering features such as ad scheduling, precise targeting, real-time reporting, and ad tracking. Challenges include ad blocking, data privacy regulations, and fierce competition. The trends included the growth of programmatic and mobile advertising, the popularity of video and native ads, and the integration of AI for campaign optimization. The market is dynamic, with evolving trends and competition, requiring constant adaptation to industry changes.
Market Dynamics
Market Trends- Data-driven decision-making is essential for success in the ad server market
Data-driven decision-making is indeed essential for success in the Ad Server Market. Advertisers, publishers, and ad networks rely on data analytics to make informed choices regarding ad placements, audience targeting, ad creatives, and campaign optimization. By leveraging data, stakeholders can gain insights into ad performance, user behavior, and ROI, allowing them to refine their strategies and improve ad delivery. In a highly competitive and rapidly evolving market, those who harness data effectively can stay ahead by maximizing ad revenue, minimizing wastage, and providing a more personalized and engaging experience for users.
Market Driver- The General Data Protection Regulation (GDPR) and other privacy regulations are driving demand for ad server solutions that comply with these regulations.
Privacy regulations like GDPR are indeed fueling demand for ad server solutions that prioritize compliance. Advertisers and publishers are increasingly seeking ad servers that offer robust data protection features, user consent management, and tools for ensuring compliance with privacy laws. As the regulatory landscape continues to evolve, ad servers that can adapt to and facilitate adherence to these regulations are becoming a necessity in the digital advertising industry.
Market Opportunity-Introduction of Video-on-Demand (VoD) Services
Video-on-demand (VoD) services represent a significant opportunity within the Ad Server Market. As the popularity of streaming platforms and VoD services continues to grow, ad servers are essential for effectively delivering video advertisements to audiences. Ad servers that can seamlessly integrate with VoD platforms and provide advanced video ad targeting, tracking, and reporting capabilities are poised for substantial growth. The VoD segment offers a dynamic landscape for ad server providers to tap into the expanding digital video advertising space and cater to the evolving preferences of consumers who increasingly favor on-demand content over traditional television.
Market Share Analysis- Video ad servers Ad Server Market will register the fastest growth
The Global Ad Server Market is analyzed across Display Ad Servers, Video Ad Servers, and others. Video ad servers are poised to register the fastest growth. Video ad servers are crucial in the Ad Server Market, specializing in the efficient management and delivery of video advertisements across digital platforms like websites, mobile apps, and VoD services. These servers provide features for ad scheduling, precise targeting, real-time reporting, and tracking to optimize video ad campaigns. Given the growing prominence of online video content consumption, video ad servers are vital tools for advertisers and publishers, ensuring effective engagement with target audiences through compelling video ads while maintaining a seamless viewing experience.
Market Share Analysis- Reporting and analytics held a significant market share in 2023
The Global Ad Server Market is analyzed across various applications including Campaign Management, Ad Insertion, Reporting and Analytics, and others. Of these, Reporting and analytics held a significant market share in 2023. In the Ad Server Market, reporting and analytics are essential components, providing real-time insights into advertising campaign performance. Ad servers offer tools to track metrics like impressions, clicks, conversions, and user behavior, enabling data-driven decisions for optimizing campaigns and targeting specific audiences. These capabilities are critical for evaluating ad effectiveness, identifying trends, and making informed adjustments, ultimately maximizing ad revenue and return on investment.
Ad Server Market Segmentation
By Type
- Display Ad Servers
- Video Ad Servers
By Application
- Campaign Management
- Ad Insertion
- Reporting and Analytics
By End-User
- Advertisers
- Publishers
- Ad Networks
- Agencies
By Region
- North America (United States, Canada, Mexico)
- Europe (Germany, France, United Kingdom, Spain, Italy, Others)
- Asia Pacific (China, India, Japan, South Korea, Australia, Others)
- Latin America (Brazil, Argentina, Others)
- Middle East and Africa (Saudi Arabia, UAE, Kuwait, Other Middle East, South Africa, Nigeria, Other Africa)
Ad Server Market Companies
- Ezoic (United States)
- Adpushup (India)
- AdSense (United States)
- Media.net (India)
- DanAds (Sweden)
- MonetizeMore (Canada)
- AdButler (Canada)
- Kevel (United States)
- Insticator (United States)
- ZEDO (United States)
- OpenX (United States)
- Epom Ad Server (Ukraine)
- Magnite (United States),
- AOL (United States)
- Broadstreet (United States)
*List not exhaustive
Ad Server Market Outlook 2023
1 Market Overview
1.1 Introduction to the Ad Server Market
1.2 Scope of the Study
1.3 Research Objective
1.3.1 Key Market Scope and Segments
1.3.2 Players Covered
1.3.3 Years Considered
2 Executive Summary
2.1 2023 Ad Server Industry- Market Statistics
3 Market Dynamics
3.1 Market Drivers
3.2 Market Challenges
3.3 Market Opportunities
3.4 Market Trends
4 Market Factor Analysis
4.1 Porter’s Five Forces
4.2 Market Entropy
4.2.1 Global Ad Server Market Companies with Area Served
4.2.2 Products Offerings Global Ad Server Market
5 COVID-19 Impact Analysis and Outlook Scenarios
5.1.1 Covid-19 Impact Analysis
5.1.2 Post-COVID-19 Scenario- Low Growth Case
5.1.3 Post-COVID-19 Scenario- Reference Growth Case
5.1.4 Post-COVID-19 Scenario- Low Growth Case
6 Global Ad Server Market Trends
6.1 Global Ad Server Revenue (USD Million) and CAGR (%) by Type (2018-2030)
6.2 Global Ad Server Revenue (USD Million) and CAGR (%) by Applications (2018-2030)
6.3 Global Ad Server Revenue (USD Million) and CAGR (%) by Regions (2018-2030)
7 Global Ad Server Market Revenue (USD Million) by Type, and Applications (2018-2022)
7.1 Global Ad Server Revenue (USD Million) by Type (2018-2022)
7.1.1 Global Ad Server Revenue (USD Million), Market Share (%) by Type (2018-2022)
7.2 Global Ad Server Revenue (USD Million) by Applications (2018-2022)
7.2.1 Global Ad Server Revenue (USD Million), Market Share (%) by Applications (2018-2022)
8 Global Ad Server Development Regional Status and Outlook
8.1 Global Ad Server Revenue (USD Million) By Regions (2018-2022)
8.2 North America Ad Server Revenue (USD Million) by Type, and Application (2018-2022)
8.2.1 North America Ad Server Revenue (USD Million) by Country (2018-2022)
8.2.2 North America Ad Server Revenue (USD Million) by Type (2018-2022)
8.2.3 North America Ad Server Revenue (USD Million) by Applications (2018-2022)
8.3 Europe Ad Server Revenue (USD Million), by Type, and Applications (USD Million) (2018-2022)
8.3.1 Europe Ad Server Revenue (USD Million), by Country (2018-2022)
8.3.2 Europe Ad Server Revenue (USD Million) by Type (2018-2022)
8.3.3 Europe Ad Server Revenue (USD Million) by Applications (2018-2022)
8.4 Asia Pacific Ad Server Revenue (USD Million), and Revenue (USD Million) by Type, and Applications (2018-2022)
8.4.1 Asia Pacific Ad Server Revenue (USD Million) by Country (2018-2022)
8.4.2 Asia Pacific Ad Server Revenue (USD Million) by Type (2018-2022)
8.4.3 Asia Pacific Ad Server Revenue (USD Million) by Applications (2018-2022)
8.5 South America Ad Server Revenue (USD Million), by Type, and Applications (2018-2022)
8.5.1 South America Ad Server Revenue (USD Million), by Country (2018-2022)
8.5.2 South America Ad Server Revenue (USD Million) by Type (2018-2022)
8.5.3 South America Ad Server Revenue (USD Million) by Applications (2018-2022)
8.6 Middle East and Africa Ad Server Revenue (USD Million), by Type, Technology, Application, Thickness (2018-2022)
8.6.1 Middle East and Africa Ad Server Revenue (USD Million) by Country (2018-2022)
8.6.2 Middle East and Africa Ad Server Revenue (USD Million) by Type (2018-2022)
8.6.3 Middle East and Africa Ad Server Revenue (USD Million) by Applications (2018-2022)
9 Company Profiles
10 Global Ad Server Market Revenue (USD Million), by Type, and Applications (2023-2030)
10.1 Global Ad Server Revenue (USD Million) and Market Share (%) by Type (2023-2030)
10.1.1 Global Ad Server Revenue (USD Million), and Market Share (%) by Type (2023-2030)
10.2 Global Ad Server Revenue (USD Million) and Market Share (%) by Applications (2023-2030)
10.2.1 Global Ad Server Revenue (USD Million), and Market Share (%) by Applications (2023-2030)
11 Global Ad Server Development Regional Status and Outlook Forecast
11.1 Global Ad Server Revenue (USD Million) By Regions (2023-2030)
11.2 North America Ad Server Revenue (USD Million) by Type, and Applications (2023-2030)
11.2.1 North America Ad Server Revenue (USD) Million by Country (2023-2030)
11.2.2 North America Ad Server Revenue (USD Million), by Type (2023-2030)
11.2.3 North America Ad Server Revenue (USD Million), Market Share (%) by Applications (2023-2030)
11.3 Europe Ad Server Revenue (USD Million), by Type, and Applications (2023-2030)
11.3.1 Europe Ad Server Revenue (USD Million), by Country (2023-2030)
11.3.2 Europe Ad Server Revenue (USD Million), by Type (2023-2030)
11.3.3 Europe Ad Server Revenue (USD Million), by Applications (2023-2030)
11.4 Asia Pacific Ad Server Revenue (USD Million) by Type, and Applications (2023-2030)
11.4.1 Asia Pacific Ad Server Revenue (USD Million), by Country (2023-2030)
11.4.2 Asia Pacific Ad Server Revenue (USD Million), by Type (2023-2030)
11.4.3 Asia Pacific Ad Server Revenue (USD Million), by Applications (2023-2030)
11.5 South America Ad Server Revenue (USD Million), by Type, and Applications (2023-2030)
11.5.1 South America Ad Server Revenue (USD Million), by Country (2023-2030)
11.5.2 South America Ad Server Revenue (USD Million), by Type (2023-2030)
11.5.3 South America Ad Server Revenue (USD Million), by Applications (2023-2030)
11.6 Middle East and Africa Ad Server Revenue (USD Million), by Type, and Applications (2023-2030)
11.6.1 Middle East and Africa Ad Server Revenue (USD Million), by Region (2023-2030)
11.6.2 Middle East and Africa Ad Server Revenue (USD Million), by Type (2023-2030)
11.6.3 Middle East and Africa Ad Server Revenue (USD Million), by Applications (2023-2030)
12 Methodology and Data Sources
12.1 Methodology/Research Approach
12.1.1 Research Programs/Design
12.1.2 Market Size Estimation
12.1.3 Market Breakdown and Data Triangulation
12.2 Data Sources
12.2.1 Secondary Sources
12.2.2 Primary Sources
12.3 Disclaimer
List of Tables
Table 1 Market Segmentation Analysis
Table 2 Global Ad Server Market Companies with Areas Served
Table 3 Products Offerings Global Ad Server Market
Table 4 Low Growth Scenario Forecasts
Table 5 Reference Case Growth Scenario
Table 6 High Growth Case Scenario
Table 7 Global Ad Server Revenue (USD Million) And CAGR (%) By Type (2018-2030)
Table 8 Global Ad Server Revenue (USD Million) And CAGR (%) By Applications (2018-2030)
Table 9 Global Ad Server Revenue (USD Million) And CAGR (%) By Regions (2018-2030)
Table 10 Global Ad Server Revenue (USD Million) By Type (2018-2022)
Table 11 Global Ad Server Revenue Market Share (%) By Type (2018-2022)
Table 12 Global Ad Server Revenue (USD Million) By Applications (2018-2022)
Table 13 Global Ad Server Revenue Market Share (%) By Applications (2018-2022)
Table 14 Global Ad Server Market Revenue (USD Million) By Regions (2018-2022)
Table 15 Global Ad Server Market Share (%) By Regions (2018-2022)
Table 16 North America Ad Server Revenue (USD Million) By Country (2018-2022)
Table 17 North America Ad Server Revenue (USD Million) By Type (2018-2022)
Table 18 North America Ad Server Revenue (USD Million) By Applications (2018-2022)
Table 19 Europe Ad Server Revenue (USD Million) By Country (2018-2022)
Table 20 Europe Ad Server Revenue (USD Million) By Type (2018-2022)
Table 21 Europe Ad Server Revenue (USD Million) By Applications (2018-2022)
Table 22 Asia Pacific Ad Server Revenue (USD Million) By Country (2018-2022)
Table 23 Asia Pacific Ad Server Revenue (USD Million) By Type (2018-2022)
Table 24 Asia Pacific Ad Server Revenue (USD Million) By Applications (2018-2022)
Table 25 South America Ad Server Revenue (USD Million) By Country (2018-2022)
Table 26 South America Ad Server Revenue (USD Million) By Type (2018-2022)
Table 27 South America Ad Server Revenue (USD Million) By Applications (2018-2022)
Table 28 Middle East and Africa Ad Server Revenue (USD Million) By Region (2018-2022)
Table 29 Middle East and Africa Ad Server Revenue (USD Million) By Type (2018-2022)
Table 30 Middle East and Africa Ad Server Revenue (USD Million) By Applications (2018-2022)
Table 31 Financial Analysis
Table 32 Global Ad Server Revenue (USD Million) By Type (2023-2030)
Table 33 Global Ad Server Revenue Market Share (%) By Type (2023-2030)
Table 34 Global Ad Server Revenue (USD Million) By Applications (2023-2030)
Table 35 Global Ad Server Revenue Market Share (%) By Applications (2023-2030)
Table 36 Global Ad Server Market Revenue (USD Million), And Revenue (USD Million) By Regions (2023-2030)
Table 37 North America Ad Server Revenue (USD)By Country (2023-2030)
Table 38 North America Ad Server Revenue (USD Million) By Type (2023-2030)
Table 39 North America Ad Server Revenue (USD Million) By Applications (2023-2030)
Table 40 Europe Ad Server Revenue (USD Million) By Country (2023-2030)
Table 41 Europe Ad Server Revenue (USD Million) By Type (2023-2030)
Table 42 Europe Ad Server Revenue (USD Million) By Applications (2023-2030)
Table 43 Asia Pacific Ad Server Revenue (USD Million) By Country (2023-2030)
Table 44 Asia Pacific Ad Server Revenue (USD Million) By Type (2023-2030)
Table 45 Asia Pacific Ad Server Revenue (USD Million) By Applications (2023-2030)
Table 46 South America Ad Server Revenue (USD Million) By Country (2023-2030)
Table 47 South America Ad Server Revenue (USD Million) By Type (2023-2030)
Table 48 South America Ad Server Revenue (USD Million) By Applications (2023-2030)
Table 49 Middle East and Africa Ad Server Revenue (USD Million) By Region (2023-2030)
Table 50 Middle East and Africa Ad Server Revenue (USD Million) By Region (2023-2030)
Table 51 Middle East and Africa Ad Server Revenue (USD Million) By Type (2023-2030)
Table 52 Middle East and Africa Ad Server Revenue (USD Million) By Applications (2023-2030)
Table 53 Research Programs/Design for This Report
Table 54 Key Data Information from Secondary Sources
Table 55 Key Data Information from Primary Sources
List of Figures
Figure 1 Market Scope
Figure 2 Porter’s Five Forces
Figure 3 Global Ad Server Revenue (USD Million) By Type (2018-2022)
Figure 4 Global Ad Server Revenue Market Share (%) By Type (2022)
Figure 5 Global Ad Server Revenue (USD Million) By Applications (2018-2022)
Figure 6 Global Ad Server Revenue Market Share (%) By Applications (2022)
Figure 7 Global Ad Server Market Revenue (USD Million) By Regions (2018-2022)
Figure 8 Global Ad Server Market Share (%) By Regions (2022)
Figure 9 North America Ad Server Revenue (USD Million) By Country (2018-2022)
Figure 10 North America Ad Server Revenue (USD Million) By Type (2018-2022)
Figure 11 North America Ad Server Revenue (USD Million) By Applications (2018-2022)
Figure 12 Europe Ad Server Revenue (USD Million) By Country (2018-2022)
Figure 13 Europe Ad Server Revenue (USD Million) By Type (2018-2022)
Figure 14 Europe Ad Server Revenue (USD Million) By Applications (2018-2022)
Figure 15 Asia Pacific Ad Server Revenue (USD Million) By Country (2018-2022)
Figure 16 Asia Pacific Ad Server Revenue (USD Million) By Type (2018-2022)
Figure 17 Asia Pacific Ad Server Revenue (USD Million) By Applications (2018-2022)
Figure 18 South America Ad Server Revenue (USD Million) By Country (2018-2022)
Figure 19 South America Ad Server Revenue (USD Million) By Type (2018-2022)
Figure 20 South America Ad Server Revenue (USD Million) By Applications (2018-2022)
Figure 21 Middle East and Africa Ad Server Revenue (USD Million) By Region (2018-2022)
Figure 22 Middle East and Africa Ad Server Revenue (USD Million) By Type (2018-2022)
Figure 23 Middle East and Africa Ad Server Revenue (USD Million) By Applications (2018-2022)
Figure 24 Global Ad Server Revenue (USD Million) By Type (2023-2030)
Figure 25 Global Ad Server Revenue Market Share (%) By Type (2030)
Figure 26 Global Ad Server Revenue (USD Million) By Applications (2023-2030)
Figure 27 Global Ad Server Revenue Market Share (%) By Applications (2030)
Figure 28 Global Ad Server Market Revenue (USD Million) By Regions (2023-2030)
Figure 29 North America Ad Server Revenue (USD Million) By Country (2023-2030)
Figure 30 North America Ad Server Revenue (USD Million) By Type (2023-2030)
Figure 31 North America Ad Server Revenue (USD Million) By Applications (2023-2030)
Figure 32 Europe Ad Server Revenue (USD Million) By Country (2023-2030)
Figure 33 Europe Ad Server Revenue (USD Million) By Type (2023-2030)
Figure 34 Europe Ad Server Revenue (USD Million) By Applications (2023-2030)
Figure 35 Asia Pacific Ad Server Revenue (USD Million) By Country (2023-2030)
Figure 36 Asia Pacific Ad Server Revenue (USD Million) By Type (2023-2030)
Figure 37 Asia Pacific Ad Server Revenue (USD Million) By Applications (2023-2030)
Figure 38 South America Ad Server Revenue (USD Million) By Country (2023-2030)
Figure 39 South America Ad Server Revenue (USD Million) By Type (2023-2030)
Figure 40 South America Ad Server Revenue (USD Million) By Applications (2023-2030)
Figure 41 Middle East and Africa Ad Server Revenue (USD Million) By Region (2023-2030)
Figure 42 Middle East and Africa Ad Server Revenue (USD Million) By Region (2023-2030)
Figure 43 Middle East and Africa Ad Server Revenue (USD Million) By Type (2023-2030)
Figure 44 Middle East and Africa Ad Server Revenue (USD Million) By Applications (2023-2030)
Figure 45 Bottom-Up and Top-Down Approaches For This Report
Figure 46 Data Triangulation
