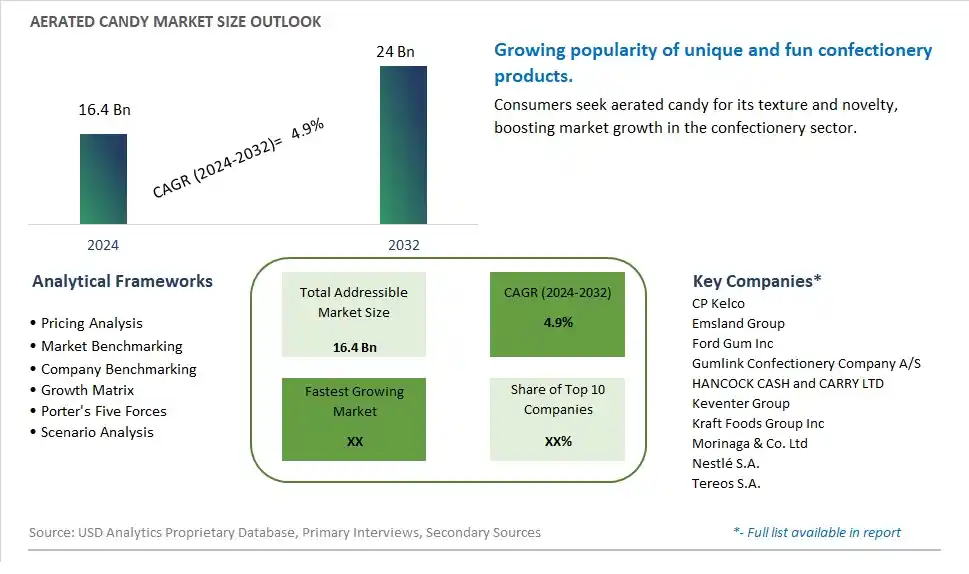
Global Aerated Candy Market Size is valued at $16.4 Billion in 2024 and is forecast to register a growth rate (CAGR) of 4.9% to reach $24 Billion by 2032.
The global Aerated Candy Market Comprehensive Study analyzes and forecasts the market size across 6 regions and 24 countries for diverse segments -By Type (Sugar-Free, Conventional), By Flavor (Plain, Flavored), By Distribution Channel (Supermarkets/Hypermarkets, Convenience Stores, Online Retail, Others)
An Introduction to Aerated Candy Market
The Aerated Candy market in 2024 is experiencing robust growth, driven by the increasing consumer preference for innovative and texture-rich confectionery products. Aerated candies, known for their light and airy texture, are gaining popularity among both children and adults. Advances in aeration technologies and flavor enhancement are enabling manufacturers to introduce a variety of exciting products. The market is also benefiting from trends towards premium and gourmet candies, as well as the growing demand for low-calorie and sugar-free options, appealing to health-conscious consumers.
Aerated Candy Competitive Landscape
The market report analyses the leading companies in the industry including CP Kelco, Emsland Group, Ford Gum Inc, Gumlink Confectionery Company A/S, HANCOCK CASH and CARRY LTD, Keventer Group, Kraft Foods Group Inc, Morinaga & Co. Ltd, Nestlé S.A., Tereos S.A., and Others.
Aerated Candy Market Dynamics
Aerated Candy Market Trend: Growing Popularity of Novelty and Texture-Enhanced Confections
The market for aerated candy is witnessing a significant trend towards the growing popularity of novelty and texture-enhanced confections. Consumers are increasingly seeking unique and enjoyable sensory experiences in their candy choices, and aerated candy offers a distinctive light and airy texture that stands out from traditional candies. This trend is driven by a desire for new and exciting flavors and textures, particularly among younger consumers who are drawn to innovative and playful food products. The visual appeal and unique mouthfeel of aerated candies, often highlighted through creative packaging and marketing campaigns, contribute to their rising popularity in the confectionery market.
Aerated Candy Market Driver: Increased Demand for Low-Calorie and Indulgent Treats
The primary driver for the aerated candy market is the increased demand for low-calorie and indulgent treats. Aerated candies, due to their unique production process, typically have a lower density and can offer a satisfying indulgence with fewer calories compared to traditional dense candies. This makes them an attractive option for health-conscious consumers who are looking to enjoy sweet treats without compromising their dietary goals. The rising awareness of calorie intake and the growing trend towards mindful snacking are encouraging consumers to opt for aerated candies as a guilt-free indulgence. The combination of indulgence and health appeal is a key factor driving the demand for aerated candy.
Aerated Candy Market Opportunity: Expansion through Flavor Innovation and Premiumization
A significant opportunity for the aerated candy market lies in expansion through flavor innovation and premiumization. Developing new and exotic flavors can attract adventurous consumers and create a buzz in the market, while premium ingredients and artisanal production methods can appeal to a more discerning audience. There is potential to introduce limited edition and seasonal flavors, as well as collaborations with popular brands and influencers to enhance product visibility and appeal. Additionally, focusing on the premium segment by offering high-quality, gourmet aerated candies can cater to consumers willing to pay a premium for superior taste and unique experiences. Leveraging online platforms and social media for targeted marketing campaigns can further drive growth and capture new market segments.
Aerated Candy Market Share Analysis: Conventional segment generated the highest revenue share in the industry
The Conventional segment is the largest in the Aerated Candy Market by type. This segment's prominence is due to the widespread appeal and longstanding popularity of traditional aerated candies, which are often favored for their familiar taste and texture. Conventional aerated candies, which include marshmallows, nougats, and certain types of chocolate, are widely available and enjoyed by a broad consumer base. These candies are made with sugar and other common ingredients that contribute to their sweet taste and enjoyable mouthfeel. The extensive variety of flavors, shapes, and sizes available in conventional aerated candies also adds to their appeal, making them a staple in the confectionery market. Further, the strong brand recognition and consumer loyalty associated with many conventional aerated candy products help maintain their leading position in the market.
Aerated Candy Market Share Analysis: Flavored is the fastest growing segment over the forecast period to 2032
The Flavored segment within the Aerated Candy Market is projected to be the fastest growing segment by 2032. This rapid growth is driven by the increasing consumer demand for variety and innovative taste experiences. Flavored aerated candies offer a wide range of options, from fruity and sour flavors to unique and exotic combinations, catering to diverse consumer preferences. The continuous innovation in flavor profiles, often inspired by global culinary trends, attracts adventurous consumers looking to try new and exciting products. Additionally, the trend towards personalization in the confectionery market, where consumers seek customized and novel flavors, further fuels the demand for flavored aerated candies. As manufacturers continue to experiment with and introduce new flavors, the flavored segment is expected to see significant growth, making it the fastest growing segment in the aerated candy market through 2032.
Aerated Candy Market Share Analysis: Supermarkets/Hypermarkets generated the highest revenue share in the industry
The Supermarkets/Hypermarkets segment is the largest in the Aerated Candy Market by distribution channel. This segment's dominance is due to the extensive reach and accessibility of supermarkets and hypermarkets, which are the primary shopping destinations for many consumers. These retail formats offer a wide variety of aerated candy products, providing consumers with the convenience of onestop shopping. The ability to physically see and choose from a broad range of candy options, along with attractive instore displays and promotions, drives significant sales through this channel. Additionally, supermarkets and hypermarkets often have the advantage of bulk purchasing and competitive pricing, making them appealing to pricesensitive consumers. The widespread presence of these stores in both urban and rural areas further contributes to their leading position in the aerated candy market.
Aerated Candy Market Segmentation
By Type
Sugar-Free
Conventional
By Flavor
Plain
Flavored
By Distribution Channel
Supermarkets/Hypermarkets
Convenience Stores
Online Retail
Others
Countries Analyzed
North America (US, Canada, Mexico)
Europe (Germany, UK, France, Spain, Italy, Russia, Rest of Europe)
Asia Pacific (China, India, Japan, South Korea, Australia, South East Asia, Rest of Asia)
South America (Brazil, Argentina, Rest of South America)
Middle East and Africa (Saudi Arabia, UAE, Rest of Middle East, South Africa, Egypt, Rest of Africa)
Aerated Candy Companies Profiled in the Study
CP Kelco
Emsland Group
Ford Gum Inc
Gumlink Confectionery Company A/S
HANCOCK CASH and CARRY LTD
Keventer Group
Kraft Foods Group Inc
Morinaga & Co. Ltd
Nestlé S.A.
Tereos S.A.
*- List Not Exhaustive
Chapter 1. TABLE OF CONTENTS
Chapter 2. Introduction to Aerated Candy Market
2.1. Market Overview
2.2. Key Statistics and Report Highlights
2.3. Scope of the Comprehensive Study
2.3.1. Market Definition
2.3.2 Countries and Regions Covered
2.3.3 Research Objective
2.3.4 Units, Currency, and Conversions
2.3.5 Industry Value Chain
2.4. Key Market Segments
2.5. Key Companies
2.6. Study Period
Chapter 3. Strategic Analysis Review
3.1. Aerated Candy Pricing Analysis and Forecast
3.2. Porter’s Five Forces
3.3. Market Ecosystem
3.4. SWOT Analysis
3.5. Regulatory Scenario
3.3. Effects of Inflation, Russia-Ukraine War, moderating economic growth, and other macroeconomic factors
Chapter 4. Competitive Landscape
4.1. Market Share Analysis
4.1.1. Global Aerated Candy Market Share by Company, 2023
4.1.2. Product Offerings of Leading Aerated Candy Companies
4.2. Market Entropy
4.2.1. New Product Launches in the Industry
4.2.2. Mergers, Acquisitions, Joint ventures, and Partnerships
4.3. Key Strategies and Best Practices
Chapter 5. Global Market Projections: Best, Reference, and Low Case Scenarios
5.1. Growth Analysis- Case Scenario Definitions
5.2. Low Growth Case Scenario Forecasts
5.3. Reference Growth Case Scenario Forecasts
5.4. High Growth Case Scenario Forecasts
Chapter 6. Market Dynamics
6.1. Aerated Candy Market Drivers
6.2. Aerated Candy Market Challenges
6.6. Aerated Candy Market Opportunities
6.4. Aerated Candy Market Trends
Chapter 7. Global Aerated Candy Market Outlook Trends
7.1. Global Aerated Candy Revenue (USD Million) and CAGR (%) by Type (2021-2032)
7.2. Global Aerated Candy Revenue (USD Million) and CAGR (%) by Application (2021-2032)
7.3. Global Aerated Candy Revenue (USD Million) and CAGR (%) by Product (2021-2032)
By Type
Sugar-Free
Conventional
By Flavor
Plain
Flavored
By Distribution Channel
Supermarkets/Hypermarkets
Convenience Stores
Online Retail
Others
Chapter 8. Global Aerated Candy Regional Analysis and Outlook
8.1. Global Aerated Candy Revenue (USD Million) By Regions (2021- 2032)
8.2. North America Aerated Candy Revenue (USD Million) by Country (2021-2032)
8.2.1. United States Aerated Candy Regional Analysis and Outlook
8.2.2. Canada Aerated Candy Regional Analysis and Outlook
8.2.3. Mexico Aerated Candy Regional Analysis and Outlook
8.3. Europe Aerated Candy Revenue (USD Million), by Country (2021-2032)
8.3.1. Germany Aerated Candy Regional Analysis and Outlook
8.3.2. France Aerated Candy Regional Analysis and Outlook
8.3.3. United Kingdom Aerated Candy Regional Analysis and Outlook
8.3.4. Spain Aerated Candy Regional Analysis and Outlook
8.3.5. Italy Aerated Candy Regional Analysis and Outlook
8.3.6. Russia Aerated Candy Regional Analysis and Outlook
8.3.7. Rest of Europe Aerated Candy Regional Analysis and Outlook
8.4. Asia Pacific Aerated Candy Revenue (USD Million) by Country (2021-2032)
8.4.1. China Aerated Candy Regional Analysis and Outlook
8.4.2. Japan Aerated Candy Regional Analysis and Outlook
8.4.3. India Aerated Candy Regional Analysis and Outlook
8.4.4. South Korea Aerated Candy Regional Analysis and Outlook
8.4.5. Australia Aerated Candy Regional Analysis and Outlook
8.4.6. South East Asia Aerated Candy Regional Analysis and Outlook
8.4.7. Rest of Asia Pacific Aerated Candy Regional Analysis and Outlook
8.5. South America Aerated Candy Revenue (USD Million), by Country (2021-2032)
8.5.1. Brazil Aerated Candy Regional Analysis and Outlook
8.5.2. Argentina Aerated Candy Regional Analysis and Outlook
8.5.3. Rest of South America Aerated Candy Regional Analysis and Outlook
8.6. Middle East and Africa Aerated Candy Revenue (USD Million) by Country (2021-2032)
8.6.1. Middle East Aerated Candy Regional Analysis and Outlook
8.6.2. Africa Aerated Candy Regional Analysis and Outlook
Chapter 9. North America Aerated Candy Analysis and Outlook
9.1. North America Aerated Candy Revenue (USD Million) by Segments (2021-2032)
9.1.1. North America Aerated Candy Revenue (USD Million) by Type (2021-2032)
9.1.2. North America Aerated Candy Revenue (USD Million) by Application (2021-2032)
9.1.3. North America Aerated Candy Revenue (USD Million) by Product (2021-2032)
By Type
Sugar-Free
Conventional
By Flavor
Plain
Flavored
By Distribution Channel
Supermarkets/Hypermarkets
Convenience Stores
Online Retail
Others
Chapter 10. Europe Aerated Candy Analysis and Outlook
10.1. Europe Aerated Candy Revenue (USD Million), by Segments (USD Million) (2021-2032)
10.1.1. Europe Aerated Candy Revenue (USD Million) by Type (2021-2032)
10.1.2. Europe Aerated Candy Revenue (USD Million) by Application (2021-2032)
10.1.3. Europe Aerated Candy Revenue (USD Million) by Product (2021-2032)
By Type
Sugar-Free
Conventional
By Flavor
Plain
Flavored
By Distribution Channel
Supermarkets/Hypermarkets
Convenience Stores
Online Retail
Others
Chapter 11. Asia Pacific Aerated Candy Analysis and Outlook
11.1. Asia Pacific Aerated Candy Revenue (USD Million), and Revenue (USD Million) by Segments (2021-2032)
11.1.1. Asia Pacific Aerated Candy Revenue (USD Million) by Type (2021-2032)
11.1.2. Asia Pacific Aerated Candy Revenue (USD Million) by Application (2021-2032)
11.1.3. Asia Pacific Aerated Candy Revenue (USD Million) by Product (2021-2032)
By Type
Sugar-Free
Conventional
By Flavor
Plain
Flavored
By Distribution Channel
Supermarkets/Hypermarkets
Convenience Stores
Online Retail
Others
Chapter 12. South America Aerated Candy Analysis and Outlook
12.1. South America Aerated Candy Revenue (USD Million), by Segments (2021-2032)
12.1.1. South America Aerated Candy Revenue (USD Million) by Type (2021-2032)
12.1.2. South America Aerated Candy Revenue (USD Million) by Application (2021-2032)
12.1.3. South America Aerated Candy Revenue (USD Million) by Product (2021-2032)
By Type
Sugar-Free
Conventional
By Flavor
Plain
Flavored
By Distribution Channel
Supermarkets/Hypermarkets
Convenience Stores
Online Retail
Others
Chapter 13. Middle East and Africa Aerated Candy Analysis and Outlook
13.1. Middle East and Africa Aerated Candy Revenue (USD Million), by Segments (2021-2032)
13.1.1. Middle East and Africa Aerated Candy Revenue (USD Million) by Type (2021-2032)
13.1.2. Middle East and Africa Aerated Candy Revenue (USD Million) by Application (2021-2032)
13.1.3. Middle East and Africa Aerated Candy Revenue (USD Million) by Product (2021-2032)
By Type
Sugar-Free
Conventional
By Flavor
Plain
Flavored
By Distribution Channel
Supermarkets/Hypermarkets
Convenience Stores
Online Retail
Others
Chapter 14. Aerated Candy Company Profiles
14.1 Business Overview
14.2 Product Profiles
14.3 SWOT Profiles
14.5 Recent Developments
14.6 Financial Profile
List of Companies
CP Kelco
Emsland Group
Ford Gum Inc
Gumlink Confectionery Company A/S
HANCOCK CASH and CARRY LTD
Keventer Group
Kraft Foods Group Inc
Morinaga & Co. Ltd
Nestlé S.A.
Tereos S.A.
15. Methodology and Data Sources
15.1 Customization Offerings
15.2 Subscription Services
15.3 Related Reports
15.4 Publisher Expertise
LIST OF TABLES
Table 1 Market Segmentation Analysis
Table 2 Global Aerated Candy Market Share of Leading Companies, 2023
Table 3 Product Offerings of Leading Companies
Table 4 Low Growth Scenario Forecasts
Table 5 Reference Case Growth Scenario
Table 6 High Growth Case Scenario
Table 7 Global Aerated Candy Revenue (USD Million) And CAGR (%) By Type (2021-2032)
Table 8 Global Aerated Candy Revenue (USD Million) And CAGR (%) By Application (2021-2032)
Table 9 Global Aerated Candy Revenue (USD Million) And CAGR (%) By Product (2021-2032)
Table 10 Global Aerated Candy Market Revenue (USD Million) By Regions (2021-2032)
Table 11 Global Aerated Candy Market Share (%) By Regions (2021-2032)
Table 12 North America Aerated Candy Revenue (USD Million) By Country (2021-2032)
Table 13 Europe Aerated Candy Revenue (USD Million) By Country (2021-2032)
Table 14 Asia Pacific Aerated Candy Revenue (USD Million) By Country (2021-2032)
Table 15 South America Aerated Candy Revenue (USD Million) By Country (2021-2032)
Table 16 Middle East and Africa Aerated Candy Revenue (USD Million) By Region (2021-2032)
Table 17 North America Aerated Candy Revenue (USD Million) By Type (2021-2032)
Table 18 North America Aerated Candy Revenue (USD Million) By Application (2021-2032)
Table 19 North America Aerated Candy Revenue (USD Million) By Product (2021-2032)
Table 20 Europe Aerated Candy Revenue (USD Million) By Type (2021-2032)
Table 21 Europe Aerated Candy Revenue (USD Million) By Application (2021-2032)
Table 22 Europe Aerated Candy Revenue (USD Million) By Product (2021-2032)
Table 23 Asia Pacific Aerated Candy Revenue (USD Million) By Type (2021-2032)
Table 24 Asia Pacific Aerated Candy Revenue (USD Million) By Application (2021-2032)
Table 25 Asia Pacific Aerated Candy Revenue (USD Million) By Product (2021-2032)
Table 26 South America Aerated Candy Revenue (USD Million) By Type (2021-2032)
Table 27 South America Aerated Candy Revenue (USD Million) By Application (2021-2032)
Table 28 South America Aerated Candy Revenue (USD Million) By Product (2021-2032)
Table 29 Middle East and Africa Aerated Candy Revenue (USD Million) By Type (2021-2032)
Table 30 Middle East and Africa Aerated Candy Revenue (USD Million) By Application (2021-2032)
Table 31 Middle East and Africa Aerated Candy Revenue (USD Million) By Product (2021-2032)
LIST OF FIGURES
Figure 1. Market Scope
Figure 2. Pricing Forecasts Per Unit, 2023- 2032
Figure 3. Porter’s Five Forces
Figure 4. Global Aerated Candy Market Revenue (USD Million) By Regions (2021-2032)
Figure 5. Global Aerated Candy Market Share (%) By Regions (2023)
Figure 6. North America Aerated Candy Revenue (USD Million) By Country (2021-2032)
Figure 7. United States Aerated Candy Revenue (USD Million) By Country (2021-2032)
Figure 8. Canada Aerated Candy Revenue (USD Million) By Country (2021-2032)
Figure 9. Mexico Aerated Candy Revenue (USD Million) By Country (2021-2032)
Figure 10. Europe Aerated Candy Revenue (USD Million) By Country (2021-2032)
Figure 11. Germany Aerated Candy Revenue (USD Million) By Country (2021-2032)
Figure 12. France Aerated Candy Revenue (USD Million) By Country (2021-2032)
Figure 13. United Kingdom Aerated Candy Revenue (USD Million) By Country (2021-2032)
Figure 14. Spain Aerated Candy Revenue (USD Million) By Country (2021-2032)
Figure 15. Italy Aerated Candy Revenue (USD Million) By Country (2021-2032)
Figure 16. Russia Aerated Candy Revenue (USD Million) By Country (2021-2032)
Figure 17. Rest of Europe Aerated Candy Revenue (USD Million) By Country (2021-2032)
Figure 11. Asia Pacific Aerated Candy Revenue (USD Million) By Country (2021-2032)
Figure 12. China Aerated Candy Revenue (USD Million) By Country (2021-2032)
Figure 13. Japan Aerated Candy Revenue (USD Million) By Country (2021-2032)
Figure 14. India Aerated Candy Revenue (USD Million) By Country (2021-2032)
Figure 15. South Korea Aerated Candy Revenue (USD Million) By Country (2021-2032)
Figure 16. Australia Aerated Candy Revenue (USD Million) By Country (2021-2032)
Figure 17. South East Asia Aerated Candy Revenue (USD Million) By Country (2021-2032)
Figure 18. South America Aerated Candy Revenue (USD Million) By Country (2021-2032)
Figure 19. Brazil Aerated Candy Revenue (USD Million) By Country (2021-2032)
Figure 20. Argentina Aerated Candy Revenue (USD Million) By Country (2021-2032)
Figure 21. Rest of Asia Pacific Aerated Candy Revenue (USD Million) By Country (2021-2032)
Figure 22. Middle East and Africa Aerated Candy Revenue (USD Million) By Region (2021-2032)
Figure 23. Saudi Arabia Aerated Candy Revenue (USD Million) By Region (2021-2032)
Figure 24. The UAE Aerated Candy Revenue (USD Million) By Region (2021-2032)
Figure 25. Rest of Middle East Aerated Candy Revenue (USD Million) By Region (2021-2032)
Figure 26. South Africa Aerated Candy Revenue (USD Million) By Region (2021-2032)
Figure 27. Africa Aerated Candy Revenue (USD Million) By Region (2021-2032)
Figure 28. North America Aerated Candy Revenue (USD Million) By Type (2021-2032)
Figure 29. North America Aerated Candy Revenue (USD Million) By Application (2021-2032)
Figure 30. North America Aerated Candy Revenue (USD Million) By Product (2021-2032)
Figure 31. Europe Aerated Candy Revenue (USD Million) By Type (2021-2032)
Figure 32. Europe Aerated Candy Revenue (USD Million) By Application (2021-2032)
Figure 33. Europe Aerated Candy Revenue (USD Million) By Product (2021-2032)
Figure 34. Asia Pacific Aerated Candy Revenue (USD Million) By Type (2021-2032)
Figure 35. Asia Pacific Aerated Candy Revenue (USD Million) By Application (2021-2032)
Figure 36. Asia Pacific Aerated Candy Revenue (USD Million) By Product (2021-2032)
Figure 37. South America Aerated Candy Revenue (USD Million) By Type (2021-2032)
Figure 38. South America Aerated Candy Revenue (USD Million) By Application (2021-2032)
Figure 39. South America Aerated Candy Revenue (USD Million) By Product (2021-2032)
Figure 40. Middle East and Africa Aerated Candy Revenue (USD Million) By Type (2021-2032)
Figure 41. Middle East and Africa Aerated Candy Revenue (USD Million) By Application (2021-2032)
Figure 42. Middle East and Africa Aerated Candy Revenue (USD Million) By Product (2021-2032)
By Type
Sugar-Free
Conventional
By Flavor
Plain
Flavored
By Distribution Channel
Supermarkets/Hypermarkets
Convenience Stores
Online Retail
Others
Countries Analyzed
North America (US, Canada, Mexico)
Europe (Germany, UK, France, Spain, Italy, Russia, Rest of Europe)
Asia Pacific (China, India, Japan, South Korea, Australia, South East Asia, Rest of Asia)
South America (Brazil, Argentina, Rest of South America)
Middle East and Africa (Saudi Arabia, UAE, Rest of Middle East, South Africa, Egypt, Rest of Africa)
