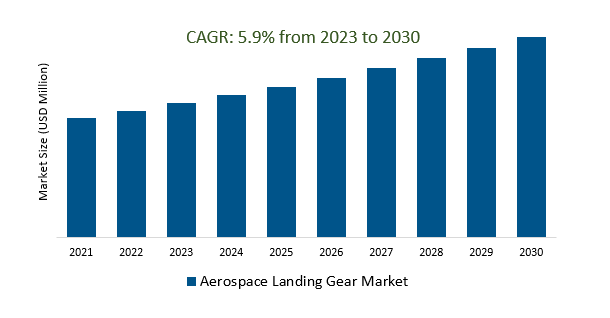
The Global Aerospace Landing Gear Market Size is estimated to register 5.9% growth over the forecast period from 2023 to 2030.
The market growth is driven by Increasing advancements in landing gear technology, including smart sensors, predictive maintenance, and 3D printing, which are driving the market growth. Leading Companies focusing on Rising Demand for Aircraft, Emerging Technologies, Emerging Markets, Digital Transformation, and others to boost market shares in the industry.
Market Overview
The Aerospace Landing Gear Market involves the design, manufacturing, and maintenance of landing gear systems for aircraft. Key players include Safran Landing Systems, Raytheon Technologies, and Héroux-Devtek. The market is driven by aircraft demand, technological advancements, military modernization, MRO services, and environmental regulations. Challenges include high development costs, safety standards, economic uncertainty, and supply chain disruptions. The market's size fluctuates based on economic and industry conditions and can be segmented by aircraft type, landing gear type, component type, end-users, and geography. Accurate information requires up-to-date industry reports and news.
Market Dynamics
Market Trends-The rising demand for air travel is driving growth in the aerospace landing gear market.
The Aerospace Landing Gear Market is flourishing due to the growing demand for air travel. This surge in commercial and cargo aviation necessitates advanced and efficient landing gear systems to support the expanding fleet. Manufacturers are innovating to enhance safety, fuel efficiency, and performance to meet these demands. This trend not only addresses current aviation needs but also paves the way for continuous advancements in landing gear systems to meet the future requirements of the aerospace industry.
Market Driver- The demand for aerospace landing gear is increasing due to the need to improve fuel efficiency.
The Aerospace Landing Gear Market is experiencing increased demand, primarily driven by the industry's pressing need to enhance fuel efficiency. In response to environmental sustainability goals and the drive to reduce operational costs, aircraft manufacturers and operators are seeking lighter, more aerodynamic, and energy-efficient landing gear systems. These innovations are crucial for improving fuel efficiency and reducing emissions, aligning with stringent environmental regulations and the industry's commitment to greener, cost-effective aviation practices.
Market Opportunity- Military aircraft require specialized landing gear that can withstand the rigors of combat operations.
Military aircraft require specialized landing gear systems designed for combat operations, capable of withstanding rough terrains and adverse conditions. These landing gear systems are engineered with enhanced durability, adaptability, and shock absorption to support tactical advantages such as short take-offs and landings (STOL). With global defense spending and modernization efforts, the demand for advanced military landing gear remains significant, making it a crucial component of the aerospace landing gear market.
Market Share Analysis- Actuation system Aerospace Landing Gear Market will register the fastest growth
The Global Aerospace Landing Gear Market is analyzed across systems, Actuation systems, Brake systems, Tires, and others. The actuation system is poised to register the fastest growth. In the Aerospace Landing Gear Market, the actuation system is crucial for extending and retracting landing gear during take-off and landing. It uses hydraulic or electric actuators to ensure the landing gear's proper positioning, directly impacting the safety and performance of the aircraft. Ongoing innovations in actuation systems, particularly in digital control and automation, are enhancing landing gear efficiency and safety in various flight phases.
Market Share Analysis- Tri-cycle held a significant market share in 2023
The Global Aerospace Landing Gear Market is analyzed across various Arrangements including Tail Wheel, Tandem, Tri-cycle, and others. Of these, Tri-cycle held a significant market share in 2023. Tricycle landing gear, characterized by a nose wheel and two main landing gear wheels under the wings, is a widely used configuration in the Aerospace Landing Gear Market. This setup offers stability, ease of ground maneuvering, and precise steering control, making it a preferred choice for various commercial and general aviation aircraft, enhancing their performance on runways and taxiways.
Aerospace Landing Gear Market Segmentation
By Technology
- Steering system
- Actuation system
- Brake system
- Tires
- Others
By Arrangement
- Tail Wheel
- Tandem
- Tri-cycle
By End User
- Commercial
- Defence
- Military
By Region
- North America (United States, Canada, Mexico)
- Europe (Germany, France, United Kingdom, Spain, Italy, Others)
- Asia Pacific (China, India, Japan, South Korea, Australia, Others)
- Latin America (Brazil, Argentina, Others)
- Middle East and Africa (Saudi Arabia, UAE, Kuwait, Other Middle East, South Africa, Nigeria, Other Africa)
Aerospace Landing Gear Market Companies
- Eaton Corporation
- GKN Aerospace
- AAR Corp
- Safran Landing Systems
- Heroux-Devtek Inc
- Liebherr Group
- Magellan Aerospace
*List not exhaustive
Aerospace Landing Gear Market Outlook 2023
1 Market Overview
1.1 Introduction to the Aerospace Landing Gear Market
1.2 Scope of the Study
1.3 Research Objective
1.3.1 Key Market Scope and Segments
1.3.2 Players Covered
1.3.3 Years Considered
2 Executive Summary
2.1 2023 Aerospace Landing Gear Industry- Market Statistics
3 Market Dynamics
3.1 Market Drivers
3.2 Market Challenges
3.3 Market Opportunities
3.4 Market Trends
4 Market Factor Analysis
4.1 Porter’s Five Forces
4.2 Market Entropy
4.2.1 Global Aerospace Landing Gear Market Companies with Area Served
4.2.2 Products Offerings Global Aerospace Landing Gear Market
5 COVID-19 Impact Analysis and Outlook Scenarios
5.1.1 Covid-19 Impact Analysis
5.1.2 Post-COVID-19 Scenario- Low Growth Case
5.1.3 Post-COVID-19 Scenario- Reference Growth Case
5.1.4 Post-COVID-19 Scenario- Low Growth Case
6 Global Aerospace Landing Gear Market Trends
6.1 Global Aerospace Landing Gear Revenue (USD Million) and CAGR (%) by Type (2018-2030)
6.2 Global Aerospace Landing Gear Revenue (USD Million) and CAGR (%) by Applications (2018-2030)
6.3 Global Aerospace Landing Gear Revenue (USD Million) and CAGR (%) by Regions (2018-2030)
7 Global Aerospace Landing Gear Market Revenue (USD Million) by Type, and Applications (2018-2022)
7.1 Global Aerospace Landing Gear Revenue (USD Million) by Type (2018-2022)
7.1.1 Global Aerospace Landing Gear Revenue (USD Million), Market Share (%) by Type (2018-2022)
7.2 Global Aerospace Landing Gear Revenue (USD Million) by Applications (2018-2022)
7.2.1 Global Aerospace Landing Gear Revenue (USD Million), Market Share (%) by Applications (2018-2022)
8 Global Aerospace Landing Gear Development Regional Status and Outlook
8.1 Global Aerospace Landing Gear Revenue (USD Million) By Regions (2018-2022)
8.2 North America Aerospace Landing Gear Revenue (USD Million) by Type, and Application (2018-2022)
8.2.1 North America Aerospace Landing Gear Revenue (USD Million) by Country (2018-2022)
8.2.2 North America Aerospace Landing Gear Revenue (USD Million) by Type (2018-2022)
8.2.3 North America Aerospace Landing Gear Revenue (USD Million) by Applications (2018-2022)
8.3 Europe Aerospace Landing Gear Revenue (USD Million), by Type, and Applications (USD Million) (2018-2022)
8.3.1 Europe Aerospace Landing Gear Revenue (USD Million), by Country (2018-2022)
8.3.2 Europe Aerospace Landing Gear Revenue (USD Million) by Type (2018-2022)
8.3.3 Europe Aerospace Landing Gear Revenue (USD Million) by Applications (2018-2022)
8.4 Asia Pacific Aerospace Landing Gear Revenue (USD Million), and Revenue (USD Million) by Type, and Applications (2018-2022)
8.4.1 Asia Pacific Aerospace Landing Gear Revenue (USD Million) by Country (2018-2022)
8.4.2 Asia Pacific Aerospace Landing Gear Revenue (USD Million) by Type (2018-2022)
8.4.3 Asia Pacific Aerospace Landing Gear Revenue (USD Million) by Applications (2018-2022)
8.5 South America Aerospace Landing Gear Revenue (USD Million), by Type, and Applications (2018-2022)
8.5.1 South America Aerospace Landing Gear Revenue (USD Million), by Country (2018-2022)
8.5.2 South America Aerospace Landing Gear Revenue (USD Million) by Type (2018-2022)
8.5.3 South America Aerospace Landing Gear Revenue (USD Million) by Applications (2018-2022)
8.6 Middle East and Africa Aerospace Landing Gear Revenue (USD Million), by Type, Technology, Application, Thickness (2018-2022)
8.6.1 Middle East and Africa Aerospace Landing Gear Revenue (USD Million) by Country (2018-2022)
8.6.2 Middle East and Africa Aerospace Landing Gear Revenue (USD Million) by Type (2018-2022)
8.6.3 Middle East and Africa Aerospace Landing Gear Revenue (USD Million) by Applications (2018-2022)
9 Company Profiles
10 Global Aerospace Landing Gear Market Revenue (USD Million), by Type, and Applications (2023-2030)
10.1 Global Aerospace Landing Gear Revenue (USD Million) and Market Share (%) by Type (2023-2030)
10.1.1 Global Aerospace Landing Gear Revenue (USD Million), and Market Share (%) by Type (2023-2030)
10.2 Global Aerospace Landing Gear Revenue (USD Million) and Market Share (%) by Applications (2023-2030)
10.2.1 Global Aerospace Landing Gear Revenue (USD Million), and Market Share (%) by Applications (2023-2030)
11 Global Aerospace Landing Gear Development Regional Status and Outlook Forecast
11.1 Global Aerospace Landing Gear Revenue (USD Million) By Regions (2023-2030)
11.2 North America Aerospace Landing Gear Revenue (USD Million) by Type, and Applications (2023-2030)
11.2.1 North America Aerospace Landing Gear Revenue (USD) Million by Country (2023-2030)
11.2.2 North America Aerospace Landing Gear Revenue (USD Million), by Type (2023-2030)
11.2.3 North America Aerospace Landing Gear Revenue (USD Million), Market Share (%) by Applications (2023-2030)
11.3 Europe Aerospace Landing Gear Revenue (USD Million), by Type, and Applications (2023-2030)
11.3.1 Europe Aerospace Landing Gear Revenue (USD Million), by Country (2023-2030)
11.3.2 Europe Aerospace Landing Gear Revenue (USD Million), by Type (2023-2030)
11.3.3 Europe Aerospace Landing Gear Revenue (USD Million), by Applications (2023-2030)
11.4 Asia Pacific Aerospace Landing Gear Revenue (USD Million) by Type, and Applications (2023-2030)
11.4.1 Asia Pacific Aerospace Landing Gear Revenue (USD Million), by Country (2023-2030)
11.4.2 Asia Pacific Aerospace Landing Gear Revenue (USD Million), by Type (2023-2030)
11.4.3 Asia Pacific Aerospace Landing Gear Revenue (USD Million), by Applications (2023-2030)
11.5 South America Aerospace Landing Gear Revenue (USD Million), by Type, and Applications (2023-2030)
11.5.1 South America Aerospace Landing Gear Revenue (USD Million), by Country (2023-2030)
11.5.2 South America Aerospace Landing Gear Revenue (USD Million), by Type (2023-2030)
11.5.3 South America Aerospace Landing Gear Revenue (USD Million), by Applications (2023-2030)
11.6 Middle East and Africa Aerospace Landing Gear Revenue (USD Million), by Type, and Applications (2023-2030)
11.6.1 Middle East and Africa Aerospace Landing Gear Revenue (USD Million), by Region (2023-2030)
11.6.2 Middle East and Africa Aerospace Landing Gear Revenue (USD Million), by Type (2023-2030)
11.6.3 Middle East and Africa Aerospace Landing Gear Revenue (USD Million), by Applications (2023-2030)
12 Methodology and Data Sources
12.1 Methodology/Research Approach
12.1.1 Research Programs/Design
12.1.2 Market Size Estimation
12.1.3 Market Breakdown and Data Triangulation
12.2 Data Sources
12.2.1 Secondary Sources
12.2.2 Primary Sources
12.3 Disclaimer
List of Tables
Table 1 Market Segmentation Analysis
Table 2 Global Aerospace Landing Gear Market Companies with Areas Served
Table 3 Products Offerings Global Aerospace Landing Gear Market
Table 4 Low Growth Scenario Forecasts
Table 5 Reference Case Growth Scenario
Table 6 High Growth Case Scenario
Table 7 Global Aerospace Landing Gear Revenue (USD Million) And CAGR (%) By Type (2018-2030)
Table 8 Global Aerospace Landing Gear Revenue (USD Million) And CAGR (%) By Applications (2018-2030)
Table 9 Global Aerospace Landing Gear Revenue (USD Million) And CAGR (%) By Regions (2018-2030)
Table 10 Global Aerospace Landing Gear Revenue (USD Million) By Type (2018-2022)
Table 11 Global Aerospace Landing Gear Revenue Market Share (%) By Type (2018-2022)
Table 12 Global Aerospace Landing Gear Revenue (USD Million) By Applications (2018-2022)
Table 13 Global Aerospace Landing Gear Revenue Market Share (%) By Applications (2018-2022)
Table 14 Global Aerospace Landing Gear Market Revenue (USD Million) By Regions (2018-2022)
Table 15 Global Aerospace Landing Gear Market Share (%) By Regions (2018-2022)
Table 16 North America Aerospace Landing Gear Revenue (USD Million) By Country (2018-2022)
Table 17 North America Aerospace Landing Gear Revenue (USD Million) By Type (2018-2022)
Table 18 North America Aerospace Landing Gear Revenue (USD Million) By Applications (2018-2022)
Table 19 Europe Aerospace Landing Gear Revenue (USD Million) By Country (2018-2022)
Table 20 Europe Aerospace Landing Gear Revenue (USD Million) By Type (2018-2022)
Table 21 Europe Aerospace Landing Gear Revenue (USD Million) By Applications (2018-2022)
Table 22 Asia Pacific Aerospace Landing Gear Revenue (USD Million) By Country (2018-2022)
Table 23 Asia Pacific Aerospace Landing Gear Revenue (USD Million) By Type (2018-2022)
Table 24 Asia Pacific Aerospace Landing Gear Revenue (USD Million) By Applications (2018-2022)
Table 25 South America Aerospace Landing Gear Revenue (USD Million) By Country (2018-2022)
Table 26 South America Aerospace Landing Gear Revenue (USD Million) By Type (2018-2022)
Table 27 South America Aerospace Landing Gear Revenue (USD Million) By Applications (2018-2022)
Table 28 Middle East and Africa Aerospace Landing Gear Revenue (USD Million) By Region (2018-2022)
Table 29 Middle East and Africa Aerospace Landing Gear Revenue (USD Million) By Type (2018-2022)
Table 30 Middle East and Africa Aerospace Landing Gear Revenue (USD Million) By Applications (2018-2022)
Table 31 Financial Analysis
Table 32 Global Aerospace Landing Gear Revenue (USD Million) By Type (2023-2030)
Table 33 Global Aerospace Landing Gear Revenue Market Share (%) By Type (2023-2030)
Table 34 Global Aerospace Landing Gear Revenue (USD Million) By Applications (2023-2030)
Table 35 Global Aerospace Landing Gear Revenue Market Share (%) By Applications (2023-2030)
Table 36 Global Aerospace Landing Gear Market Revenue (USD Million), And Revenue (USD Million) By Regions (2023-2030)
Table 37 North America Aerospace Landing Gear Revenue (USD)By Country (2023-2030)
Table 38 North America Aerospace Landing Gear Revenue (USD Million) By Type (2023-2030)
Table 39 North America Aerospace Landing Gear Revenue (USD Million) By Applications (2023-2030)
Table 40 Europe Aerospace Landing Gear Revenue (USD Million) By Country (2023-2030)
Table 41 Europe Aerospace Landing Gear Revenue (USD Million) By Type (2023-2030)
Table 42 Europe Aerospace Landing Gear Revenue (USD Million) By Applications (2023-2030)
Table 43 Asia Pacific Aerospace Landing Gear Revenue (USD Million) By Country (2023-2030)
Table 44 Asia Pacific Aerospace Landing Gear Revenue (USD Million) By Type (2023-2030)
Table 45 Asia Pacific Aerospace Landing Gear Revenue (USD Million) By Applications (2023-2030)
Table 46 South America Aerospace Landing Gear Revenue (USD Million) By Country (2023-2030)
Table 47 South America Aerospace Landing Gear Revenue (USD Million) By Type (2023-2030)
Table 48 South America Aerospace Landing Gear Revenue (USD Million) By Applications (2023-2030)
Table 49 Middle East and Africa Aerospace Landing Gear Revenue (USD Million) By Region (2023-2030)
Table 50 Middle East and Africa Aerospace Landing Gear Revenue (USD Million) By Region (2023-2030)
Table 51 Middle East and Africa Aerospace Landing Gear Revenue (USD Million) By Type (2023-2030)
Table 52 Middle East and Africa Aerospace Landing Gear Revenue (USD Million) By Applications (2023-2030)
Table 53 Research Programs/Design for This Report
Table 54 Key Data Information from Secondary Sources
Table 55 Key Data Information from Primary Sources
List of Figures
Figure 1 Market Scope
Figure 2 Porter’s Five Forces
Figure 3 Global Aerospace Landing Gear Revenue (USD Million) By Type (2018-2022)
Figure 4 Global Aerospace Landing Gear Revenue Market Share (%) By Type (2022)
Figure 5 Global Aerospace Landing Gear Revenue (USD Million) By Applications (2018-2022)
Figure 6 Global Aerospace Landing Gear Revenue Market Share (%) By Applications (2022)
Figure 7 Global Aerospace Landing Gear Market Revenue (USD Million) By Regions (2018-2022)
Figure 8 Global Aerospace Landing Gear Market Share (%) By Regions (2022)
Figure 9 North America Aerospace Landing Gear Revenue (USD Million) By Country (2018-2022)
Figure 10 North America Aerospace Landing Gear Revenue (USD Million) By Type (2018-2022)
Figure 11 North America Aerospace Landing Gear Revenue (USD Million) By Applications (2018-2022)
Figure 12 Europe Aerospace Landing Gear Revenue (USD Million) By Country (2018-2022)
Figure 13 Europe Aerospace Landing Gear Revenue (USD Million) By Type (2018-2022)
Figure 14 Europe Aerospace Landing Gear Revenue (USD Million) By Applications (2018-2022)
Figure 15 Asia Pacific Aerospace Landing Gear Revenue (USD Million) By Country (2018-2022)
Figure 16 Asia Pacific Aerospace Landing Gear Revenue (USD Million) By Type (2018-2022)
Figure 17 Asia Pacific Aerospace Landing Gear Revenue (USD Million) By Applications (2018-2022)
Figure 18 South America Aerospace Landing Gear Revenue (USD Million) By Country (2018-2022)
Figure 19 South America Aerospace Landing Gear Revenue (USD Million) By Type (2018-2022)
Figure 20 South America Aerospace Landing Gear Revenue (USD Million) By Applications (2018-2022)
Figure 21 Middle East and Africa Aerospace Landing Gear Revenue (USD Million) By Region (2018-2022)
Figure 22 Middle East and Africa Aerospace Landing Gear Revenue (USD Million) By Type (2018-2022)
Figure 23 Middle East and Africa Aerospace Landing Gear Revenue (USD Million) By Applications (2018-2022)
Figure 24 Global Aerospace Landing Gear Revenue (USD Million) By Type (2023-2030)
Figure 25 Global Aerospace Landing Gear Revenue Market Share (%) By Type (2030)
Figure 26 Global Aerospace Landing Gear Revenue (USD Million) By Applications (2023-2030)
Figure 27 Global Aerospace Landing Gear Revenue Market Share (%) By Applications (2030)
Figure 28 Global Aerospace Landing Gear Market Revenue (USD Million) By Regions (2023-2030)
Figure 29 North America Aerospace Landing Gear Revenue (USD Million) By Country (2023-2030)
Figure 30 North America Aerospace Landing Gear Revenue (USD Million) By Type (2023-2030)
Figure 31 North America Aerospace Landing Gear Revenue (USD Million) By Applications (2023-2030)
Figure 32 Europe Aerospace Landing Gear Revenue (USD Million) By Country (2023-2030)
Figure 33 Europe Aerospace Landing Gear Revenue (USD Million) By Type (2023-2030)
Figure 34 Europe Aerospace Landing Gear Revenue (USD Million) By Applications (2023-2030)
Figure 35 Asia Pacific Aerospace Landing Gear Revenue (USD Million) By Country (2023-2030)
Figure 36 Asia Pacific Aerospace Landing Gear Revenue (USD Million) By Type (2023-2030)
Figure 37 Asia Pacific Aerospace Landing Gear Revenue (USD Million) By Applications (2023-2030)
Figure 38 South America Aerospace Landing Gear Revenue (USD Million) By Country (2023-2030)
Figure 39 South America Aerospace Landing Gear Revenue (USD Million) By Type (2023-2030)
Figure 40 South America Aerospace Landing Gear Revenue (USD Million) By Applications (2023-2030)
Figure 41 Middle East and Africa Aerospace Landing Gear Revenue (USD Million) By Region (2023-2030)
Figure 42 Middle East and Africa Aerospace Landing Gear Revenue (USD Million) By Region (2023-2030)
Figure 43 Middle East and Africa Aerospace Landing Gear Revenue (USD Million) By Type (2023-2030)
Figure 44 Middle East and Africa Aerospace Landing Gear Revenue (USD Million) By Applications (2023-2030)
Figure 45 Bottom-Up and Top-Down Approaches For This Report
Figure 46 Data Triangulation
