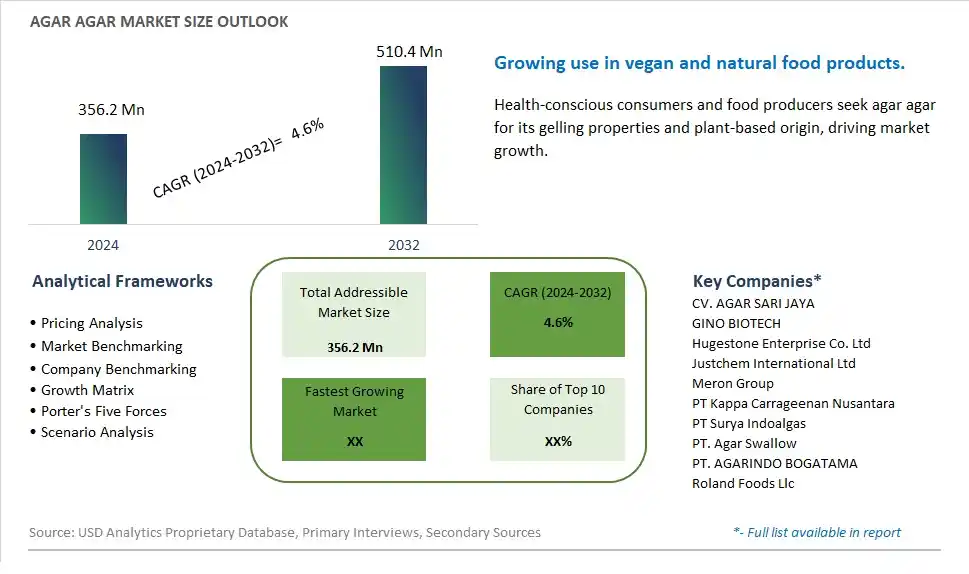
Global Agar Agar Market Size is valued at $356.2 Million in 2024 and is forecast to register a growth rate (CAGR) of 4.6% to reach $510.4 Million by 2032.
The global Agar Agar Market Comprehensive Study analyzes and forecasts the market size across 6 regions and 24 countries for diverse segments -By Form (Flakes, Powder, Others), By Application (Food & Beverages, Pharmaceuticals, Nutraceuticals, Others)
An Introduction to Agar Agar Market
In 2024, the Agar Agar market is seeing substantial growth, driven by its versatile applications in the food, pharmaceutical, and biotechnology industries. Agar agar, derived from red algae, is widely used as a gelling agent, thickener, and stabilizer in various products, including desserts, jellies, and microbiological media. The market is benefiting from the increasing demand for plant-based and natural ingredients, as well as the growing trend towards vegan and vegetarian diets. Advances in extraction and processing technologies are enhancing product quality and expanding its application scope, further boosting market growth.
Agar Agar Competitive Landscape
The market report analyses the leading companies in the industry including CV. AGAR SARI JAYA, GINO BIOTECH, Hugestone Enterprise Co. Ltd, Justchem International Ltd, Meron Group, PT Kappa Carrageenan Nusantara, PT Surya Indoalgas, PT. Agar Swallow, PT. AGARINDO BOGATAMA, Roland Foods Llc, and Others.
Agar Agar Market Dynamics
Agar Agar Market Trend: Increasing Demand for Plant-Based and Natural Ingredients
The market for agar agar is witnessing a significant trend towards the increasing demand for plant-based and natural ingredients. Consumers are becoming more health-conscious and environmentally aware, leading to a growing preference for plant-derived products over animal-based counterparts. Agar agar, a natural gelatin substitute derived from seaweed, fits perfectly into this trend. It is widely used in various applications such as vegan desserts, jellies, and as a thickening agent in soups and sauces. The clean label movement, which emphasizes transparency and natural ingredients, further drives the popularity of agar agar as a versatile and natural food additive.
Agar Agar Market Driver: Growth in the Vegan and Vegetarian Population
The primary driver for the agar agar market is the growth in the vegan and vegetarian population. As more people adopt plant-based diets for health, ethical, and environmental reasons, the demand for vegan alternatives to animal-derived products is rising. Agar agar serves as an excellent substitute for gelatin, which is made from animal collagen, making it highly attractive to vegans and vegetarians. This demographic shift is supported by increasing awareness of the benefits of plant-based eating and the availability of a wider variety of vegan products in the market. Additionally, the growing popularity of flexitarian diets, where consumers reduce their meat consumption without fully committing to a vegetarian lifestyle, is also boosting the demand for agar agar.
Agar Agar Market Opportunity: Expansion in the Food and Beverage Industry
A significant opportunity for the agar agar market lies in its expansion within the food and beverage industry. The versatility of agar agar as a gelling, thickening, and stabilizing agent makes it suitable for a wide range of culinary applications. There is potential to innovate and develop new product lines, such as vegan confectioneries, dairy-free desserts, and functional foods that leverage the unique properties of agar agar. Collaborations with food manufacturers to create specialty products can enhance market penetration. Additionally, expanding into emerging markets where plant-based eating is gaining traction can drive growth. Effective marketing strategies that highlight the health benefits and natural origins of agar agar can attract health-conscious consumers and expand its market reach.
Agar Agar Market Share Analysis: Powder segment generated the highest revenue share in the industry
The Powder segment is the largest in the Agar Agar Market by form. This segment's prominence is due to the convenience, versatility, and ease of use that powdered agar agar offers in various applications. Powdered agar agar dissolves quickly and uniformly, making it ideal for use in the food industry for gelling, thickening, and stabilizing purposes. It is widely used in confectionery, dairy products, bakery items, and beverages due to its superior ability to create smooth and consistent textures. Additionally, powdered agar agar is favored in the laboratory and biotechnology sectors for its precision and reliability in microbiological media. The long shelf life and easy storage of powdered agar further contribute to its leading position in the market.
Agar Agar Market Share Analysis: Nutraceuticals is the fastest growing segment over the forecast period to 2032
The Nutraceuticals segment within the Agar Agar Market is projected to be the fastest growing segment by 2032. This rapid growth is driven by the increasing consumer awareness of the health benefits associated with agar agar, such as its high fiber content, natural origin, and functional properties like prebiotic effects. Agar agar is increasingly being used in dietary supplements, weight management products, and functional foods due to its ability to aid digestion, promote satiety, and support overall gut health. The rising trend towards natural and plantbased ingredients in the nutraceutical industry further fuels the demand for agar agar. Additionally, the growing focus on preventive healthcare and the popularity of health and wellness products contribute to the expansion of this segment. As consumers continue to prioritize healthconscious choices and seek out functional ingredients, the nutraceuticals segment is expected to experience substantial growth, making it the fastest growing application area for agar agar through 2032.
Agar Agar Market Segmentation
By Form
Flakes
Powder
Others
By Application
Food & Beverages
Pharmaceuticals
Nutraceuticals
Others
Countries Analyzed
North America (US, Canada, Mexico)
Europe (Germany, UK, France, Spain, Italy, Russia, Rest of Europe)
Asia Pacific (China, India, Japan, South Korea, Australia, South East Asia, Rest of Asia)
South America (Brazil, Argentina, Rest of South America)
Middle East and Africa (Saudi Arabia, UAE, Rest of Middle East, South Africa, Egypt, Rest of Africa)
Agar Agar Companies Profiled in the Study
CV. AGAR SARI JAYA
GINO BIOTECH
Hugestone Enterprise Co. Ltd
Justchem International Ltd
Meron Group
PT Kappa Carrageenan Nusantara
PT Surya Indoalgas
PT. Agar Swallow
PT. AGARINDO BOGATAMA
Roland Foods Llc
*- List Not Exhaustive
Chapter 1. TABLE OF CONTENTS
Chapter 2. Introduction to Agar Agar Market
2.1. Market Overview
2.2. Key Statistics and Report Highlights
2.3. Scope of the Comprehensive Study
2.3.1. Market Definition
2.3.2 Countries and Regions Covered
2.3.3 Research Objective
2.3.4 Units, Currency, and Conversions
2.3.5 Industry Value Chain
2.4. Key Market Segments
2.5. Key Companies
2.6. Study Period
Chapter 3. Strategic Analysis Review
3.1. Agar Agar Pricing Analysis and Forecast
3.2. Porter’s Five Forces
3.3. Market Ecosystem
3.4. SWOT Analysis
3.5. Regulatory Scenario
3.3. Effects of Inflation, Russia-Ukraine War, moderating economic growth, and other macroeconomic factors
Chapter 4. Competitive Landscape
4.1. Market Share Analysis
4.1.1. Global Agar Agar Market Share by Company, 2023
4.1.2. Product Offerings of Leading Agar Agar Companies
4.2. Market Entropy
4.2.1. New Product Launches in the Industry
4.2.2. Mergers, Acquisitions, Joint ventures, and Partnerships
4.3. Key Strategies and Best Practices
Chapter 5. Global Market Projections: Best, Reference, and Low Case Scenarios
5.1. Growth Analysis- Case Scenario Definitions
5.2. Low Growth Case Scenario Forecasts
5.3. Reference Growth Case Scenario Forecasts
5.4. High Growth Case Scenario Forecasts
Chapter 6. Market Dynamics
6.1. Agar Agar Market Drivers
6.2. Agar Agar Market Challenges
6.6. Agar Agar Market Opportunities
6.4. Agar Agar Market Trends
Chapter 7. Global Agar Agar Market Outlook Trends
7.1. Global Agar Agar Revenue (USD Million) and CAGR (%) by Type (2021-2032)
7.2. Global Agar Agar Revenue (USD Million) and CAGR (%) by Application (2021-2032)
7.3. Global Agar Agar Revenue (USD Million) and CAGR (%) by Product (2021-2032)
By Form
Flakes
Powder
Others
By Application
Food & Beverages
Pharmaceuticals
Nutraceuticals
Others
Chapter 8. Global Agar Agar Regional Analysis and Outlook
8.1. Global Agar Agar Revenue (USD Million) By Regions (2021- 2032)
8.2. North America Agar Agar Revenue (USD Million) by Country (2021-2032)
8.2.1. United States Agar Agar Regional Analysis and Outlook
8.2.2. Canada Agar Agar Regional Analysis and Outlook
8.2.3. Mexico Agar Agar Regional Analysis and Outlook
8.3. Europe Agar Agar Revenue (USD Million), by Country (2021-2032)
8.3.1. Germany Agar Agar Regional Analysis and Outlook
8.3.2. France Agar Agar Regional Analysis and Outlook
8.3.3. United Kingdom Agar Agar Regional Analysis and Outlook
8.3.4. Spain Agar Agar Regional Analysis and Outlook
8.3.5. Italy Agar Agar Regional Analysis and Outlook
8.3.6. Russia Agar Agar Regional Analysis and Outlook
8.3.7. Rest of Europe Agar Agar Regional Analysis and Outlook
8.4. Asia Pacific Agar Agar Revenue (USD Million) by Country (2021-2032)
8.4.1. China Agar Agar Regional Analysis and Outlook
8.4.2. Japan Agar Agar Regional Analysis and Outlook
8.4.3. India Agar Agar Regional Analysis and Outlook
8.4.4. South Korea Agar Agar Regional Analysis and Outlook
8.4.5. Australia Agar Agar Regional Analysis and Outlook
8.4.6. South East Asia Agar Agar Regional Analysis and Outlook
8.4.7. Rest of Asia Pacific Agar Agar Regional Analysis and Outlook
8.5. South America Agar Agar Revenue (USD Million), by Country (2021-2032)
8.5.1. Brazil Agar Agar Regional Analysis and Outlook
8.5.2. Argentina Agar Agar Regional Analysis and Outlook
8.5.3. Rest of South America Agar Agar Regional Analysis and Outlook
8.6. Middle East and Africa Agar Agar Revenue (USD Million) by Country (2021-2032)
8.6.1. Middle East Agar Agar Regional Analysis and Outlook
8.6.2. Africa Agar Agar Regional Analysis and Outlook
Chapter 9. North America Agar Agar Analysis and Outlook
9.1. North America Agar Agar Revenue (USD Million) by Segments (2021-2032)
9.1.1. North America Agar Agar Revenue (USD Million) by Type (2021-2032)
9.1.2. North America Agar Agar Revenue (USD Million) by Application (2021-2032)
9.1.3. North America Agar Agar Revenue (USD Million) by Product (2021-2032)
By Form
Flakes
Powder
Others
By Application
Food & Beverages
Pharmaceuticals
Nutraceuticals
Others
Chapter 10. Europe Agar Agar Analysis and Outlook
10.1. Europe Agar Agar Revenue (USD Million), by Segments (USD Million) (2021-2032)
10.1.1. Europe Agar Agar Revenue (USD Million) by Type (2021-2032)
10.1.2. Europe Agar Agar Revenue (USD Million) by Application (2021-2032)
10.1.3. Europe Agar Agar Revenue (USD Million) by Product (2021-2032)
By Form
Flakes
Powder
Others
By Application
Food & Beverages
Pharmaceuticals
Nutraceuticals
Others
Chapter 11. Asia Pacific Agar Agar Analysis and Outlook
11.1. Asia Pacific Agar Agar Revenue (USD Million), and Revenue (USD Million) by Segments (2021-2032)
11.1.1. Asia Pacific Agar Agar Revenue (USD Million) by Type (2021-2032)
11.1.2. Asia Pacific Agar Agar Revenue (USD Million) by Application (2021-2032)
11.1.3. Asia Pacific Agar Agar Revenue (USD Million) by Product (2021-2032)
By Form
Flakes
Powder
Others
By Application
Food & Beverages
Pharmaceuticals
Nutraceuticals
Others
Chapter 12. South America Agar Agar Analysis and Outlook
12.1. South America Agar Agar Revenue (USD Million), by Segments (2021-2032)
12.1.1. South America Agar Agar Revenue (USD Million) by Type (2021-2032)
12.1.2. South America Agar Agar Revenue (USD Million) by Application (2021-2032)
12.1.3. South America Agar Agar Revenue (USD Million) by Product (2021-2032)
By Form
Flakes
Powder
Others
By Application
Food & Beverages
Pharmaceuticals
Nutraceuticals
Others
Chapter 13. Middle East and Africa Agar Agar Analysis and Outlook
13.1. Middle East and Africa Agar Agar Revenue (USD Million), by Segments (2021-2032)
13.1.1. Middle East and Africa Agar Agar Revenue (USD Million) by Type (2021-2032)
13.1.2. Middle East and Africa Agar Agar Revenue (USD Million) by Application (2021-2032)
13.1.3. Middle East and Africa Agar Agar Revenue (USD Million) by Product (2021-2032)
By Form
Flakes
Powder
Others
By Application
Food & Beverages
Pharmaceuticals
Nutraceuticals
Others
Chapter 14. Agar Agar Company Profiles
14.1 Business Overview
14.2 Product Profiles
14.3 SWOT Profiles
14.5 Recent Developments
14.6 Financial Profile
List of Companies
CV. AGAR SARI JAYA
GINO BIOTECH
Hugestone Enterprise Co. Ltd
Justchem International Ltd
Meron Group
PT Kappa Carrageenan Nusantara
PT Surya Indoalgas
PT. Agar Swallow
PT. AGARINDO BOGATAMA
Roland Foods Llc
15. Methodology and Data Sources
15.1 Customization Offerings
15.2 Subscription Services
15.3 Related Reports
15.4 Publisher Expertise
LIST OF TABLES
Table 1 Market Segmentation Analysis
Table 2 Global Agar Agar Market Share of Leading Companies, 2023
Table 3 Product Offerings of Leading Companies
Table 4 Low Growth Scenario Forecasts
Table 5 Reference Case Growth Scenario
Table 6 High Growth Case Scenario
Table 7 Global Agar Agar Revenue (USD Million) And CAGR (%) By Type (2021-2032)
Table 8 Global Agar Agar Revenue (USD Million) And CAGR (%) By Application (2021-2032)
Table 9 Global Agar Agar Revenue (USD Million) And CAGR (%) By Product (2021-2032)
Table 10 Global Agar Agar Market Revenue (USD Million) By Regions (2021-2032)
Table 11 Global Agar Agar Market Share (%) By Regions (2021-2032)
Table 12 North America Agar Agar Revenue (USD Million) By Country (2021-2032)
Table 13 Europe Agar Agar Revenue (USD Million) By Country (2021-2032)
Table 14 Asia Pacific Agar Agar Revenue (USD Million) By Country (2021-2032)
Table 15 South America Agar Agar Revenue (USD Million) By Country (2021-2032)
Table 16 Middle East and Africa Agar Agar Revenue (USD Million) By Region (2021-2032)
Table 17 North America Agar Agar Revenue (USD Million) By Type (2021-2032)
Table 18 North America Agar Agar Revenue (USD Million) By Application (2021-2032)
Table 19 North America Agar Agar Revenue (USD Million) By Product (2021-2032)
Table 20 Europe Agar Agar Revenue (USD Million) By Type (2021-2032)
Table 21 Europe Agar Agar Revenue (USD Million) By Application (2021-2032)
Table 22 Europe Agar Agar Revenue (USD Million) By Product (2021-2032)
Table 23 Asia Pacific Agar Agar Revenue (USD Million) By Type (2021-2032)
Table 24 Asia Pacific Agar Agar Revenue (USD Million) By Application (2021-2032)
Table 25 Asia Pacific Agar Agar Revenue (USD Million) By Product (2021-2032)
Table 26 South America Agar Agar Revenue (USD Million) By Type (2021-2032)
Table 27 South America Agar Agar Revenue (USD Million) By Application (2021-2032)
Table 28 South America Agar Agar Revenue (USD Million) By Product (2021-2032)
Table 29 Middle East and Africa Agar Agar Revenue (USD Million) By Type (2021-2032)
Table 30 Middle East and Africa Agar Agar Revenue (USD Million) By Application (2021-2032)
Table 31 Middle East and Africa Agar Agar Revenue (USD Million) By Product (2021-2032)
LIST OF FIGURES
Figure 1. Market Scope
Figure 2. Pricing Forecasts Per Unit, 2023- 2032
Figure 3. Porter’s Five Forces
Figure 4. Global Agar Agar Market Revenue (USD Million) By Regions (2021-2032)
Figure 5. Global Agar Agar Market Share (%) By Regions (2023)
Figure 6. North America Agar Agar Revenue (USD Million) By Country (2021-2032)
Figure 7. United States Agar Agar Revenue (USD Million) By Country (2021-2032)
Figure 8. Canada Agar Agar Revenue (USD Million) By Country (2021-2032)
Figure 9. Mexico Agar Agar Revenue (USD Million) By Country (2021-2032)
Figure 10. Europe Agar Agar Revenue (USD Million) By Country (2021-2032)
Figure 11. Germany Agar Agar Revenue (USD Million) By Country (2021-2032)
Figure 12. France Agar Agar Revenue (USD Million) By Country (2021-2032)
Figure 13. United Kingdom Agar Agar Revenue (USD Million) By Country (2021-2032)
Figure 14. Spain Agar Agar Revenue (USD Million) By Country (2021-2032)
Figure 15. Italy Agar Agar Revenue (USD Million) By Country (2021-2032)
Figure 16. Russia Agar Agar Revenue (USD Million) By Country (2021-2032)
Figure 17. Rest of Europe Agar Agar Revenue (USD Million) By Country (2021-2032)
Figure 11. Asia Pacific Agar Agar Revenue (USD Million) By Country (2021-2032)
Figure 12. China Agar Agar Revenue (USD Million) By Country (2021-2032)
Figure 13. Japan Agar Agar Revenue (USD Million) By Country (2021-2032)
Figure 14. India Agar Agar Revenue (USD Million) By Country (2021-2032)
Figure 15. South Korea Agar Agar Revenue (USD Million) By Country (2021-2032)
Figure 16. Australia Agar Agar Revenue (USD Million) By Country (2021-2032)
Figure 17. South East Asia Agar Agar Revenue (USD Million) By Country (2021-2032)
Figure 18. South America Agar Agar Revenue (USD Million) By Country (2021-2032)
Figure 19. Brazil Agar Agar Revenue (USD Million) By Country (2021-2032)
Figure 20. Argentina Agar Agar Revenue (USD Million) By Country (2021-2032)
Figure 21. Rest of Asia Pacific Agar Agar Revenue (USD Million) By Country (2021-2032)
Figure 22. Middle East and Africa Agar Agar Revenue (USD Million) By Region (2021-2032)
Figure 23. Saudi Arabia Agar Agar Revenue (USD Million) By Region (2021-2032)
Figure 24. The UAE Agar Agar Revenue (USD Million) By Region (2021-2032)
Figure 25. Rest of Middle East Agar Agar Revenue (USD Million) By Region (2021-2032)
Figure 26. South Africa Agar Agar Revenue (USD Million) By Region (2021-2032)
Figure 27. Africa Agar Agar Revenue (USD Million) By Region (2021-2032)
Figure 28. North America Agar Agar Revenue (USD Million) By Type (2021-2032)
Figure 29. North America Agar Agar Revenue (USD Million) By Application (2021-2032)
Figure 30. North America Agar Agar Revenue (USD Million) By Product (2021-2032)
Figure 31. Europe Agar Agar Revenue (USD Million) By Type (2021-2032)
Figure 32. Europe Agar Agar Revenue (USD Million) By Application (2021-2032)
Figure 33. Europe Agar Agar Revenue (USD Million) By Product (2021-2032)
Figure 34. Asia Pacific Agar Agar Revenue (USD Million) By Type (2021-2032)
Figure 35. Asia Pacific Agar Agar Revenue (USD Million) By Application (2021-2032)
Figure 36. Asia Pacific Agar Agar Revenue (USD Million) By Product (2021-2032)
Figure 37. South America Agar Agar Revenue (USD Million) By Type (2021-2032)
Figure 38. South America Agar Agar Revenue (USD Million) By Application (2021-2032)
Figure 39. South America Agar Agar Revenue (USD Million) By Product (2021-2032)
Figure 40. Middle East and Africa Agar Agar Revenue (USD Million) By Type (2021-2032)
Figure 41. Middle East and Africa Agar Agar Revenue (USD Million) By Application (2021-2032)
Figure 42. Middle East and Africa Agar Agar Revenue (USD Million) By Product (2021-2032)
By Form
Flakes
Powder
Others
By Application
Food & Beverages
Pharmaceuticals
Nutraceuticals
Others
Countries Analyzed
North America (US, Canada, Mexico)
Europe (Germany, UK, France, Spain, Italy, Russia, Rest of Europe)
Asia Pacific (China, India, Japan, South Korea, Australia, South East Asia, Rest of Asia)
South America (Brazil, Argentina, Rest of South America)
Middle East and Africa (Saudi Arabia, UAE, Rest of Middle East, South Africa, Egypt, Rest of Africa)
