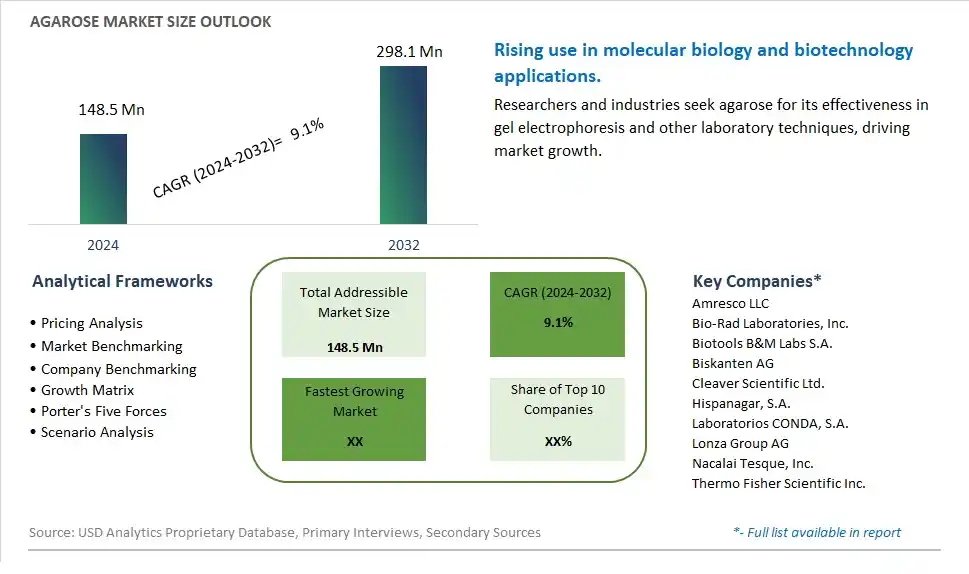
Global Agarose Market Size is valued at $148.5 Million in 2024 and is forecast to register a growth rate (CAGR) of 9.1% to reach $298.1 Million by 2032.
The global Agarose Market Comprehensive Study analyzes and forecasts the market size across 6 regions and 24 countries for diverse segments -By Type (Low Melting Point, Standard Melting, Others), By Application (Protein Purification, Agarose Gel Electrophoresis, Others)
An Introduction to Agarose Market
The Agarose market in 2024 is experiencing robust growth, driven by its critical applications in molecular biology, biochemistry, and clinical diagnostics. Agarose, a polysaccharide derived from agar, is essential for gel electrophoresis and other analytical techniques used in DNA, RNA, and protein studies. The market is benefiting from the increasing demand for advanced biotechnological research and diagnostic tools. Innovations in agarose formulations and the development of high-purity grades are enhancing performance and reliability in various applications, making it a vital component in research laboratories and clinical settings worldwide.
Agarose Competitive Landscape
The market report analyses the leading companies in the industry including Amresco LLC, Bio-Rad Laboratories, Inc., Biotools B&M Labs S.A., Biskanten AG, Cleaver Scientific Ltd., Hispanagar, S.A., Laboratorios CONDA, S.A., Lonza Group AG, Nacalai Tesque, Inc., Thermo Fisher Scientific Inc., and Others.
Agarose Market Dynamics
Agarose Market Trend: Increasing Application in Molecular Biology and Biotechnology
The market for agarose is witnessing a significant trend towards its increasing application in molecular biology and biotechnology. Agarose, a purified form of agar, is extensively used in gel electrophoresis for DNA, RNA, and protein separation due to its high gel strength and ease of use. With advancements in genetic research, personalized medicine, and diagnostic techniques, the demand for high-quality agarose is rising. This trend is further driven by the growing number of research activities in academic institutions, pharmaceutical companies, and biotechnology firms that rely on agarose gels for various applications, including genome mapping, gene cloning, and forensic analysis.
Agarose Market Driver: Growth in Genomics and Proteomics Research
The primary driver for the agarose market is the growth in genomics and proteomics research. The increasing focus on understanding genetic and protein functions to develop new therapies and diagnostic tools is propelling the demand for agarose. Research initiatives aimed at decoding the human genome, studying disease mechanisms, and developing targeted treatments require reliable and efficient gel electrophoresis methods, in which agarose plays a critical role. Additionally, the rise in funding for life sciences research and the establishment of new research centers worldwide are contributing to the increased use of agarose in scientific studies. The continuous advancements in molecular biology techniques are further enhancing the utilization of agarose in laboratories.
Agarose Market Opportunity: Expansion into Emerging Markets and Customized Products
A significant opportunity for the agarose market lies in expansion into emerging markets and the development of customized products. As emerging economies invest in biotechnology and life sciences research infrastructure, there is a growing demand for high-quality research consumables like agarose. Establishing a strong presence in these regions through local distribution networks and partnerships with research institutions can drive market growth. Additionally, there is potential to develop customized agarose products tailored to specific research needs, such as low-melt agarose for in-gel applications or specialized agarose formulations for improved resolution and separation. By addressing the unique requirements of different research fields and providing targeted solutions, manufacturers can capture new market segments and enhance their competitive edge.
Agarose Market Share Analysis: Agarose Gel Electrophoresis is the fastest growing segment over the forecast period to 2032
The Agarose Gel Electrophoresis segment within the Agarose Market is projected to be the fastest growing segment by 2032. This rapid growth is driven by the increasing demand for molecular biology and genetic research, where agarose gel electrophoresis is a fundamental technique used for DNA, RNA, and protein separation and analysis. The ongoing advancements in biotechnology and the growing focus on genomics and proteomics research are propelling the use of agarose gels in laboratories worldwide. Additionally, the rise in research activities related to disease diagnostics, drug development, and personalized medicine further boosts the demand for agarose gel electrophoresis. The continuous development of new electrophoresis techniques and equipment that enhance the efficiency and resolution of agarose gels also contributes to this segment's growth. As the life sciences and biotechnology fields continue to expand, the agarose gel electrophoresis segment is expected to see substantial growth, making it the fastest growing application area for agarose through 2032.
Agarose Market Segmentation
By Type
Low Melting Point
Standard Melting
Others
By Application
Protein Purification
Agarose Gel Electrophoresis
Others
Countries Analyzed
North America (US, Canada, Mexico)
Europe (Germany, UK, France, Spain, Italy, Russia, Rest of Europe)
Asia Pacific (China, India, Japan, South Korea, Australia, South East Asia, Rest of Asia)
South America (Brazil, Argentina, Rest of South America)
Middle East and Africa (Saudi Arabia, UAE, Rest of Middle East, South Africa, Egypt, Rest of Africa)
Agarose Companies Profiled in the Study
Amresco LLC
Bio-Rad Laboratories, Inc.
Biotools B&M Labs S.A.
Biskanten AG
Cleaver Scientific Ltd.
Hispanagar, S.A.
Laboratorios CONDA, S.A.
Lonza Group AG
Nacalai Tesque, Inc.
Thermo Fisher Scientific Inc.
*- List Not Exhaustive
Chapter 1. TABLE OF CONTENTS
Chapter 2. Introduction to Agarose Market
2.1. Market Overview
2.2. Key Statistics and Report Highlights
2.3. Scope of the Comprehensive Study
2.3.1. Market Definition
2.3.2 Countries and Regions Covered
2.3.3 Research Objective
2.3.4 Units, Currency, and Conversions
2.3.5 Industry Value Chain
2.4. Key Market Segments
2.5. Key Companies
2.6. Study Period
Chapter 3. Strategic Analysis Review
3.1. Agarose Pricing Analysis and Forecast
3.2. Porter’s Five Forces
3.3. Market Ecosystem
3.4. SWOT Analysis
3.5. Regulatory Scenario
3.3. Effects of Inflation, Russia-Ukraine War, moderating economic growth, and other macroeconomic factors
Chapter 4. Competitive Landscape
4.1. Market Share Analysis
4.1.1. Global Agarose Market Share by Company, 2023
4.1.2. Product Offerings of Leading Agarose Companies
4.2. Market Entropy
4.2.1. New Product Launches in the Industry
4.2.2. Mergers, Acquisitions, Joint ventures, and Partnerships
4.3. Key Strategies and Best Practices
Chapter 5. Global Market Projections: Best, Reference, and Low Case Scenarios
5.1. Growth Analysis- Case Scenario Definitions
5.2. Low Growth Case Scenario Forecasts
5.3. Reference Growth Case Scenario Forecasts
5.4. High Growth Case Scenario Forecasts
Chapter 6. Market Dynamics
6.1. Agarose Market Drivers
6.2. Agarose Market Challenges
6.6. Agarose Market Opportunities
6.4. Agarose Market Trends
Chapter 7. Global Agarose Market Outlook Trends
7.1. Global Agarose Revenue (USD Million) and CAGR (%) by Type (2021-2032)
7.2. Global Agarose Revenue (USD Million) and CAGR (%) by Application (2021-2032)
7.3. Global Agarose Revenue (USD Million) and CAGR (%) by Product (2021-2032)
By Type
Low Melting Point
Standard Melting
Others
By Application
Protein Purification
Agarose Gel Electrophoresis
Others
Chapter 8. Global Agarose Regional Analysis and Outlook
8.1. Global Agarose Revenue (USD Million) By Regions (2021- 2032)
8.2. North America Agarose Revenue (USD Million) by Country (2021-2032)
8.2.1. United States Agarose Regional Analysis and Outlook
8.2.2. Canada Agarose Regional Analysis and Outlook
8.2.3. Mexico Agarose Regional Analysis and Outlook
8.3. Europe Agarose Revenue (USD Million), by Country (2021-2032)
8.3.1. Germany Agarose Regional Analysis and Outlook
8.3.2. France Agarose Regional Analysis and Outlook
8.3.3. United Kingdom Agarose Regional Analysis and Outlook
8.3.4. Spain Agarose Regional Analysis and Outlook
8.3.5. Italy Agarose Regional Analysis and Outlook
8.3.6. Russia Agarose Regional Analysis and Outlook
8.3.7. Rest of Europe Agarose Regional Analysis and Outlook
8.4. Asia Pacific Agarose Revenue (USD Million) by Country (2021-2032)
8.4.1. China Agarose Regional Analysis and Outlook
8.4.2. Japan Agarose Regional Analysis and Outlook
8.4.3. India Agarose Regional Analysis and Outlook
8.4.4. South Korea Agarose Regional Analysis and Outlook
8.4.5. Australia Agarose Regional Analysis and Outlook
8.4.6. South East Asia Agarose Regional Analysis and Outlook
8.4.7. Rest of Asia Pacific Agarose Regional Analysis and Outlook
8.5. South America Agarose Revenue (USD Million), by Country (2021-2032)
8.5.1. Brazil Agarose Regional Analysis and Outlook
8.5.2. Argentina Agarose Regional Analysis and Outlook
8.5.3. Rest of South America Agarose Regional Analysis and Outlook
8.6. Middle East and Africa Agarose Revenue (USD Million) by Country (2021-2032)
8.6.1. Middle East Agarose Regional Analysis and Outlook
8.6.2. Africa Agarose Regional Analysis and Outlook
Chapter 9. North America Agarose Analysis and Outlook
9.1. North America Agarose Revenue (USD Million) by Segments (2021-2032)
9.1.1. North America Agarose Revenue (USD Million) by Type (2021-2032)
9.1.2. North America Agarose Revenue (USD Million) by Application (2021-2032)
9.1.3. North America Agarose Revenue (USD Million) by Product (2021-2032)
By Type
Low Melting Point
Standard Melting
Others
By Application
Protein Purification
Agarose Gel Electrophoresis
Others
Chapter 10. Europe Agarose Analysis and Outlook
10.1. Europe Agarose Revenue (USD Million), by Segments (USD Million) (2021-2032)
10.1.1. Europe Agarose Revenue (USD Million) by Type (2021-2032)
10.1.2. Europe Agarose Revenue (USD Million) by Application (2021-2032)
10.1.3. Europe Agarose Revenue (USD Million) by Product (2021-2032)
By Type
Low Melting Point
Standard Melting
Others
By Application
Protein Purification
Agarose Gel Electrophoresis
Others
Chapter 11. Asia Pacific Agarose Analysis and Outlook
11.1. Asia Pacific Agarose Revenue (USD Million), and Revenue (USD Million) by Segments (2021-2032)
11.1.1. Asia Pacific Agarose Revenue (USD Million) by Type (2021-2032)
11.1.2. Asia Pacific Agarose Revenue (USD Million) by Application (2021-2032)
11.1.3. Asia Pacific Agarose Revenue (USD Million) by Product (2021-2032)
By Type
Low Melting Point
Standard Melting
Others
By Application
Protein Purification
Agarose Gel Electrophoresis
Others
Chapter 12. South America Agarose Analysis and Outlook
12.1. South America Agarose Revenue (USD Million), by Segments (2021-2032)
12.1.1. South America Agarose Revenue (USD Million) by Type (2021-2032)
12.1.2. South America Agarose Revenue (USD Million) by Application (2021-2032)
12.1.3. South America Agarose Revenue (USD Million) by Product (2021-2032)
By Type
Low Melting Point
Standard Melting
Others
By Application
Protein Purification
Agarose Gel Electrophoresis
Others
Chapter 13. Middle East and Africa Agarose Analysis and Outlook
13.1. Middle East and Africa Agarose Revenue (USD Million), by Segments (2021-2032)
13.1.1. Middle East and Africa Agarose Revenue (USD Million) by Type (2021-2032)
13.1.2. Middle East and Africa Agarose Revenue (USD Million) by Application (2021-2032)
13.1.3. Middle East and Africa Agarose Revenue (USD Million) by Product (2021-2032)
By Type
Low Melting Point
Standard Melting
Others
By Application
Protein Purification
Agarose Gel Electrophoresis
Others
Chapter 14. Agarose Company Profiles
14.1 Business Overview
14.2 Product Profiles
14.3 SWOT Profiles
14.5 Recent Developments
14.6 Financial Profile
List of Companies
Amresco LLC
Bio-Rad Laboratories, Inc.
Biotools B&M Labs S.A.
Biskanten AG
Cleaver Scientific Ltd.
Hispanagar, S.A.
Laboratorios CONDA, S.A.
Lonza Group AG
Nacalai Tesque, Inc.
Thermo Fisher Scientific Inc.
15. Methodology and Data Sources
15.1 Customization Offerings
15.2 Subscription Services
15.3 Related Reports
15.4 Publisher Expertise
LIST OF TABLES
Table 1 Market Segmentation Analysis
Table 2 Global Agarose Market Share of Leading Companies, 2023
Table 3 Product Offerings of Leading Companies
Table 4 Low Growth Scenario Forecasts
Table 5 Reference Case Growth Scenario
Table 6 High Growth Case Scenario
Table 7 Global Agarose Revenue (USD Million) And CAGR (%) By Type (2021-2032)
Table 8 Global Agarose Revenue (USD Million) And CAGR (%) By Application (2021-2032)
Table 9 Global Agarose Revenue (USD Million) And CAGR (%) By Product (2021-2032)
Table 10 Global Agarose Market Revenue (USD Million) By Regions (2021-2032)
Table 11 Global Agarose Market Share (%) By Regions (2021-2032)
Table 12 North America Agarose Revenue (USD Million) By Country (2021-2032)
Table 13 Europe Agarose Revenue (USD Million) By Country (2021-2032)
Table 14 Asia Pacific Agarose Revenue (USD Million) By Country (2021-2032)
Table 15 South America Agarose Revenue (USD Million) By Country (2021-2032)
Table 16 Middle East and Africa Agarose Revenue (USD Million) By Region (2021-2032)
Table 17 North America Agarose Revenue (USD Million) By Type (2021-2032)
Table 18 North America Agarose Revenue (USD Million) By Application (2021-2032)
Table 19 North America Agarose Revenue (USD Million) By Product (2021-2032)
Table 20 Europe Agarose Revenue (USD Million) By Type (2021-2032)
Table 21 Europe Agarose Revenue (USD Million) By Application (2021-2032)
Table 22 Europe Agarose Revenue (USD Million) By Product (2021-2032)
Table 23 Asia Pacific Agarose Revenue (USD Million) By Type (2021-2032)
Table 24 Asia Pacific Agarose Revenue (USD Million) By Application (2021-2032)
Table 25 Asia Pacific Agarose Revenue (USD Million) By Product (2021-2032)
Table 26 South America Agarose Revenue (USD Million) By Type (2021-2032)
Table 27 South America Agarose Revenue (USD Million) By Application (2021-2032)
Table 28 South America Agarose Revenue (USD Million) By Product (2021-2032)
Table 29 Middle East and Africa Agarose Revenue (USD Million) By Type (2021-2032)
Table 30 Middle East and Africa Agarose Revenue (USD Million) By Application (2021-2032)
Table 31 Middle East and Africa Agarose Revenue (USD Million) By Product (2021-2032)
LIST OF FIGURES
Figure 1. Market Scope
Figure 2. Pricing Forecasts Per Unit, 2023- 2032
Figure 3. Porter’s Five Forces
Figure 4. Global Agarose Market Revenue (USD Million) By Regions (2021-2032)
Figure 5. Global Agarose Market Share (%) By Regions (2023)
Figure 6. North America Agarose Revenue (USD Million) By Country (2021-2032)
Figure 7. United States Agarose Revenue (USD Million) By Country (2021-2032)
Figure 8. Canada Agarose Revenue (USD Million) By Country (2021-2032)
Figure 9. Mexico Agarose Revenue (USD Million) By Country (2021-2032)
Figure 10. Europe Agarose Revenue (USD Million) By Country (2021-2032)
Figure 11. Germany Agarose Revenue (USD Million) By Country (2021-2032)
Figure 12. France Agarose Revenue (USD Million) By Country (2021-2032)
Figure 13. United Kingdom Agarose Revenue (USD Million) By Country (2021-2032)
Figure 14. Spain Agarose Revenue (USD Million) By Country (2021-2032)
Figure 15. Italy Agarose Revenue (USD Million) By Country (2021-2032)
Figure 16. Russia Agarose Revenue (USD Million) By Country (2021-2032)
Figure 17. Rest of Europe Agarose Revenue (USD Million) By Country (2021-2032)
Figure 11. Asia Pacific Agarose Revenue (USD Million) By Country (2021-2032)
Figure 12. China Agarose Revenue (USD Million) By Country (2021-2032)
Figure 13. Japan Agarose Revenue (USD Million) By Country (2021-2032)
Figure 14. India Agarose Revenue (USD Million) By Country (2021-2032)
Figure 15. South Korea Agarose Revenue (USD Million) By Country (2021-2032)
Figure 16. Australia Agarose Revenue (USD Million) By Country (2021-2032)
Figure 17. South East Asia Agarose Revenue (USD Million) By Country (2021-2032)
Figure 18. South America Agarose Revenue (USD Million) By Country (2021-2032)
Figure 19. Brazil Agarose Revenue (USD Million) By Country (2021-2032)
Figure 20. Argentina Agarose Revenue (USD Million) By Country (2021-2032)
Figure 21. Rest of Asia Pacific Agarose Revenue (USD Million) By Country (2021-2032)
Figure 22. Middle East and Africa Agarose Revenue (USD Million) By Region (2021-2032)
Figure 23. Saudi Arabia Agarose Revenue (USD Million) By Region (2021-2032)
Figure 24. The UAE Agarose Revenue (USD Million) By Region (2021-2032)
Figure 25. Rest of Middle East Agarose Revenue (USD Million) By Region (2021-2032)
Figure 26. South Africa Agarose Revenue (USD Million) By Region (2021-2032)
Figure 27. Africa Agarose Revenue (USD Million) By Region (2021-2032)
Figure 28. North America Agarose Revenue (USD Million) By Type (2021-2032)
Figure 29. North America Agarose Revenue (USD Million) By Application (2021-2032)
Figure 30. North America Agarose Revenue (USD Million) By Product (2021-2032)
Figure 31. Europe Agarose Revenue (USD Million) By Type (2021-2032)
Figure 32. Europe Agarose Revenue (USD Million) By Application (2021-2032)
Figure 33. Europe Agarose Revenue (USD Million) By Product (2021-2032)
Figure 34. Asia Pacific Agarose Revenue (USD Million) By Type (2021-2032)
Figure 35. Asia Pacific Agarose Revenue (USD Million) By Application (2021-2032)
Figure 36. Asia Pacific Agarose Revenue (USD Million) By Product (2021-2032)
Figure 37. South America Agarose Revenue (USD Million) By Type (2021-2032)
Figure 38. South America Agarose Revenue (USD Million) By Application (2021-2032)
Figure 39. South America Agarose Revenue (USD Million) By Product (2021-2032)
Figure 40. Middle East and Africa Agarose Revenue (USD Million) By Type (2021-2032)
Figure 41. Middle East and Africa Agarose Revenue (USD Million) By Application (2021-2032)
Figure 42. Middle East and Africa Agarose Revenue (USD Million) By Product (2021-2032)
By Type
Low Melting Point
Standard Melting
Others
By Application
Protein Purification
Agarose Gel Electrophoresis
Others
Countries Analyzed
North America (US, Canada, Mexico)
Europe (Germany, UK, France, Spain, Italy, Russia, Rest of Europe)
Asia Pacific (China, India, Japan, South Korea, Australia, South East Asia, Rest of Asia)
South America (Brazil, Argentina, Rest of South America)
Middle East and Africa (Saudi Arabia, UAE, Rest of Middle East, South Africa, Egypt, Rest of Africa)
