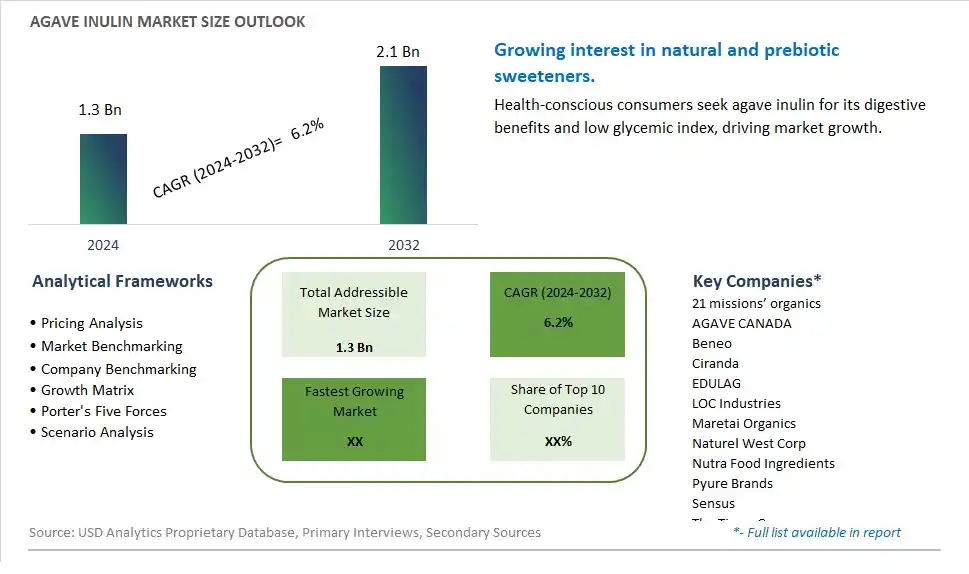
Global Agave Inulin Market Size is valued at $1.3 Billion in 2024 and is forecast to register a growth rate (CAGR) of 6.2% to reach $2.1 Billion by 2032.
The global Agave Inulin Market Comprehensive Study analyzes and forecasts the market size across 6 regions and 24 countries for diverse segments -By Form (Liquid, Dry), By Type (Organic, Conventional), By Application (Pharmaceuticals, Dietary Supplements, Food & Beverages, Industrial, Others)
An Introduction to Agave Inulin Market
In 2024, the Agave Inulin market is witnessing significant growth, driven by the increasing consumer demand for natural and functional food ingredients. Agave inulin, a prebiotic fiber extracted from the agave plant, is prized for its health benefits, including digestive health support and blood sugar regulation. The market is benefiting from the rising trend towards clean-label and plant-based products, as well as the growing interest in gut health and wellness. Advances in extraction and purification technologies are enhancing the quality and application versatility of agave inulin, making it a popular ingredient in functional foods, beverages, and dietary supplements.
Agave Inulin Competitive Landscape
The market report analyses the leading companies in the industry including 21 missions’ organics, AGAVE CANADA, Beneo, Ciranda, EDULAG, LOC Industries, Maretai Organics, Naturel West Corp, Nutra Food Ingredients, Pyure Brands, Sensus, The Tierra Group, and Others.
Agave Inulin Market Dynamics
Agave Inulin Market Trend: Growing Popularity of Natural Sweeteners and Prebiotics
The market for agave inulin is witnessing a significant trend towards the growing popularity of natural sweeteners and prebiotics. Consumers are increasingly seeking alternatives to artificial sweeteners and sugars, driven by health concerns and a desire for more natural food ingredients. Agave inulin, a natural sweetener derived from the agave plant, is also recognized for its prebiotic properties, which promote gut health by stimulating the growth of beneficial bacteria. This dual functionality makes agave inulin an attractive ingredient in the health and wellness sector, where there is a rising demand for products that offer multiple health benefits. The trend is further supported by the clean label movement, which emphasizes transparency and natural ingredients in food and beverages.
Agave Inulin Market Driver: Rising Health Consciousness and Demand for Functional Foods
The primary driver for the agave inulin market is the rising health consciousness and demand for functional foods. As consumers become more aware of the impact of their diet on overall health, there is a growing preference for foods that offer additional health benefits beyond basic nutrition. Agave inulin, with its low glycemic index and prebiotic benefits, fits well into this trend, making it a popular choice for health-conscious individuals and those managing conditions like diabetes and digestive health issues. The increasing prevalence of lifestyle-related diseases and the focus on preventive health measures are driving the incorporation of functional ingredients like agave inulin into a variety of food and beverage products, including snacks, beverages, dairy products, and dietary supplements.
Agave Inulin Market Opportunity: Innovation in Food and Beverage Applications
A significant opportunity for the agave inulin market lies in innovation in food and beverage applications. There is potential to develop new and innovative products that leverage the unique properties of agave inulin, such as its sweetness and prebiotic benefits. This includes creating healthier versions of popular products like baked goods, confectioneries, and beverages that cater to the growing demand for functional and natural ingredients. Additionally, expanding the use of agave inulin in plant-based and vegan products can tap into the rapidly growing market for alternative diets. Collaborating with food technologists and nutrition experts to explore new applications and formulations can drive product development and market growth. Effective marketing strategies that highlight the health benefits and versatility of agave inulin can also enhance consumer awareness and adoption.
Agave Inulin Market Share Analysis: Dry segment generated the highest revenue share in the industry
The Dry segment is the largest in the Agave Inulin Market by form. This segment's dominance is due to its versatility, ease of handling, and longer shelf life compared to liquid forms. Dry agave inulin can be easily incorporated into a wide range of products, including dietary supplements, food and beverages, and pharmaceuticals, without significantly altering their consistency or taste. Its stability and convenience in storage and transportation further contribute to its widespread use and market leadership.
Agave Inulin Market Share Analysis: Organic is the fastest growing segment over the forecast period to 2032
The Organic segment within the Agave Inulin Market is projected to be the fastest growing segment by 2032. This rapid growth is driven by increasing consumer demand for organic and natural products, driven by a growing awareness of health and environmental concerns. Organic agave inulin is perceived as a healthier and more sustainable option, which aligns with the rising trend towards clean label and nonGMO products. As more consumers seek out organic ingredients in their diets and personal care products, the demand for organic agave inulin is expected to surge, leading to significant market growth.
Agave Inulin Market Share Analysis: Food & Beverages segment generated the highest revenue share in the industry
The Food & Beverages segment is the largest in the Agave Inulin Market by application. This segment's prominence is due to the extensive use of agave inulin as a functional ingredient in various food and beverage products. Agave inulin is valued for its prebiotic properties, ability to improve texture, and enhance the nutritional profile of products. It is commonly used in dairy products, baked goods, beverages, and snacks to provide health benefits and improve taste and texture. The increasing demand for healthier food options and functional ingredients is driving the growth of the food and beverages segment, making it the largest application area for agave inulin.
Agave Inulin Market Segmentation
By Form
Liquid
Dry
By Type
Organic
Conventional
By Application
Pharmaceuticals
Dietary Supplements
Food & Beverages
Industrial
Others
Countries Analyzed
North America (US, Canada, Mexico)
Europe (Germany, UK, France, Spain, Italy, Russia, Rest of Europe)
Asia Pacific (China, India, Japan, South Korea, Australia, South East Asia, Rest of Asia)
South America (Brazil, Argentina, Rest of South America)
Middle East and Africa (Saudi Arabia, UAE, Rest of Middle East, South Africa, Egypt, Rest of Africa)
Agave Inulin Companies Profiled in the Study
21 missions’ organics
AGAVE CANADA
Beneo
Ciranda
EDULAG
LOC Industries
Maretai Organics
Naturel West Corp
Nutra Food Ingredients
Pyure Brands
Sensus
The Tierra Group
*- List Not Exhaustive
Chapter 1. TABLE OF CONTENTS
Chapter 2. Introduction to Agave Inulin Market
2.1. Market Overview
2.2. Key Statistics and Report Highlights
2.3. Scope of the Comprehensive Study
2.3.1. Market Definition
2.3.2 Countries and Regions Covered
2.3.3 Research Objective
2.3.4 Units, Currency, and Conversions
2.3.5 Industry Value Chain
2.4. Key Market Segments
2.5. Key Companies
2.6. Study Period
Chapter 3. Strategic Analysis Review
3.1. Agave Inulin Pricing Analysis and Forecast
3.2. Porter’s Five Forces
3.3. Market Ecosystem
3.4. SWOT Analysis
3.5. Regulatory Scenario
3.3. Effects of Inflation, Russia-Ukraine War, moderating economic growth, and other macroeconomic factors
Chapter 4. Competitive Landscape
4.1. Market Share Analysis
4.1.1. Global Agave Inulin Market Share by Company, 2023
4.1.2. Product Offerings of Leading Agave Inulin Companies
4.2. Market Entropy
4.2.1. New Product Launches in the Industry
4.2.2. Mergers, Acquisitions, Joint ventures, and Partnerships
4.3. Key Strategies and Best Practices
Chapter 5. Global Market Projections: Best, Reference, and Low Case Scenarios
5.1. Growth Analysis- Case Scenario Definitions
5.2. Low Growth Case Scenario Forecasts
5.3. Reference Growth Case Scenario Forecasts
5.4. High Growth Case Scenario Forecasts
Chapter 6. Market Dynamics
6.1. Agave Inulin Market Drivers
6.2. Agave Inulin Market Challenges
6.6. Agave Inulin Market Opportunities
6.4. Agave Inulin Market Trends
Chapter 7. Global Agave Inulin Market Outlook Trends
7.1. Global Agave Inulin Revenue (USD Million) and CAGR (%) by Type (2021-2032)
7.2. Global Agave Inulin Revenue (USD Million) and CAGR (%) by Application (2021-2032)
7.3. Global Agave Inulin Revenue (USD Million) and CAGR (%) by Product (2021-2032)
By Form
Liquid
Dry
By Type
Organic
Conventional
By Application
Pharmaceuticals
Dietary Supplements
Food & Beverages
Industrial
Others
Chapter 8. Global Agave Inulin Regional Analysis and Outlook
8.1. Global Agave Inulin Revenue (USD Million) By Regions (2021- 2032)
8.2. North America Agave Inulin Revenue (USD Million) by Country (2021-2032)
8.2.1. United States Agave Inulin Regional Analysis and Outlook
8.2.2. Canada Agave Inulin Regional Analysis and Outlook
8.2.3. Mexico Agave Inulin Regional Analysis and Outlook
8.3. Europe Agave Inulin Revenue (USD Million), by Country (2021-2032)
8.3.1. Germany Agave Inulin Regional Analysis and Outlook
8.3.2. France Agave Inulin Regional Analysis and Outlook
8.3.3. United Kingdom Agave Inulin Regional Analysis and Outlook
8.3.4. Spain Agave Inulin Regional Analysis and Outlook
8.3.5. Italy Agave Inulin Regional Analysis and Outlook
8.3.6. Russia Agave Inulin Regional Analysis and Outlook
8.3.7. Rest of Europe Agave Inulin Regional Analysis and Outlook
8.4. Asia Pacific Agave Inulin Revenue (USD Million) by Country (2021-2032)
8.4.1. China Agave Inulin Regional Analysis and Outlook
8.4.2. Japan Agave Inulin Regional Analysis and Outlook
8.4.3. India Agave Inulin Regional Analysis and Outlook
8.4.4. South Korea Agave Inulin Regional Analysis and Outlook
8.4.5. Australia Agave Inulin Regional Analysis and Outlook
8.4.6. South East Asia Agave Inulin Regional Analysis and Outlook
8.4.7. Rest of Asia Pacific Agave Inulin Regional Analysis and Outlook
8.5. South America Agave Inulin Revenue (USD Million), by Country (2021-2032)
8.5.1. Brazil Agave Inulin Regional Analysis and Outlook
8.5.2. Argentina Agave Inulin Regional Analysis and Outlook
8.5.3. Rest of South America Agave Inulin Regional Analysis and Outlook
8.6. Middle East and Africa Agave Inulin Revenue (USD Million) by Country (2021-2032)
8.6.1. Middle East Agave Inulin Regional Analysis and Outlook
8.6.2. Africa Agave Inulin Regional Analysis and Outlook
Chapter 9. North America Agave Inulin Analysis and Outlook
9.1. North America Agave Inulin Revenue (USD Million) by Segments (2021-2032)
9.1.1. North America Agave Inulin Revenue (USD Million) by Type (2021-2032)
9.1.2. North America Agave Inulin Revenue (USD Million) by Application (2021-2032)
9.1.3. North America Agave Inulin Revenue (USD Million) by Product (2021-2032)
By Form
Liquid
Dry
By Type
Organic
Conventional
By Application
Pharmaceuticals
Dietary Supplements
Food & Beverages
Industrial
Others
Chapter 10. Europe Agave Inulin Analysis and Outlook
10.1. Europe Agave Inulin Revenue (USD Million), by Segments (USD Million) (2021-2032)
10.1.1. Europe Agave Inulin Revenue (USD Million) by Type (2021-2032)
10.1.2. Europe Agave Inulin Revenue (USD Million) by Application (2021-2032)
10.1.3. Europe Agave Inulin Revenue (USD Million) by Product (2021-2032)
By Form
Liquid
Dry
By Type
Organic
Conventional
By Application
Pharmaceuticals
Dietary Supplements
Food & Beverages
Industrial
Others
Chapter 11. Asia Pacific Agave Inulin Analysis and Outlook
11.1. Asia Pacific Agave Inulin Revenue (USD Million), and Revenue (USD Million) by Segments (2021-2032)
11.1.1. Asia Pacific Agave Inulin Revenue (USD Million) by Type (2021-2032)
11.1.2. Asia Pacific Agave Inulin Revenue (USD Million) by Application (2021-2032)
11.1.3. Asia Pacific Agave Inulin Revenue (USD Million) by Product (2021-2032)
By Form
Liquid
Dry
By Type
Organic
Conventional
By Application
Pharmaceuticals
Dietary Supplements
Food & Beverages
Industrial
Others
Chapter 12. South America Agave Inulin Analysis and Outlook
12.1. South America Agave Inulin Revenue (USD Million), by Segments (2021-2032)
12.1.1. South America Agave Inulin Revenue (USD Million) by Type (2021-2032)
12.1.2. South America Agave Inulin Revenue (USD Million) by Application (2021-2032)
12.1.3. South America Agave Inulin Revenue (USD Million) by Product (2021-2032)
By Form
Liquid
Dry
By Type
Organic
Conventional
By Application
Pharmaceuticals
Dietary Supplements
Food & Beverages
Industrial
Others
Chapter 13. Middle East and Africa Agave Inulin Analysis and Outlook
13.1. Middle East and Africa Agave Inulin Revenue (USD Million), by Segments (2021-2032)
13.1.1. Middle East and Africa Agave Inulin Revenue (USD Million) by Type (2021-2032)
13.1.2. Middle East and Africa Agave Inulin Revenue (USD Million) by Application (2021-2032)
13.1.3. Middle East and Africa Agave Inulin Revenue (USD Million) by Product (2021-2032)
By Form
Liquid
Dry
By Type
Organic
Conventional
By Application
Pharmaceuticals
Dietary Supplements
Food & Beverages
Industrial
Others
Chapter 14. Agave Inulin Company Profiles
14.1 Business Overview
14.2 Product Profiles
14.3 SWOT Profiles
14.5 Recent Developments
14.6 Financial Profile
List of Companies
21 missions’ organics
AGAVE CANADA
Beneo
Ciranda
EDULAG
LOC Industries
Maretai Organics
Naturel West Corp
Nutra Food Ingredients
Pyure Brands
Sensus
The Tierra Group
15. Methodology and Data Sources
15.1 Customization Offerings
15.2 Subscription Services
15.3 Related Reports
15.4 Publisher Expertise
LIST OF TABLES
Table 1 Market Segmentation Analysis
Table 2 Global Agave Inulin Market Share of Leading Companies, 2023
Table 3 Product Offerings of Leading Companies
Table 4 Low Growth Scenario Forecasts
Table 5 Reference Case Growth Scenario
Table 6 High Growth Case Scenario
Table 7 Global Agave Inulin Revenue (USD Million) And CAGR (%) By Type (2021-2032)
Table 8 Global Agave Inulin Revenue (USD Million) And CAGR (%) By Application (2021-2032)
Table 9 Global Agave Inulin Revenue (USD Million) And CAGR (%) By Product (2021-2032)
Table 10 Global Agave Inulin Market Revenue (USD Million) By Regions (2021-2032)
Table 11 Global Agave Inulin Market Share (%) By Regions (2021-2032)
Table 12 North America Agave Inulin Revenue (USD Million) By Country (2021-2032)
Table 13 Europe Agave Inulin Revenue (USD Million) By Country (2021-2032)
Table 14 Asia Pacific Agave Inulin Revenue (USD Million) By Country (2021-2032)
Table 15 South America Agave Inulin Revenue (USD Million) By Country (2021-2032)
Table 16 Middle East and Africa Agave Inulin Revenue (USD Million) By Region (2021-2032)
Table 17 North America Agave Inulin Revenue (USD Million) By Type (2021-2032)
Table 18 North America Agave Inulin Revenue (USD Million) By Application (2021-2032)
Table 19 North America Agave Inulin Revenue (USD Million) By Product (2021-2032)
Table 20 Europe Agave Inulin Revenue (USD Million) By Type (2021-2032)
Table 21 Europe Agave Inulin Revenue (USD Million) By Application (2021-2032)
Table 22 Europe Agave Inulin Revenue (USD Million) By Product (2021-2032)
Table 23 Asia Pacific Agave Inulin Revenue (USD Million) By Type (2021-2032)
Table 24 Asia Pacific Agave Inulin Revenue (USD Million) By Application (2021-2032)
Table 25 Asia Pacific Agave Inulin Revenue (USD Million) By Product (2021-2032)
Table 26 South America Agave Inulin Revenue (USD Million) By Type (2021-2032)
Table 27 South America Agave Inulin Revenue (USD Million) By Application (2021-2032)
Table 28 South America Agave Inulin Revenue (USD Million) By Product (2021-2032)
Table 29 Middle East and Africa Agave Inulin Revenue (USD Million) By Type (2021-2032)
Table 30 Middle East and Africa Agave Inulin Revenue (USD Million) By Application (2021-2032)
Table 31 Middle East and Africa Agave Inulin Revenue (USD Million) By Product (2021-2032)
LIST OF FIGURES
Figure 1. Market Scope
Figure 2. Pricing Forecasts Per Unit, 2023- 2032
Figure 3. Porter’s Five Forces
Figure 4. Global Agave Inulin Market Revenue (USD Million) By Regions (2021-2032)
Figure 5. Global Agave Inulin Market Share (%) By Regions (2023)
Figure 6. North America Agave Inulin Revenue (USD Million) By Country (2021-2032)
Figure 7. United States Agave Inulin Revenue (USD Million) By Country (2021-2032)
Figure 8. Canada Agave Inulin Revenue (USD Million) By Country (2021-2032)
Figure 9. Mexico Agave Inulin Revenue (USD Million) By Country (2021-2032)
Figure 10. Europe Agave Inulin Revenue (USD Million) By Country (2021-2032)
Figure 11. Germany Agave Inulin Revenue (USD Million) By Country (2021-2032)
Figure 12. France Agave Inulin Revenue (USD Million) By Country (2021-2032)
Figure 13. United Kingdom Agave Inulin Revenue (USD Million) By Country (2021-2032)
Figure 14. Spain Agave Inulin Revenue (USD Million) By Country (2021-2032)
Figure 15. Italy Agave Inulin Revenue (USD Million) By Country (2021-2032)
Figure 16. Russia Agave Inulin Revenue (USD Million) By Country (2021-2032)
Figure 17. Rest of Europe Agave Inulin Revenue (USD Million) By Country (2021-2032)
Figure 11. Asia Pacific Agave Inulin Revenue (USD Million) By Country (2021-2032)
Figure 12. China Agave Inulin Revenue (USD Million) By Country (2021-2032)
Figure 13. Japan Agave Inulin Revenue (USD Million) By Country (2021-2032)
Figure 14. India Agave Inulin Revenue (USD Million) By Country (2021-2032)
Figure 15. South Korea Agave Inulin Revenue (USD Million) By Country (2021-2032)
Figure 16. Australia Agave Inulin Revenue (USD Million) By Country (2021-2032)
Figure 17. South East Asia Agave Inulin Revenue (USD Million) By Country (2021-2032)
Figure 18. South America Agave Inulin Revenue (USD Million) By Country (2021-2032)
Figure 19. Brazil Agave Inulin Revenue (USD Million) By Country (2021-2032)
Figure 20. Argentina Agave Inulin Revenue (USD Million) By Country (2021-2032)
Figure 21. Rest of Asia Pacific Agave Inulin Revenue (USD Million) By Country (2021-2032)
Figure 22. Middle East and Africa Agave Inulin Revenue (USD Million) By Region (2021-2032)
Figure 23. Saudi Arabia Agave Inulin Revenue (USD Million) By Region (2021-2032)
Figure 24. The UAE Agave Inulin Revenue (USD Million) By Region (2021-2032)
Figure 25. Rest of Middle East Agave Inulin Revenue (USD Million) By Region (2021-2032)
Figure 26. South Africa Agave Inulin Revenue (USD Million) By Region (2021-2032)
Figure 27. Africa Agave Inulin Revenue (USD Million) By Region (2021-2032)
Figure 28. North America Agave Inulin Revenue (USD Million) By Type (2021-2032)
Figure 29. North America Agave Inulin Revenue (USD Million) By Application (2021-2032)
Figure 30. North America Agave Inulin Revenue (USD Million) By Product (2021-2032)
Figure 31. Europe Agave Inulin Revenue (USD Million) By Type (2021-2032)
Figure 32. Europe Agave Inulin Revenue (USD Million) By Application (2021-2032)
Figure 33. Europe Agave Inulin Revenue (USD Million) By Product (2021-2032)
Figure 34. Asia Pacific Agave Inulin Revenue (USD Million) By Type (2021-2032)
Figure 35. Asia Pacific Agave Inulin Revenue (USD Million) By Application (2021-2032)
Figure 36. Asia Pacific Agave Inulin Revenue (USD Million) By Product (2021-2032)
Figure 37. South America Agave Inulin Revenue (USD Million) By Type (2021-2032)
Figure 38. South America Agave Inulin Revenue (USD Million) By Application (2021-2032)
Figure 39. South America Agave Inulin Revenue (USD Million) By Product (2021-2032)
Figure 40. Middle East and Africa Agave Inulin Revenue (USD Million) By Type (2021-2032)
Figure 41. Middle East and Africa Agave Inulin Revenue (USD Million) By Application (2021-2032)
Figure 42. Middle East and Africa Agave Inulin Revenue (USD Million) By Product (2021-2032)
By Form
Liquid
Dry
By Type
Organic
Conventional
By Application
Pharmaceuticals
Dietary Supplements
Food & Beverages
Industrial
Others
Countries Analyzed
North America (US, Canada, Mexico)
Europe (Germany, UK, France, Spain, Italy, Russia, Rest of Europe)
Asia Pacific (China, India, Japan, South Korea, Australia, South East Asia, Rest of Asia)
South America (Brazil, Argentina, Rest of South America)
Middle East and Africa (Saudi Arabia, UAE, Rest of Middle East, South Africa, Egypt, Rest of Africa)
