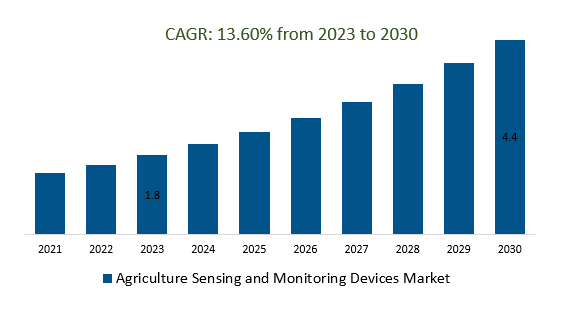
The global Agriculture Sensing and Monitoring Devices Market Size is estimated to be US$ 1.8 Billion in 2023 and is poised to register 13.6% growth over the forecast period from 2023 to 2030 to reach US $ 4.4 billion in 2030.
The market growth is driven predominantly by the Internet of Things (IoT) was plays a significant role in agriculture. Smart sensors and devices were being used to collect data from farms, and this data was transmitted to cloud platforms for analysis. This connectivity enabled farmers to monitor and manage their farms remotely. Leading companies are focusing on Advanced Sensor Integration, Artificial Intelligence, Machine Learning, Robotics, and Automation, Data Analytics and Visualization, Climate Resilience and Adaptation, Supply Chain Integration, and others to boost market shares in the industry.
Market Overview
The Agriculture Sensing and Monitoring Devices Market encompasses the development and deployment of devices that utilize sensors, IoT connectivity, and data analytics to provide real-time insights to farmers. These devices, including soil sensors, weather sensors, crop sensors, and livestock monitoring devices, are employed for precision agriculture, livestock management, disease detection, and climate monitoring. The market is driven by the need for efficient food production, technological advancements, sustainability concerns, and government support. Challenges include high initial costs, data management complexity, and data privacy issues. The market's future outlook is promising, with the potential to revolutionize farming practices through data-driven decision-making and resource optimization.
Market Dynamics
Market Trends- Companies are launching IoT Integration to attract a consumer base
IoT integration in the Agriculture Sensing and Monitoring Devices Market involves incorporating IoT technologies into farming practices through sensors and devices, enabling real-time data collection, analysis, and remote monitoring. This integration optimizes resource use, supports precision agriculture, aids in disease detection, enhances decision-making, and fosters sustainability by offering actionable insights and automation capabilities, ultimately improving overall farm efficiency and crop quality.
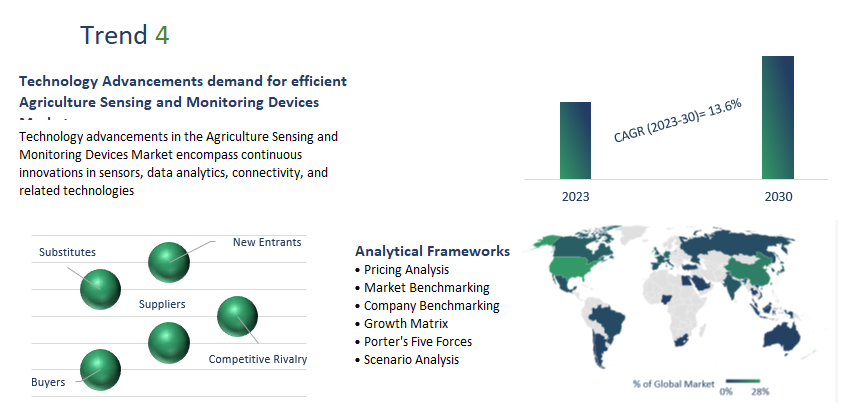
Market Driver- Technology Advancements demand for efficient Agriculture Sensing and Monitoring Devices Market
Technology advancements in the Agriculture Sensing and Monitoring Devices Market encompass continuous innovations in sensors, data analytics, connectivity, and related technologies to enhance the capabilities and effectiveness of sensing and monitoring devices. These advancements lead to more accurate data collection, better insights, and improved overall performance of devices, which play a pivotal role in transforming agricultural practices.
Market Opportunity-Introduction of Data Analytics and AI
Data analytics and AI (artificial intelligence) in the Agriculture Sensing and Monitoring Devices Market involve leveraging advanced analytical techniques and AI algorithms to process the vast amounts of data collected by sensing and monitoring devices. By extracting meaningful patterns, trends, and insights from this data, farmers can make informed decisions to optimize crop management, resource allocation, and operational efficiency. These technologies enable predictive analytics for disease detection, yield forecasting, and precision agriculture, leading to improved productivity and sustainable farming practices.
Market Share Analysis- Automation and Control Systems Agriculture Sensing and Monitoring Devices Market will register the significant growth
The global Agriculture Sensing and Monitoring Devices market is analyzed across Automation and Control Systems, Sensing Devices, Antennas/Access Points, and Software Solutions. Of these, Automation and Control Systems is poised to register the fastest growth. Automation and control systems in the Agriculture Sensing and Monitoring Devices Market refer to the integration of technology to automate various farming operations and control processes based on real-time data from sensing and monitoring devices. These systems enable tasks such as irrigation, fertilization, pest control, and machinery operation to be automated and optimized according to specific conditions detected by sensors. By using data-driven insights, these systems enhance efficiency, reduce labor requirements, and promote precision agriculture practices, resulting in improved crop yields and resource management.
The global Agriculture Sensing and Monitoring Devices market is analyzed across a wide range of applications including Yield Monitoring, Field Mapping, Crop Scouting, Weather Tracking, Soil Management, and Irrigation Control. Of these Weather Tracking held a significant market share in 2023. Weather tracking in the Agriculture Sensing and Monitoring Devices Market involves the use of sensors and technologies to monitor and collect data on weather conditions. These devices gather information such as temperature, humidity, wind speed, and precipitation levels. By integrating weather tracking into agriculture, farmers can make informed decisions about planting, irrigation, pest management, and other critical activities. Real-time weather data helps optimize resource usage, improve crop yield predictions, and enhance overall farm productivity while mitigating risks associated with adverse weather events.
Agriculture Sensing and Monitoring Devices Market Segmentation
By Type
- Automation and Control Systems
- Sensing Devices
- Antennas/Access Points
- Software Solutions
By Application
- Yield Monitoring
- Field Mapping
- Crop Scouting
- Weather Tracking
- Soil Management
- Irrigation Control
By End-User
- Farmers
- Agribusiness Providers
- Research Institutions
By Region
- North America (United States, Canada, Mexico)
- Europe (Germany, France, United Kingdom, Spain, Italy, Others)
- Asia Pacific (China, India, Japan, South Korea, Australia, Others)
- Latin America (Brazil, Argentina, Others)
- Middle East and Africa (Saudi Arabia, UAE, Kuwait, Other Middle East, South Africa, Nigeria, Other Africa)
Agriculture Sensing and Monitoring Devices Market companies
- Crop Metrics LLC
- Ag Leader Technology
- Trimble
- DICKEY-john Corporation
- Ag Junction Inc
- AGCO Corporation
- Raven Industries
- Deere and Company
- Farmers Edge Inc
- Grownetics Inc
- Agribotix LLC
- Granular
- Topcon Corporation
- SST Development Group
- The Climate Corporation
Agriculture Sensing and Monitoring Devices Market Outlook 2023
1 Market Overview
1.1 Introduction to the Agriculture Sensing and Monitoring Devices Market
1.2 Scope of the Study
1.3 Research Objective
1.3.1 Key Market Scope and Segments
1.3.2 Players Covered
1.3.3 Years Considered
2 Executive Summary
2.1 2023 Agriculture Sensing and Monitoring Devices Industry- Market Statistics
3 Market Dynamics
3.1 Market Drivers
3.2 Market Challenges
3.3 Market Opportunities
3.4 Market Trends
4 Market Factor Analysis
4.1 Porter’s Five Forces
4.2 Market Entropy
4.2.1 Global Agriculture Sensing and Monitoring Devices Market Companies with Area Served
4.2.2 Products Offerings Global Agriculture Sensing and Monitoring Devices Market
5 COVID-19 Impact Analysis and Outlook Scenarios
5.1.1 Covid-19 Impact Analysis
5.1.2 Post-COVID-19 Scenario- Low Growth Case
5.1.3 Post-COVID-19 Scenario- Reference Growth Case
5.1.4 Post-COVID-19 Scenario- Low Growth Case
6 Global Agriculture Sensing and Monitoring Devices Market Trends
6.1 Global Agriculture Sensing and Monitoring Devices Revenue (USD Million) and CAGR (%) by Type (2018-2030)
6.2 Global Agriculture Sensing and Monitoring Devices Revenue (USD Million) and CAGR (%) by Applications (2018-2030)
6.3 Global Agriculture Sensing and Monitoring Devices Revenue (USD Million) and CAGR (%) by Regions (2018-2030)
7 Global Agriculture Sensing and Monitoring Devices Market Revenue (USD Million) by Type, and Applications (2018-2022)
7.1 Global Agriculture Sensing and Monitoring Devices Revenue (USD Million) by Type (2018-2022)
7.1.1 Global Agriculture Sensing and Monitoring Devices Revenue (USD Million), Market Share (%) by Type (2018-2022)
7.2 Global Agriculture Sensing and Monitoring Devices Revenue (USD Million) by Applications (2018-2022)
7.2.1 Global Agriculture Sensing and Monitoring Devices Revenue (USD Million), Market Share (%) by Applications (2018-2022)
8 Global Agriculture Sensing and Monitoring Devices Development Regional Status and Outlook
8.1 Global Agriculture Sensing and Monitoring Devices Revenue (USD Million) By Regions (2018-2022)
8.2 North America Agriculture Sensing and Monitoring Devices Revenue (USD Million) by Type, and Application (2018-2022)
8.2.1 North America Agriculture Sensing and Monitoring Devices Revenue (USD Million) by Country (2018-2022)
8.2.2 North America Agriculture Sensing and Monitoring Devices Revenue (USD Million) by Type (2018-2022)
8.2.3 North America Agriculture Sensing and Monitoring Devices Revenue (USD Million) by Applications (2018-2022)
8.3 Europe Agriculture Sensing and Monitoring Devices Revenue (USD Million), by Type, and Applications (USD Million) (2018-2022)
8.3.1 Europe Agriculture Sensing and Monitoring Devices Revenue (USD Million), by Country (2018-2022)
8.3.2 Europe Agriculture Sensing and Monitoring Devices Revenue (USD Million) by Type (2018-2022)
8.3.3 Europe Agriculture Sensing and Monitoring Devices Revenue (USD Million) by Applications (2018-2022)
8.4 Asia Pacific Agriculture Sensing and Monitoring Devices Revenue (USD Million), and Revenue (USD Million) by Type, and Applications (2018-2022)
8.4.1 Asia Pacific Agriculture Sensing and Monitoring Devices Revenue (USD Million) by Country (2018-2022)
8.4.2 Asia Pacific Agriculture Sensing and Monitoring Devices Revenue (USD Million) by Type (2018-2022)
8.4.3 Asia Pacific Agriculture Sensing and Monitoring Devices Revenue (USD Million) by Applications (2018-2022)
8.5 South America Agriculture Sensing and Monitoring Devices Revenue (USD Million), by Type, and Applications (2018-2022)
8.5.1 South America Agriculture Sensing and Monitoring Devices Revenue (USD Million), by Country (2018-2022)
8.5.2 South America Agriculture Sensing and Monitoring Devices Revenue (USD Million) by Type (2018-2022)
8.5.3 South America Agriculture Sensing and Monitoring Devices Revenue (USD Million) by Applications (2018-2022)
8.6 Middle East and Africa Agriculture Sensing and Monitoring Devices Revenue (USD Million), by Type, Technology, Application, Thickness (2018-2022)
8.6.1 Middle East and Africa Agriculture Sensing and Monitoring Devices Revenue (USD Million) by Country (2018-2022)
8.6.2 Middle East and Africa Agriculture Sensing and Monitoring Devices Revenue (USD Million) by Type (2018-2022)
8.6.3 Middle East and Africa Agriculture Sensing and Monitoring Devices Revenue (USD Million) by Applications (2018-2022)
9 Company Profiles
10 Global Agriculture Sensing and Monitoring Devices Market Revenue (USD Million), by Type, and Applications (2023-2030)
10.1 Global Agriculture Sensing and Monitoring Devices Revenue (USD Million) and Market Share (%) by Type (2023-2030)
10.1.1 Global Agriculture Sensing and Monitoring Devices Revenue (USD Million), and Market Share (%) by Type (2023-2030)
10.2 Global Agriculture Sensing and Monitoring Devices Revenue (USD Million) and Market Share (%) by Applications (2023-2030)
10.2.1 Global Agriculture Sensing and Monitoring Devices Revenue (USD Million), and Market Share (%) by Applications (2023-2030)
11 Global Agriculture Sensing and Monitoring Devices Development Regional Status and Outlook Forecast
11.1 Global Agriculture Sensing and Monitoring Devices Revenue (USD Million) By Regions (2023-2030)
11.2 North America Agriculture Sensing and Monitoring Devices Revenue (USD Million) by Type, and Applications (2023-2030)
11.2.1 North America Agriculture Sensing and Monitoring Devices Revenue (USD) Million by Country (2023-2030)
11.2.2 North America Agriculture Sensing and Monitoring Devices Revenue (USD Million), by Type (2023-2030)
11.2.3 North America Agriculture Sensing and Monitoring Devices Revenue (USD Million), Market Share (%) by Applications (2023-2030)
11.3 Europe Agriculture Sensing and Monitoring Devices Revenue (USD Million), by Type, and Applications (2023-2030)
11.3.1 Europe Agriculture Sensing and Monitoring Devices Revenue (USD Million), by Country (2023-2030)
11.3.2 Europe Agriculture Sensing and Monitoring Devices Revenue (USD Million), by Type (2023-2030)
11.3.3 Europe Agriculture Sensing and Monitoring Devices Revenue (USD Million), by Applications (2023-2030)
11.4 Asia Pacific Agriculture Sensing and Monitoring Devices Revenue (USD Million) by Type, and Applications (2023-2030)
11.4.1 Asia Pacific Agriculture Sensing and Monitoring Devices Revenue (USD Million), by Country (2023-2030)
11.4.2 Asia Pacific Agriculture Sensing and Monitoring Devices Revenue (USD Million), by Type (2023-2030)
11.4.3 Asia Pacific Agriculture Sensing and Monitoring Devices Revenue (USD Million), by Applications (2023-2030)
11.5 South America Agriculture Sensing and Monitoring Devices Revenue (USD Million), by Type, and Applications (2023-2030)
11.5.1 South America Agriculture Sensing and Monitoring Devices Revenue (USD Million), by Country (2023-2030)
11.5.2 South America Agriculture Sensing and Monitoring Devices Revenue (USD Million), by Type (2023-2030)
11.5.3 South America Agriculture Sensing and Monitoring Devices Revenue (USD Million), by Applications (2023-2030)
11.6 Middle East and Africa Agriculture Sensing and Monitoring Devices Revenue (USD Million), by Type, and Applications (2023-2030)
11.6.1 Middle East and Africa Agriculture Sensing and Monitoring Devices Revenue (USD Million), by Region (2023-2030)
11.6.2 Middle East and Africa Agriculture Sensing and Monitoring Devices Revenue (USD Million), by Type (2023-2030)
11.6.3 Middle East and Africa Agriculture Sensing and Monitoring Devices Revenue (USD Million), by Applications (2023-2030)
12 Methodology and Data Sources
12.1 Methodology/Research Approach
12.1.1 Research Programs/Design
12.1.2 Market Size Estimation
12.1.3 Market Breakdown and Data Triangulation
12.2 Data Sources
12.2.1 Secondary Sources
12.2.2 Primary Sources
12.3 Disclaimer
List of Tables
Table 1 Market Segmentation Analysis
Table 2 Global Agriculture Sensing and Monitoring Devices Market Companies with Areas Served
Table 3 Products Offerings Global Agriculture Sensing and Monitoring Devices Market
Table 4 Low Growth Scenario Forecasts
Table 5 Reference Case Growth Scenario
Table 6 High Growth Case Scenario
Table 7 Global Agriculture Sensing and Monitoring Devices Revenue (USD Million) And CAGR (%) By Type (2018-2030)
Table 8 Global Agriculture Sensing and Monitoring Devices Revenue (USD Million) And CAGR (%) By Applications (2018-2030)
Table 9 Global Agriculture Sensing and Monitoring Devices Revenue (USD Million) And CAGR (%) By Regions (2018-2030)
Table 10 Global Agriculture Sensing and Monitoring Devices Revenue (USD Million) By Type (2018-2022)
Table 11 Global Agriculture Sensing and Monitoring Devices Revenue Market Share (%) By Type (2018-2022)
Table 12 Global Agriculture Sensing and Monitoring Devices Revenue (USD Million) By Applications (2018-2022)
Table 13 Global Agriculture Sensing and Monitoring Devices Revenue Market Share (%) By Applications (2018-2022)
Table 14 Global Agriculture Sensing and Monitoring Devices Market Revenue (USD Million) By Regions (2018-2022)
Table 15 Global Agriculture Sensing and Monitoring Devices Market Share (%) By Regions (2018-2022)
Table 16 North America Agriculture Sensing and Monitoring Devices Revenue (USD Million) By Country (2018-2022)
Table 17 North America Agriculture Sensing and Monitoring Devices Revenue (USD Million) By Type (2018-2022)
Table 18 North America Agriculture Sensing and Monitoring Devices Revenue (USD Million) By Applications (2018-2022)
Table 19 Europe Agriculture Sensing and Monitoring Devices Revenue (USD Million) By Country (2018-2022)
Table 20 Europe Agriculture Sensing and Monitoring Devices Revenue (USD Million) By Type (2018-2022)
Table 21 Europe Agriculture Sensing and Monitoring Devices Revenue (USD Million) By Applications (2018-2022)
Table 22 Asia Pacific Agriculture Sensing and Monitoring Devices Revenue (USD Million) By Country (2018-2022)
Table 23 Asia Pacific Agriculture Sensing and Monitoring Devices Revenue (USD Million) By Type (2018-2022)
Table 24 Asia Pacific Agriculture Sensing and Monitoring Devices Revenue (USD Million) By Applications (2018-2022)
Table 25 South America Agriculture Sensing and Monitoring Devices Revenue (USD Million) By Country (2018-2022)
Table 26 South America Agriculture Sensing and Monitoring Devices Revenue (USD Million) By Type (2018-2022)
Table 27 South America Agriculture Sensing and Monitoring Devices Revenue (USD Million) By Applications (2018-2022)
Table 28 Middle East and Africa Agriculture Sensing and Monitoring Devices Revenue (USD Million) By Region (2018-2022)
Table 29 Middle East and Africa Agriculture Sensing and Monitoring Devices Revenue (USD Million) By Type (2018-2022)
Table 30 Middle East and Africa Agriculture Sensing and Monitoring Devices Revenue (USD Million) By Applications (2018-2022)
Table 31 Financial Analysis
Table 32 Global Agriculture Sensing and Monitoring Devices Revenue (USD Million) By Type (2023-2030)
Table 33 Global Agriculture Sensing and Monitoring Devices Revenue Market Share (%) By Type (2023-2030)
Table 34 Global Agriculture Sensing and Monitoring Devices Revenue (USD Million) By Applications (2023-2030)
Table 35 Global Agriculture Sensing and Monitoring Devices Revenue Market Share (%) By Applications (2023-2030)
Table 36 Global Agriculture Sensing and Monitoring Devices Market Revenue (USD Million), And Revenue (USD Million) By Regions (2023-2030)
Table 37 North America Agriculture Sensing and Monitoring Devices Revenue (USD)By Country (2023-2030)
Table 38 North America Agriculture Sensing and Monitoring Devices Revenue (USD Million) By Type (2023-2030)
Table 39 North America Agriculture Sensing and Monitoring Devices Revenue (USD Million) By Applications (2023-2030)
Table 40 Europe Agriculture Sensing and Monitoring Devices Revenue (USD Million) By Country (2023-2030)
Table 41 Europe Agriculture Sensing and Monitoring Devices Revenue (USD Million) By Type (2023-2030)
Table 42 Europe Agriculture Sensing and Monitoring Devices Revenue (USD Million) By Applications (2023-2030)
Table 43 Asia Pacific Agriculture Sensing and Monitoring Devices Revenue (USD Million) By Country (2023-2030)
Table 44 Asia Pacific Agriculture Sensing and Monitoring Devices Revenue (USD Million) By Type (2023-2030)
Table 45 Asia Pacific Agriculture Sensing and Monitoring Devices Revenue (USD Million) By Applications (2023-2030)
Table 46 South America Agriculture Sensing and Monitoring Devices Revenue (USD Million) By Country (2023-2030)
Table 47 South America Agriculture Sensing and Monitoring Devices Revenue (USD Million) By Type (2023-2030)
Table 48 South America Agriculture Sensing and Monitoring Devices Revenue (USD Million) By Applications (2023-2030)
Table 49 Middle East and Africa Agriculture Sensing and Monitoring Devices Revenue (USD Million) By Region (2023-2030)
Table 50 Middle East and Africa Agriculture Sensing and Monitoring Devices Revenue (USD Million) By Region (2023-2030)
Table 51 Middle East and Africa Agriculture Sensing and Monitoring Devices Revenue (USD Million) By Type (2023-2030)
Table 52 Middle East and Africa Agriculture Sensing and Monitoring Devices Revenue (USD Million) By Applications (2023-2030)
Table 53 Research Programs/Design for This Report
Table 54 Key Data Information from Secondary Sources
Table 55 Key Data Information from Primary Sources
List of Figures
Figure 1 Market Scope
Figure 2 Porter’s Five Forces
Figure 3 Global Agriculture Sensing and Monitoring Devices Revenue (USD Million) By Type (2018-2022)
Figure 4 Global Agriculture Sensing and Monitoring Devices Revenue Market Share (%) By Type (2022)
Figure 5 Global Agriculture Sensing and Monitoring Devices Revenue (USD Million) By Applications (2018-2022)
Figure 6 Global Agriculture Sensing and Monitoring Devices Revenue Market Share (%) By Applications (2022)
Figure 7 Global Agriculture Sensing and Monitoring Devices Market Revenue (USD Million) By Regions (2018-2022)
Figure 8 Global Agriculture Sensing and Monitoring Devices Market Share (%) By Regions (2022)
Figure 9 North America Agriculture Sensing and Monitoring Devices Revenue (USD Million) By Country (2018-2022)
Figure 10 North America Agriculture Sensing and Monitoring Devices Revenue (USD Million) By Type (2018-2022)
Figure 11 North America Agriculture Sensing and Monitoring Devices Revenue (USD Million) By Applications (2018-2022)
Figure 12 Europe Agriculture Sensing and Monitoring Devices Revenue (USD Million) By Country (2018-2022)
Figure 13 Europe Agriculture Sensing and Monitoring Devices Revenue (USD Million) By Type (2018-2022)
Figure 14 Europe Agriculture Sensing and Monitoring Devices Revenue (USD Million) By Applications (2018-2022)
Figure 15 Asia Pacific Agriculture Sensing and Monitoring Devices Revenue (USD Million) By Country (2018-2022)
Figure 16 Asia Pacific Agriculture Sensing and Monitoring Devices Revenue (USD Million) By Type (2018-2022)
Figure 17 Asia Pacific Agriculture Sensing and Monitoring Devices Revenue (USD Million) By Applications (2018-2022)
Figure 18 South America Agriculture Sensing and Monitoring Devices Revenue (USD Million) By Country (2018-2022)
Figure 19 South America Agriculture Sensing and Monitoring Devices Revenue (USD Million) By Type (2018-2022)
Figure 20 South America Agriculture Sensing and Monitoring Devices Revenue (USD Million) By Applications (2018-2022)
Figure 21 Middle East and Africa Agriculture Sensing and Monitoring Devices Revenue (USD Million) By Region (2018-2022)
Figure 22 Middle East and Africa Agriculture Sensing and Monitoring Devices Revenue (USD Million) By Type (2018-2022)
Figure 23 Middle East and Africa Agriculture Sensing and Monitoring Devices Revenue (USD Million) By Applications (2018-2022)
Figure 24 Global Agriculture Sensing and Monitoring Devices Revenue (USD Million) By Type (2023-2030)
Figure 25 Global Agriculture Sensing and Monitoring Devices Revenue Market Share (%) By Type (2030)
Figure 26 Global Agriculture Sensing and Monitoring Devices Revenue (USD Million) By Applications (2023-2030)
Figure 27 Global Agriculture Sensing and Monitoring Devices Revenue Market Share (%) By Applications (2030)
Figure 28 Global Agriculture Sensing and Monitoring Devices Market Revenue (USD Million) By Regions (2023-2030)
Figure 29 North America Agriculture Sensing and Monitoring Devices Revenue (USD Million) By Country (2023-2030)
Figure 30 North America Agriculture Sensing and Monitoring Devices Revenue (USD Million) By Type (2023-2030)
Figure 31 North America Agriculture Sensing and Monitoring Devices Revenue (USD Million) By Applications (2023-2030)
Figure 32 Europe Agriculture Sensing and Monitoring Devices Revenue (USD Million) By Country (2023-2030)
Figure 33 Europe Agriculture Sensing and Monitoring Devices Revenue (USD Million) By Type (2023-2030)
Figure 34 Europe Agriculture Sensing and Monitoring Devices Revenue (USD Million) By Applications (2023-2030)
Figure 35 Asia Pacific Agriculture Sensing and Monitoring Devices Revenue (USD Million) By Country (2023-2030)
Figure 36 Asia Pacific Agriculture Sensing and Monitoring Devices Revenue (USD Million) By Type (2023-2030)
Figure 37 Asia Pacific Agriculture Sensing and Monitoring Devices Revenue (USD Million) By Applications (2023-2030)
Figure 38 South America Agriculture Sensing and Monitoring Devices Revenue (USD Million) By Country (2023-2030)
Figure 39 South America Agriculture Sensing and Monitoring Devices Revenue (USD Million) By Type (2023-2030)
Figure 40 South America Agriculture Sensing and Monitoring Devices Revenue (USD Million) By Applications (2023-2030)
Figure 41 Middle East and Africa Agriculture Sensing and Monitoring Devices Revenue (USD Million) By Region (2023-2030)
Figure 42 Middle East and Africa Agriculture Sensing and Monitoring Devices Revenue (USD Million) By Region (2023-2030)
Figure 43 Middle East and Africa Agriculture Sensing and Monitoring Devices Revenue (USD Million) By Type (2023-2030)
Figure 44 Middle East and Africa Agriculture Sensing and Monitoring Devices Revenue (USD Million) By Applications (2023-2030)
Figure 45 Bottom-Up and Top-Down Approaches For This Report
Figure 46 Data Triangulation
