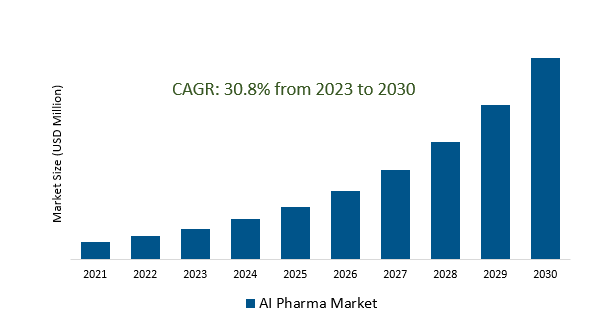
The AI Pharma Market Size is estimated to register 30.8% growth over the forecast period from 2023 to 2030.
AI Pharma Market Overview
The growing focus on personalized medicine and the ability of AI to analyze patient data, including genomics and medical histories, is driving the adoption of AI in tailoring treatments to individual patients, optimizing therapeutic outcomes. AI and machine learning technologies enabled the analysis of vast datasets to predict molecular interactions, identify drug targets, and design novel compounds with higher efficacy and safety profiles. Further, AI algorithms are identifying existing drugs that could be repurposed for new therapeutic indications, thereby accelerating the development of treatments for various diseases. AI-driven predictive analytics and algorithms were improving the efficiency of clinical trials by aiding in patient selection, optimizing trial designs, predicting outcomes, and reducing trial timelines and costs leading to the market growth.
AI Pharma Market Dynamics
Market Trends- The AI Pharma Market is witnessing a growth emphasizing heightened precision in drug discovery and development processes.
The integration of advanced AI technologies, particularly machine learning and predictive analytics, which enable a more precise and targeted approach in identifying potential drug candidates and optimizing their development are the key factors.
By leveraging AI algorithms to analyze extensive datasets containing molecular structures, biological interactions, and genetic information, pharmaceutical researchers are predicting and simulating drug-target interactions with exceptional accuracy.
Moreover, AI-driven precision is enabling a deeper understanding of complex biological systems, facilitating the development of customized treatments that account for individual variations in patient responses.
Market Driver- Demand for Personalized Medicine and Treatment are tailoring AI Pharma Market.
Minimized adverse effects by considering individual variations in disease susceptibility and drug responses, enhancing treatment effectiveness and patient safety are driving the market growth.
The evolution of sophisticated AI algorithms enables the analysis of extensive patient data, including genetic information and medical histories, facilitating the customization of treatments based on individual characteristics.
The aim is to optimize therapeutic results by tailoring medications, dosages, and treatment regimens to meet the unique needs of each patient, ensuring more effective and personalized therapies are fueling the demand.
Market Opportunity- Prioritizing Enhanced Drug Safety and Pharmacovigilance through AI Integration in the Pharma Market.
Advanced AI algorithms are enhancing the processing and analysis of vast amounts of data, including patient records, adverse event reports, and clinical trial data, thereby improving the accuracy and efficiency of pharmacovigilance activities.
Employing algorithms for continuous monitoring of adverse events and drug reactions, allowing for real-time analysis of patient data and medical records to swiftly identify potential safety concerns are propelling the market.
Further, by prioritizing drug safety and pharmacovigilance through AI-driven methodologies, the Pharma Market is taking a patient-centric approach, aiming to continually monitor medications for safety and efficacy, thereby enhancing overall healthcare outcomes.
Market Share Analysis- Deep Learning will register the fastest growth.
The AI Pharma Market is analyzed across Context Aware Processing, Natural Language Processing, Querying Method & Deep Learning. Deep Learning is poised to register the fastest growth. Deep Learning, a subset of machine learning, employs neural networks to analyze and interpret complex data patterns, allowing for the extraction of meaningful insights from vast datasets in the pharmaceutical domain. This technology holds immense promise in various critical areas such as drug discovery, precision medicine, disease diagnosis, and predictive analytics. Within drug discovery, Deep Learning algorithms facilitate the identification of potential drug candidates by swiftly analyzing molecular structures, predicting interactions, and optimizing compound designs. Its application extends to disease diagnosis, where it assists in analyzing medical images, detecting anomalies, and supporting clinicians in accurate diagnostics. The agility of Deep Learning in processing large-scale biological data, coupled with its ability to learn from diverse datasets, positions it as a powerful tool in the AI Pharma Market
Market Share Analysis- Drug Discovery held a significant market share in 2023.
The AI Pharma Market is analyzed across various applications including Drug Discovery, Clinical Trial, Laboratory Automation & Others. Of these, Drug Discovery held a significant market share in 2023. AI technologies, particularly machine learning and data analytics, play a pivotal role in accelerating drug discovery by expediting the identification and optimization of potential drug candidates. These technologies leverage vast datasets to predict molecular interactions, analyze biological structures, and simulate compound behaviors, significantly reducing the time and costs traditionally associated with discovering new drugs. AI-driven algorithms process extensive biological data, aiding in target identification, lead optimization, and predicting drug-target interactions with enhanced accuracy. Additionally, the use of AI in virtual screening and de novo molecular design enables the exploration of a broader chemical space for potential drug candidates. The integration of AI in Drug Discovery not only enhances the efficiency of identifying promising compounds but also improves their safety profiles, contributing to the development of more effective and targeted therapies.
AI Pharma Market Segmentation
By Technology
- Context Aware Processing
- Natural Language Processing
- Querying Method
- Deep Learning
By Type
By Application
- Drug Discovery
- Clinical Trial
- Laboratory Automation
- Others
By Region
- North America (United States, Canada, Mexico)
- Europe (Germany, France, United Kingdom, Spain, Italy, Others)
- Asia Pacific (China, India, Japan, South Korea, Australia, Others)
- Latin America (Brazil, Argentina, Others)
- Middle East and Africa (Saudi Arabia, UAE, Kuwait, Other Middle East, South Africa, Nigeria, Other Africa)
AI Pharma Market Companies
- Alphabet Inc
- BenevolentAI
- XtalPi Inc
- Cloud Pharmaceuticals Inc
- Deep Genomics
- Euretos
- Exscientia
- Deargen Inc
- Insilico Medicine
- InveniAI LLC
- Atomwise Inc
- Cyclica Inc
*List not exhaustive
AI Pharma Market Outlook 2023
1 Market Overview
1.1 Introduction to the AI Pharma Market
1.2 Scope of the Study
1.3 Research Objective
1.3.1 Key Market Scope and Segments
1.3.2 Players Covered
1.3.3 Years Considered
2 Executive Summary
2.1 2023 AI Pharma Industry- Market Statistics
3 Market Dynamics
3.1 Market Drivers
3.2 Market Challenges
3.3 Market Opportunities
3.4 Market Trends
4 Market Factor Analysis
4.1 Porter’s Five Forces
4.2 Market Entropy
4.2.1 Global AI Pharma Market Companies with Area Served
4.2.2 Products Offerings Global AI Pharma Market
5 COVID-19 Impact Analysis and Outlook Scenarios
5.1.1 Covid-19 Impact Analysis
5.1.2 post-COVID-19 Scenario- Low Growth Case
5.1.3 post-COVID-19 Scenario- Reference Growth Case
5.1.4 post-COVID-19 Scenario- Low Growth Case
6 Global AI Pharma Market Trends
6.1 Global AI Pharma Revenue (USD Million) and CAGR (%) by Type (2018-2030)
6.2 Global AI Pharma Revenue (USD Million) and CAGR (%) by Applications (2018-2030)
6.3 Global AI Pharma Revenue (USD Million) and CAGR (%) by regions (2018-2030)
7 Global AI Pharma Market Revenue (USD Million) by Type, and Applications (2018-2022)
7.1 Global AI Pharma Revenue (USD Million) by Type (2018-2022)
7.1.1 Global AI Pharma Revenue (USD Million), Market Share (%) by Type (2018-2022)
7.2 Global AI Pharma Revenue (USD Million) by Applications (2018-2022)
7.2.1 Global AI Pharma Revenue (USD Million), Market Share (%) by Applications (2018-2022)
8 Global AI Pharma Development Regional Status and Outlook
8.1 Global AI Pharma Revenue (USD Million) By Regions (2018-2022)
8.2 North America AI Pharma Revenue (USD Million) by Type, and Application (2018-2022)
8.2.1 North America AI Pharma Revenue (USD Million) by Country (2018-2022)
8.2.2 North America AI Pharma Revenue (USD Million) by Type (2018-2022)
8.2.3 North America AI Pharma Revenue (USD Million) by Applications (2018-2022)
8.3 Europe AI Pharma Revenue (USD Million), by Type, and Applications (USD Million) (2018-2022)
8.3.1 Europe AI Pharma Revenue (USD Million), by Country (2018-2022)
8.3.2 Europe AI Pharma Revenue (USD Million) by Type (2018-2022)
8.3.3 Europe AI Pharma Revenue (USD Million) by Applications (2018-2022)
8.4 Asia Pacific AI Pharma Revenue (USD Million), and Revenue (USD Million) by Type, and Applications (2018-2022)
8.4.1 Asia Pacific AI Pharma Revenue (USD Million) by Country (2018-2022)
8.4.2 Asia Pacific AI Pharma Revenue (USD Million) by Type (2018-2022)
8.4.3 Asia Pacific AI Pharma Revenue (USD Million) by Applications (2018-2022)
8.5 South America AI Pharma Revenue (USD Million), by Type, and Applications (2018-2022)
8.5.1 South America AI Pharma Revenue (USD Million), by Country (2018-2022)
8.5.2 South America AI Pharma Revenue (USD Million) by Type (2018-2022)
8.5.3 South America AI Pharma Revenue (USD Million) by Applications (2018-2022)
8.6 Middle East and Africa AI Pharma Revenue (USD Million), by Type, Technology, Application, Thickness (2018-2022)
8.6.1 Middle East and Africa AI Pharma Revenue (USD Million) by Country (2018-2022)
8.6.2 Middle East and Africa AI Pharma Revenue (USD Million) by Type (2018-2022)
8.6.3 Middle East and Africa AI Pharma Revenue (USD Million) by Applications (2018-2022)
9 Company Profiles
10 Global AI Pharma Market Revenue (USD Million), by Type, and Applications (2023-2030)
10.1 Global AI Pharma Revenue (USD Million) and Market Share (%) by Type (2023-2030)
10.1.1 Global AI Pharma Revenue (USD Million), and Market Share (%) by Type (2023-2030)
10.2 Global AI Pharma Revenue (USD Million) and Market Share (%) by Applications (2023-2030)
10.2.1 Global AI Pharma Revenue (USD Million), and Market Share (%) by Applications (2023-2030)
11 Global AI Pharma Development Regional Status and Outlook Forecast
11.1 Global AI Pharma Revenue (USD Million) By Regions (2023-2030)
11.2 North America AI Pharma Revenue (USD Million) by Type, and Applications (2023-2030)
11.2.1 North America AI Pharma Revenue (USD) Million by Country (2023-2030)
11.2.2 North America AI Pharma Revenue (USD Million), by Type (2023-2030)
11.2.3 North America AI Pharma Revenue (USD Million), Market Share (%) by Applications (2023-2030)
11.3 Europe AI Pharma Revenue (USD Million), by Type, and Applications (2023-2030)
11.3.1 Europe AI Pharma Revenue (USD Million), by Country (2023-2030)
11.3.2 Europe AI Pharma Revenue (USD Million), by Type (2023-2030)
11.3.3 Europe AI Pharma Revenue (USD Million), by Applications (2023-2030)
11.4 Asia Pacific AI Pharma Revenue (USD Million) by Type, and Applications (2023-2030)
11.4.1 Asia Pacific AI Pharma Revenue (USD Million), by Country (2023-2030)
11.4.2 Asia Pacific AI Pharma Revenue (USD Million), by Type (2023-2030)
11.4.3 Asia Pacific AI Pharma Revenue (USD Million), by Applications (2023-2030)
11.5 South America AI Pharma Revenue (USD Million), by Type, and Applications (2023-2030)
11.5.1 South America AI Pharma Revenue (USD Million), by Country (2023-2030)
11.5.2 South America AI Pharma Revenue (USD Million), by Type (2023-2030)
11.5.3 South America AI Pharma Revenue (USD Million), by Applications (2023-2030)
11.6 Middle East and Africa AI Pharma Revenue (USD Million), by Type, and Applications (2023-2030)
11.6.1 Middle East and Africa AI Pharma Revenue (USD Million), by region (2023-2030)
11.6.2 Middle East and Africa AI Pharma Revenue (USD Million), by Type (2023-2030)
11.6.3 Middle East and Africa AI Pharma Revenue (USD Million), by Applications (2023-2030)
12 Methodology and Data Sources
12.1 Methodology/Research Approach
12.1.1 Research Programs/Design
12.1.2 Market Size Estimation
12.1.3 Market Breakdown and Data Triangulation
12.2 Data Sources
12.2.1 Secondary Sources
12.2.2 Primary Sources
12.3 Disclaimer
List of Tables
Table 1 Market Segmentation Analysis
Table 2 Global AI Pharma Market Companies with Areas Served
Table 3 Products Offerings Global AI Pharma Market
Table 4 Low Growth Scenario Forecasts
Table 5 Reference Case Growth Scenario
Table 6 High Growth Case Scenario
Table 7 Global AI Pharma Revenue (USD Million) And CAGR (%) By Type (2018-2030)
Table 8 Global AI Pharma Revenue (USD Million) And CAGR (%) By Applications (2018-2030)
Table 9 Global AI Pharma Revenue (USD Million) And CAGR (%) By Regions (2018-2030)
Table 10 Global AI Pharma Revenue (USD Million) By Type (2018-2022)
Table 11 Global AI Pharma Revenue Market Share (%) By Type (2018-2022)
Table 12 Global AI Pharma Revenue (USD Million) By Applications (2018-2022)
Table 13 Global AI Pharma Revenue Market Share (%) By Applications (2018-2022)
Table 14 Global AI Pharma Market Revenue (USD Million) By Regions (2018-2022)
Table 15 Global AI Pharma Market Share (%) By Regions (2018-2022)
Table 16 North America AI Pharma Revenue (USD Million) By Country (2018-2022)
Table 17 North America AI Pharma Revenue (USD Million) By Type (2018-2022)
Table 18 North America AI Pharma Revenue (USD Million) By Applications (2018-2022)
Table 19 Europe AI Pharma Revenue (USD Million) By Country (2018-2022)
Table 20 Europe AI Pharma Revenue (USD Million) By Type (2018-2022)
Table 21 Europe AI Pharma Revenue (USD Million) By Applications (2018-2022)
Table 22 Asia Pacific AI Pharma Revenue (USD Million) By Country (2018-2022)
Table 23 Asia Pacific AI Pharma Revenue (USD Million) By Type (2018-2022)
Table 24 Asia Pacific AI Pharma Revenue (USD Million) By Applications (2018-2022)
Table 25 South America AI Pharma Revenue (USD Million) By Country (2018-2022)
Table 26 South America AI Pharma Revenue (USD Million) By Type (2018-2022)
Table 27 South America AI Pharma Revenue (USD Million) By Applications (2018-2022)
Table 28 Middle East and Africa AI Pharma Revenue (USD Million) By Region (2018-2022)
Table 29 Middle East and Africa AI Pharma Revenue (USD Million) By Type (2018-2022)
Table 30 Middle East and Africa AI Pharma Revenue (USD Million) By Applications (2018-2022)
Table 31 Financial Analysis
Table 32 Global AI Pharma Revenue (USD Million) By Type (2023-2030)
Table 33 Global AI Pharma Revenue Market Share (%) By Type (2023-2030)
Table 34 Global AI Pharma Revenue (USD Million) By Applications (2023-2030)
Table 35 Global AI Pharma Revenue Market Share (%) By Applications (2023-2030)
Table 36 Global AI Pharma Market Revenue (USD Million), And Revenue (USD Million) By Regions (2023-2030)
Table 37 North America AI Pharma Revenue (USD)By Country (2023-2030)
Table 38 North America AI Pharma Revenue (USD Million) By Type (2023-2030)
Table 39 North America AI Pharma Revenue (USD Million) By Applications (2023-2030)
Table 40 Europe AI Pharma Revenue (USD Million) By Country (2023-2030)
Table 41 Europe AI Pharma Revenue (USD Million) By Type (2023-2030)
Table 42 Europe AI Pharma Revenue (USD Million) By Applications (2023-2030)
Table 43 Asia Pacific AI Pharma Revenue (USD Million) By Country (2023-2030)
Table 44 Asia Pacific AI Pharma Revenue (USD Million) By Type (2023-2030)
Table 45 Asia Pacific AI Pharma Revenue (USD Million) By Applications (2023-2030)
Table 46 South America AI Pharma Revenue (USD Million) By Country (2023-2030)
Table 47 South America AI Pharma Revenue (USD Million) By Type (2023-2030)
Table 48 South America AI Pharma Revenue (USD Million) By Applications (2023-2030)
Table 49 Middle East and Africa AI Pharma Revenue (USD Million) By Region (2023-2030)
Table 50 Middle East and Africa AI Pharma Revenue (USD Million) By Region (2023-2030)
Table 51 Middle East and Africa AI Pharma Revenue (USD Million) By Type (2023-2030)
Table 52 Middle East and Africa AI Pharma Revenue (USD Million) By Applications (2023-2030)
Table 53 Research Programs/Design for This Report
Table 54 Key Data Information from Secondary Sources
Table 55 Key Data Information from Primary Sources
List of Figures
Figure 1 Market Scope
Figure 2 Porter’s Five Forces
Figure 3 Global AI Pharma Revenue (USD Million) By Type (2018-2022)
Figure 4 Global AI Pharma Revenue Market Share (%) By Type (2022)
Figure 5 Global AI Pharma Revenue (USD Million) By Applications (2018-2022)
Figure 6 Global AI Pharma Revenue Market Share (%) By Applications (2022)
Figure 7 Global AI Pharma Market Revenue (USD Million) By Regions (2018-2022)
Figure 8 Global AI Pharma Market Share (%) By Regions (2022)
Figure 9 North America AI Pharma Revenue (USD Million) By Country (2018-2022)
Figure 10 North America AI Pharma Revenue (USD Million) By Type (2018-2022)
Figure 11 North America AI Pharma Revenue (USD Million) By Applications (2018-2022)
Figure 12 Europe AI Pharma Revenue (USD Million) By Country (2018-2022)
Figure 13 Europe AI Pharma Revenue (USD Million) By Type (2018-2022)
Figure 14 Europe AI Pharma Revenue (USD Million) By Applications (2018-2022)
Figure 15 Asia Pacific AI Pharma Revenue (USD Million) By Country (2018-2022)
Figure 16 Asia Pacific AI Pharma Revenue (USD Million) By Type (2018-2022)
Figure 17 Asia Pacific AI Pharma Revenue (USD Million) By Applications (2018-2022)
Figure 18 South America AI Pharma Revenue (USD Million) By Country (2018-2022)
Figure 19 South America AI Pharma Revenue (USD Million) By Type (2018-2022)
Figure 20 South America AI Pharma Revenue (USD Million) By Applications (2018-2022)
Figure 21 Middle East and Africa AI Pharma Revenue (USD Million) By Region (2018-2022)
Figure 22 Middle East and Africa AI Pharma Revenue (USD Million) By Type (2018-2022)
Figure 23 Middle East and Africa AI Pharma Revenue (USD Million) By Applications (2018-2022)
Figure 24 Global AI Pharma Revenue (USD Million) By Type (2023-2030)
Figure 25 Global AI Pharma Revenue Market Share (%) By Type (2030)
Figure 26 Global AI Pharma Revenue (USD Million) By Applications (2023-2030)
Figure 27 Global AI Pharma Revenue Market Share (%) By Applications (2030)
Figure 28 Global AI Pharma Market Revenue (USD Million) By Regions (2023-2030)
Figure 29 North America AI Pharma Revenue (USD Million) By Country (2023-2030)
Figure 30 North America AI Pharma Revenue (USD Million) By Type (2023-2030)
Figure 31 North America AI Pharma Revenue (USD Million) By Applications (2023-2030)
Figure 32 Europe AI Pharma Revenue (USD Million) By Country (2023-2030)
Figure 33 Europe AI Pharma Revenue (USD Million) By Type (2023-2030)
Figure 34 Europe AI Pharma Revenue (USD Million) By Applications (2023-2030)
Figure 35 Asia Pacific AI Pharma Revenue (USD Million) By Country (2023-2030)
Figure 36 Asia Pacific AI Pharma Revenue (USD Million) By Type (2023-2030)
Figure 37 Asia Pacific AI Pharma Revenue (USD Million) By Applications (2023-2030)
Figure 38 South America AI Pharma Revenue (USD Million) By Country (2023-2030)
Figure 39 South America AI Pharma Revenue (USD Million) By Type (2023-2030)
Figure 40 South America AI Pharma Revenue (USD Million) By Applications (2023-2030)
Figure 41 Middle East and Africa AI Pharma Revenue (USD Million) By Region (2023-2030)
Figure 42 Middle East and Africa AI Pharma Revenue (USD Million) By Region (2023-2030)
Figure 43 Middle East and Africa AI Pharma Revenue (USD Million) By Type (2023-2030)
Figure 44 Middle East and Africa AI Pharma Revenue (USD Million) By Applications (2023-2030)
Figure 45 Bottom-Up and Top-Down Approaches for This Report
Figure 46 Data Triangulation
