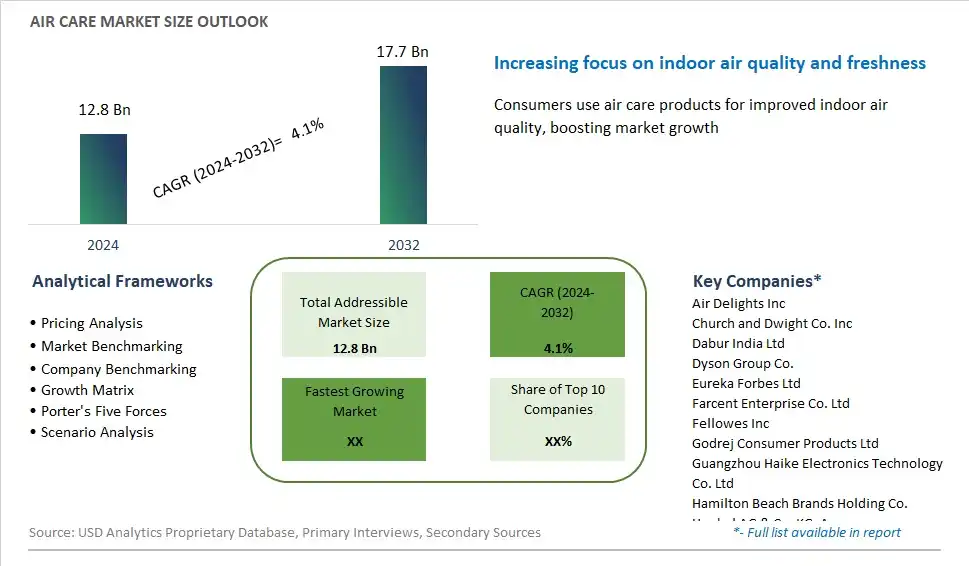
Global Air Care Market Size is valued at $12.8 Billion in 2024 and is forecast to register a growth rate (CAGR) of 4.1% to reach $17.7 Billion by 2032.
The global Air Care Market Comprehensive Study analyzes and forecasts the market size across 6 regions and 24 countries for diverse segments -By Type (Air freshener sprays, Electric air fresheners, Car air fresheners, Air freshener gels, Others), By Distribution Channel (Offline, Online)
An Introduction to Air Care Market
The air care market in 2024 encompasses a diverse array of products designed to freshen and improve indoor air quality, catering to consumer preferences for pleasant and clean-smelling environments. From traditional aerosol sprays to innovative scent diffusers and purifiers, manufacturers are continually introducing new technologies and formulations to meet evolving needs. With a rising focus on wellness and environmental sustainability, there's a growing demand for natural and eco-friendly air care solutions. Essential oils, botanical extracts, and plant-based ingredients are increasingly being incorporated into air fresheners and purifiers, offering aromatherapeutic benefits along with odor neutralization. Furthermore, smart home integration and customizable fragrance options are shaping the future of the air care market, providing consumers with greater control over their indoor environments. As awareness of indoor air quality issues continues to grow, the air care market is poised for expansion and innovation driven by health-conscious consumers.
Air Care Competitive Landscape
The market report analyses the leading companies in the industry including Air Delights Inc, Church and Dwight Co. Inc, Dabur India Ltd, Dyson Group Co., Eureka Forbes Ltd, Farcent Enterprise Co. Ltd, Fellowes Inc, Godrej Consumer Products Ltd, Guangzhou Haike Electronics Technology Co. Ltd, Hamilton Beach Brands Holding Co., Henkel AG & Co. KGaA, KENT RO Systems Ltd, Kobayashi Pharmaceutical Co. Ltd, M S George Ltd, MidasCare Pharmaceuticals Pvt. Ltd, N Ranga Rao and Sons Pvt. Ltd, Newell Brands Inc, Reckitt Benckiser Group Plc, S.C. Johnson and Son Inc, The Procter & Gamble Company (P&G), and Others.
Air Care Market Dynamics
Air Care Market Trend: Shift Towards Natural and Eco-Friendly Air Care Products
A significant trend in the air care market is the shift towards natural and eco-friendly products. With increasing awareness of environmental sustainability and indoor air quality, consumers are seeking air care solutions that are free from harsh chemicals and artificial fragrances. This trend is driven by concerns about respiratory health, allergies, and environmental impact, leading to a preference for natural ingredients such as essential oils and plant extracts. Manufacturers are responding to this trend by developing air care products that are eco-friendly, biodegradable, and derived from sustainable sources, catering to the growing demand for healthier and more environmentally conscious options.
Market Driver: Growing Concerns about Indoor Air Quality and Odor Control
A key driver shaping the air care market is the growing concerns about indoor air quality and odor control. With more time spent indoors, especially in urban environments where pollution levels can be high, consumers are seeking effective solutions to purify and freshen the air in their homes and workplaces. Factors such as pet odors, cooking smells, and environmental pollutants contribute to indoor air pollution, driving the demand for air care products that neutralize odors and improve air quality. This driver is further fueled by the desire for a clean and pleasant indoor environment, as well as the influence of health and wellness trends emphasizing the importance of breathing clean air for overall well-being.
Market Opportunity: Innovation in Smart and Connected Air Care Devices
An opportunity for growth in the air care market lies in innovation in smart and connected devices. With the rise of smart home technology and the Internet of Things (IoT), there is a demand for air care products that offer convenience, automation, and customization. Manufacturers can capitalize on this opportunity by developing smart air purifiers, diffusers, and scent dispensers that can be controlled remotely via smartphone apps or voice assistants. Additionally, there is potential for integration with home automation systems to automatically adjust air care settings based on factors such as occupancy, air quality, and time of day. By combining innovation with connectivity, manufacturers can enhance the user experience, differentiate their products in a competitive market, and meet the evolving needs of tech-savvy consumers.
Air Care Market Share Analysis: Air Freshener Sprays in the Air Care Market held the dominant market share in 2024
Air freshener sprays reign as the largest segment in the Air Care Market due to their widespread popularity and versatility in addressing various odor concerns. Offering quick and convenient odor elimination, air freshener sprays are favored by consumers for their ease of use and immediate results. Whether used at home, in offices, or in public spaces, these sprays effectively neutralize unpleasant odors, leaving behind a fresh and inviting ambiance. Additionally, the availability of a wide range of fragrances and formulations caters to diverse preferences, further enhancing their appeal. Their portable nature also makes them suitable for on-the-go use, contributing to their dominance in the market. As consumers continue to prioritize cleanliness and ambiance in their living spaces, air freshener sprays remain the go-to choice, driving their prominence in the Air Care Market.
Air Care Market Share Analysis: Online Distribution Channel in the Air Care market is poised to register the fastest growth rae over the forecast period to 2032
The Online Distribution Channel is the fastest-growing segment in the Air Care Market, propelled by the growing consumer preference for convenience, variety, and accessibility offered by e-commerce platforms. With the increasing penetration of the internet and smartphones, consumers are increasingly turning to online channels to fulfill their air care needs. The convenience of browsing and purchasing air care products from the comfort of home, coupled with the availability of a wide range of brands and formulations, attracts a growing number of shoppers to online platforms. Further, the COVID-19 pandemic has accelerated the shift towards online shopping as consumers prioritize safety and social distancing measures. Online retailers also leverage data analytics and personalized recommendations to enhance the shopping experience, further driving growth in this segment. As the digital landscape continues to evolve, the Online Distribution Channel is poised to maintain its momentum, reshaping the Air Care Market and offering new opportunities for industry players.
Air Care Market Segmentation
By Type
Air freshener sprays
Electric air fresheners
Car air fresheners
Air freshener gels
Others
By Distribution Channel
Offline
Online
Countries Analyzed
North America (US, Canada, Mexico)
Europe (Germany, UK, France, Spain, Italy, Russia, Rest of Europe)
Asia Pacific (China, India, Japan, South Korea, Australia, South East Asia, Rest of Asia)
South America (Brazil, Argentina, Rest of South America)
Middle East and Africa (Saudi Arabia, UAE, Rest of Middle East, South Africa, Egypt, Rest of Africa)
Air Care Companies Profiled in the Study
Air Delights Inc
Church and Dwight Co. Inc
Dabur India Ltd
Dyson Group Co.
Eureka Forbes Ltd
Farcent Enterprise Co. Ltd
Fellowes Inc
Godrej Consumer Products Ltd
Guangzhou Haike Electronics Technology Co. Ltd
Hamilton Beach Brands Holding Co.
Henkel AG & Co. KGaA
KENT RO Systems Ltd
Kobayashi Pharmaceutical Co. Ltd
M S George Ltd
MidasCare Pharmaceuticals Pvt. Ltd
N Ranga Rao and Sons Pvt. Ltd
Newell Brands Inc
Reckitt Benckiser Group Plc
S.C. Johnson and Son Inc
The Procter & Gamble Company (P&G)
*- List Not Exhaustive
Chapter 1. TABLE OF CONTENTS
Chapter 2. Introduction to Air Care Market
2.1. Market Overview
2.2. Key Statistics and Report Highlights
2.3. Scope of the Comprehensive Study
2.3.1. Market Definition
2.3.2 Countries and Regions Covered
2.3.3 Research Objective
2.3.4 Units, Currency, and Conversions
2.3.5 Industry Value Chain
2.4. Key Market Segments
2.5. Key Companies
2.6. Study Period
Chapter 3. Strategic Analysis Review
3.1. Air Care Pricing Analysis and Forecast
3.2. Porter’s Five Forces
3.3. Market Ecosystem
3.4. SWOT Analysis
3.5. Regulatory Scenario
3.3. Effects of Inflation, Russia-Ukraine War, moderating economic growth, and other macroeconomic factors
Chapter 4. Competitive Landscape
4.1. Market Share Analysis
4.1.1. Global Air Care Market Share by Company, 2023
4.1.2. Product Offerings of Leading Air Care Companies
4.2. Market Entropy
4.2.1. New Product Launches in the Industry
4.2.2. Mergers, Acquisitions, Joint ventures, and Partnerships
4.3. Key Strategies and Best Practices
Chapter 5. Global Market Projections: Best, Reference, and Low Case Scenarios
5.1. Growth Analysis- Case Scenario Definitions
5.2. Low Growth Case Scenario Forecasts
5.3. Reference Growth Case Scenario Forecasts
5.4. High Growth Case Scenario Forecasts
Chapter 6. Market Dynamics
6.1. Air Care Market Drivers
6.2. Air Care Market Challenges
6.6. Air Care Market Opportunities
6.4. Air Care Market Trends
Chapter 7. Global Air Care Market Outlook Trends
7.1. Global Air Care Revenue (USD Million) and CAGR (%) by Type (2021-2032)
7.2. Global Air Care Revenue (USD Million) and CAGR (%) by Application (2021-2032)
7.3. Global Air Care Revenue (USD Million) and CAGR (%) by Product (2021-2032)
By Type
Air freshener sprays
Electric air fresheners
Car air fresheners
Air freshener gels
Others
By Distribution Channel
Offline
Online
Chapter 8. Global Air Care Regional Analysis and Outlook
8.1. Global Air Care Revenue (USD Million) By Regions (2021- 2032)
8.2. North America Air Care Revenue (USD Million) by Country (2021-2032)
8.2.1. United States Air Care Regional Analysis and Outlook
8.2.2. Canada Air Care Regional Analysis and Outlook
8.2.3. Mexico Air Care Regional Analysis and Outlook
8.3. Europe Air Care Revenue (USD Million), by Country (2021-2032)
8.3.1. Germany Air Care Regional Analysis and Outlook
8.3.2. France Air Care Regional Analysis and Outlook
8.3.3. United Kingdom Air Care Regional Analysis and Outlook
8.3.4. Spain Air Care Regional Analysis and Outlook
8.3.5. Italy Air Care Regional Analysis and Outlook
8.3.6. Russia Air Care Regional Analysis and Outlook
8.3.7. Rest of Europe Air Care Regional Analysis and Outlook
8.4. Asia Pacific Air Care Revenue (USD Million) by Country (2021-2032)
8.4.1. China Air Care Regional Analysis and Outlook
8.4.2. Japan Air Care Regional Analysis and Outlook
8.4.3. India Air Care Regional Analysis and Outlook
8.4.4. South Korea Air Care Regional Analysis and Outlook
8.4.5. Australia Air Care Regional Analysis and Outlook
8.4.6. South East Asia Air Care Regional Analysis and Outlook
8.4.7. Rest of Asia Pacific Air Care Regional Analysis and Outlook
8.5. South America Air Care Revenue (USD Million), by Country (2021-2032)
8.5.1. Brazil Air Care Regional Analysis and Outlook
8.5.2. Argentina Air Care Regional Analysis and Outlook
8.5.3. Rest of South America Air Care Regional Analysis and Outlook
8.6. Middle East and Africa Air Care Revenue (USD Million) by Country (2021-2032)
8.6.1. Middle East Air Care Regional Analysis and Outlook
8.6.2. Africa Air Care Regional Analysis and Outlook
Chapter 9. North America Air Care Analysis and Outlook
9.1. North America Air Care Revenue (USD Million) by Segments (2021-2032)
9.1.1. North America Air Care Revenue (USD Million) by Type (2021-2032)
9.1.2. North America Air Care Revenue (USD Million) by Application (2021-2032)
9.1.3. North America Air Care Revenue (USD Million) by Product (2021-2032)
By Type
Air freshener sprays
Electric air fresheners
Car air fresheners
Air freshener gels
Others
By Distribution Channel
Offline
Online
Chapter 10. Europe Air Care Analysis and Outlook
10.1. Europe Air Care Revenue (USD Million), by Segments (USD Million) (2021-2032)
10.1.1. Europe Air Care Revenue (USD Million) by Type (2021-2032)
10.1.2. Europe Air Care Revenue (USD Million) by Application (2021-2032)
10.1.3. Europe Air Care Revenue (USD Million) by Product (2021-2032)
By Type
Air freshener sprays
Electric air fresheners
Car air fresheners
Air freshener gels
Others
By Distribution Channel
Offline
Online
Chapter 11. Asia Pacific Air Care Analysis and Outlook
11.1. Asia Pacific Air Care Revenue (USD Million), and Revenue (USD Million) by Segments (2021-2032)
11.1.1. Asia Pacific Air Care Revenue (USD Million) by Type (2021-2032)
11.1.2. Asia Pacific Air Care Revenue (USD Million) by Application (2021-2032)
11.1.3. Asia Pacific Air Care Revenue (USD Million) by Product (2021-2032)
By Type
Air freshener sprays
Electric air fresheners
Car air fresheners
Air freshener gels
Others
By Distribution Channel
Offline
Online
Chapter 12. South America Air Care Analysis and Outlook
12.1. South America Air Care Revenue (USD Million), by Segments (2021-2032)
12.1.1. South America Air Care Revenue (USD Million) by Type (2021-2032)
12.1.2. South America Air Care Revenue (USD Million) by Application (2021-2032)
12.1.3. South America Air Care Revenue (USD Million) by Product (2021-2032)
By Type
Air freshener sprays
Electric air fresheners
Car air fresheners
Air freshener gels
Others
By Distribution Channel
Offline
Online
Chapter 13. Middle East and Africa Air Care Analysis and Outlook
13.1. Middle East and Africa Air Care Revenue (USD Million), by Segments (2021-2032)
13.1.1. Middle East and Africa Air Care Revenue (USD Million) by Type (2021-2032)
13.1.2. Middle East and Africa Air Care Revenue (USD Million) by Application (2021-2032)
13.1.3. Middle East and Africa Air Care Revenue (USD Million) by Product (2021-2032)
By Type
Air freshener sprays
Electric air fresheners
Car air fresheners
Air freshener gels
Others
By Distribution Channel
Offline
Online
Chapter 14. Air Care Company Profiles
14.1 Business Overview
14.2 Product Profiles
14.3 SWOT Profiles
14.5 Recent Developments
14.6 Financial Profile
List of Companies
Air Delights Inc
Church and Dwight Co. Inc
Dabur India Ltd
Dyson Group Co.
Eureka Forbes Ltd
Farcent Enterprise Co. Ltd
Fellowes Inc
Godrej Consumer Products Ltd
Guangzhou Haike Electronics Technology Co. Ltd
Hamilton Beach Brands Holding Co.
Henkel AG & Co. KGaA
KENT RO Systems Ltd
Kobayashi Pharmaceutical Co. Ltd
M S George Ltd
MidasCare Pharmaceuticals Pvt. Ltd
N Ranga Rao and Sons Pvt. Ltd
Newell Brands Inc
Reckitt Benckiser Group Plc
S.C. Johnson and Son Inc
The Procter & Gamble Company (P&G)
15. Methodology and Data Sources
15.1 Customization Offerings
15.2 Subscription Services
15.3 Related Reports
15.4 Publisher Expertise
LIST OF TABLES
Table 1 Market Segmentation Analysis
Table 2 Global Air Care Market Share of Leading Companies, 2023
Table 3 Product Offerings of Leading Companies
Table 4 Low Growth Scenario Forecasts
Table 5 Reference Case Growth Scenario
Table 6 High Growth Case Scenario
Table 7 Global Air Care Revenue (USD Million) And CAGR (%) By Type (2021-2032)
Table 8 Global Air Care Revenue (USD Million) And CAGR (%) By Application (2021-2032)
Table 9 Global Air Care Revenue (USD Million) And CAGR (%) By Product (2021-2032)
Table 10 Global Air Care Market Revenue (USD Million) By Regions (2021-2032)
Table 11 Global Air Care Market Share (%) By Regions (2021-2032)
Table 12 North America Air Care Revenue (USD Million) By Country (2021-2032)
Table 13 Europe Air Care Revenue (USD Million) By Country (2021-2032)
Table 14 Asia Pacific Air Care Revenue (USD Million) By Country (2021-2032)
Table 15 South America Air Care Revenue (USD Million) By Country (2021-2032)
Table 16 Middle East and Africa Air Care Revenue (USD Million) By Region (2021-2032)
Table 17 North America Air Care Revenue (USD Million) By Type (2021-2032)
Table 18 North America Air Care Revenue (USD Million) By Application (2021-2032)
Table 19 North America Air Care Revenue (USD Million) By Product (2021-2032)
Table 20 Europe Air Care Revenue (USD Million) By Type (2021-2032)
Table 21 Europe Air Care Revenue (USD Million) By Application (2021-2032)
Table 22 Europe Air Care Revenue (USD Million) By Product (2021-2032)
Table 23 Asia Pacific Air Care Revenue (USD Million) By Type (2021-2032)
Table 24 Asia Pacific Air Care Revenue (USD Million) By Application (2021-2032)
Table 25 Asia Pacific Air Care Revenue (USD Million) By Product (2021-2032)
Table 26 South America Air Care Revenue (USD Million) By Type (2021-2032)
Table 27 South America Air Care Revenue (USD Million) By Application (2021-2032)
Table 28 South America Air Care Revenue (USD Million) By Product (2021-2032)
Table 29 Middle East and Africa Air Care Revenue (USD Million) By Type (2021-2032)
Table 30 Middle East and Africa Air Care Revenue (USD Million) By Application (2021-2032)
Table 31 Middle East and Africa Air Care Revenue (USD Million) By Product (2021-2032)
LIST OF FIGURES
Figure 1. Market Scope
Figure 2. Pricing Forecasts Per Unit, 2023- 2032
Figure 3. Porter’s Five Forces
Figure 4. Global Air Care Market Revenue (USD Million) By Regions (2021-2032)
Figure 5. Global Air Care Market Share (%) By Regions (2023)
Figure 6. North America Air Care Revenue (USD Million) By Country (2021-2032)
Figure 7. United States Air Care Revenue (USD Million) By Country (2021-2032)
Figure 8. Canada Air Care Revenue (USD Million) By Country (2021-2032)
Figure 9. Mexico Air Care Revenue (USD Million) By Country (2021-2032)
Figure 10. Europe Air Care Revenue (USD Million) By Country (2021-2032)
Figure 11. Germany Air Care Revenue (USD Million) By Country (2021-2032)
Figure 12. France Air Care Revenue (USD Million) By Country (2021-2032)
Figure 13. United Kingdom Air Care Revenue (USD Million) By Country (2021-2032)
Figure 14. Spain Air Care Revenue (USD Million) By Country (2021-2032)
Figure 15. Italy Air Care Revenue (USD Million) By Country (2021-2032)
Figure 16. Russia Air Care Revenue (USD Million) By Country (2021-2032)
Figure 17. Rest of Europe Air Care Revenue (USD Million) By Country (2021-2032)
Figure 11. Asia Pacific Air Care Revenue (USD Million) By Country (2021-2032)
Figure 12. China Air Care Revenue (USD Million) By Country (2021-2032)
Figure 13. Japan Air Care Revenue (USD Million) By Country (2021-2032)
Figure 14. India Air Care Revenue (USD Million) By Country (2021-2032)
Figure 15. South Korea Air Care Revenue (USD Million) By Country (2021-2032)
Figure 16. Australia Air Care Revenue (USD Million) By Country (2021-2032)
Figure 17. South East Asia Air Care Revenue (USD Million) By Country (2021-2032)
Figure 18. South America Air Care Revenue (USD Million) By Country (2021-2032)
Figure 19. Brazil Air Care Revenue (USD Million) By Country (2021-2032)
Figure 20. Argentina Air Care Revenue (USD Million) By Country (2021-2032)
Figure 21. Rest of Asia Pacific Air Care Revenue (USD Million) By Country (2021-2032)
Figure 22. Middle East and Africa Air Care Revenue (USD Million) By Region (2021-2032)
Figure 23. Saudi Arabia Air Care Revenue (USD Million) By Region (2021-2032)
Figure 24. The UAE Air Care Revenue (USD Million) By Region (2021-2032)
Figure 25. Rest of Middle East Air Care Revenue (USD Million) By Region (2021-2032)
Figure 26. South Africa Air Care Revenue (USD Million) By Region (2021-2032)
Figure 27. Africa Air Care Revenue (USD Million) By Region (2021-2032)
Figure 28. North America Air Care Revenue (USD Million) By Type (2021-2032)
Figure 29. North America Air Care Revenue (USD Million) By Application (2021-2032)
Figure 30. North America Air Care Revenue (USD Million) By Product (2021-2032)
Figure 31. Europe Air Care Revenue (USD Million) By Type (2021-2032)
Figure 32. Europe Air Care Revenue (USD Million) By Application (2021-2032)
Figure 33. Europe Air Care Revenue (USD Million) By Product (2021-2032)
Figure 34. Asia Pacific Air Care Revenue (USD Million) By Type (2021-2032)
Figure 35. Asia Pacific Air Care Revenue (USD Million) By Application (2021-2032)
Figure 36. Asia Pacific Air Care Revenue (USD Million) By Product (2021-2032)
Figure 37. South America Air Care Revenue (USD Million) By Type (2021-2032)
Figure 38. South America Air Care Revenue (USD Million) By Application (2021-2032)
Figure 39. South America Air Care Revenue (USD Million) By Product (2021-2032)
Figure 40. Middle East and Africa Air Care Revenue (USD Million) By Type (2021-2032)
Figure 41. Middle East and Africa Air Care Revenue (USD Million) By Application (2021-2032)
Figure 42. Middle East and Africa Air Care Revenue (USD Million) By Product (2021-2032)
By Type
Air freshener sprays
Electric air fresheners
Car air fresheners
Air freshener gels
Others
By Distribution Channel
Offline
Online
Countries Analyzed
North America (US, Canada, Mexico)
Europe (Germany, UK, France, Spain, Italy, Russia, Rest of Europe)
Asia Pacific (China, India, Japan, South Korea, Australia, South East Asia, Rest of Asia)
South America (Brazil, Argentina, Rest of South America)
Middle East and Africa (Saudi Arabia, UAE, Rest of Middle East, South Africa, Egypt, Rest of Africa)
