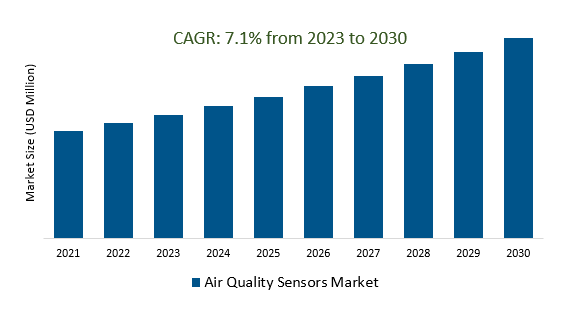
The global Air Quality Sensors Market Size is estimated to register 7.1% growth over the forecast period from 2023 to 2030.
The market growth is driven predominantly by Increasing awareness about the detrimental effects of air pollution on health and the environment is driving the demand for air quality sensors. Governments, organizations, and individuals are seeking real-time data to monitor air quality and make informed decisions. Leading companies are focusing on Technological Advancements, Internet of Things (IoT) Integration, Remote Monitoring and Data Analytics, Wearable and Personalized Sensors, Indoor Air Quality Focus, Global Market Expansion, Environmental Sustainability, and others to boost market shares in the industry. Leading companies are focusing on the
The Air Quality Sensors Market involves the production and distribution of sensors that measure air pollutants for applications in environmental monitoring, health, industries, smart cities, and more. These sensors, utilizing advanced technologies and IoT integration, provide real-time data to individuals, governments, and industries for informed decision-making. Factors such as increasing pollution awareness, regulatory requirements, and technological advancements are driving market growth, with key players including Aeroqual, Honeywell, Sensirion, and Siemens. As demand rises for clean air and sustainable practices, the market's expansion across sectors and integration with smart systems is anticipated to continue.
Market Trends- Companies are launching Urbanization and Industrialization to attract a consumer base
Urbanization and industrialization are significant drivers for the Air Quality Sensors Market. As cities expand and industries grow, the demand for air quality monitoring increases due to heightened pollution risks. Urbanization leads to concentrated populations, resulting in higher emissions and pollution sources, necessitating the deployment of air quality sensors to assess and manage pollution levels. Industrialization brings about increased manufacturing, energy consumption, and transportation, contributing to air pollution. Air quality sensors play a vital role in tracking emissions, ensuring worker safety, and complying with environmental regulations. Both urbanization and industrialization amplify the need for accurate real-time data, positioning air quality sensors as essential tools for maintaining healthier urban environments and sustainable industrial operations.
Indoor Air Quality (IAQ) monitoring is a growing segment within the Air Quality Sensors Market. As people spend a significant amount of time indoors, concerns about indoor air pollutants have risen. IAQ sensors are designed to detect pollutants like volatile organic compounds (VOCs), particulate matter (PM2.5), carbon dioxide (CO2), and more. These sensors are integrated into residential, commercial, and industrial settings, helping occupants assess and improve indoor air quality for health and comfort. The increasing emphasis on well-being and productivity has driven the demand for IAQ sensors, leading to their integration with smart home systems and building automation. The market's expansion in IAQ monitoring reflects the importance of creating healthy indoor environments amid urbanization and modern living trends.
Market Opportunity-Introduction of Demand for Wearable Sensors
Wearable sensors are a notable innovation within the Air Quality Sensors Market. These sensors, designed to be worn by individuals, provide real-time air quality data specific to the wearer's immediate surroundings. Wearable air quality sensors offer a personalized solution for monitoring exposure to pollutants, allowing users to make informed decisions about outdoor activities and protective measures. These sensors can measure pollutants like particulate matter, volatile organic compounds, and more, enhancing public awareness of air quality's impact on health. Wearable sensors align with the growing trend of health and wellness tracking, integrating air quality data with overall lifestyle management. The market's shift toward wearables signifies a proactive approach to addressing air pollution concerns and fostering healthier living environments.
The global Air Quality Sensors Market is analyzed across Multi-gas Monitoring Sensors and Signal-gas Monitoring Sensor types. Of these, the Multi-gas Monitoring Sensor is poised to register the fastest growth. Multi-gas monitoring sensors are a significant development in the Air Quality Sensors Market. These sensors are designed to simultaneously detect and measure multiple gases, including pollutants like carbon dioxide (CO2), carbon monoxide (CO), nitrogen dioxide (NO2), sulfur dioxide (SO2), and more. By providing comprehensive data on various pollutants in real-time, multi-gas sensors offer a holistic view of air quality, making them valuable for industrial, commercial, and environmental applications. Industries can ensure compliance with regulations, monitor workplace safety, and optimize operations.
Market Share Analysis- Power Plants held a significant market share in 2023
The global Air Quality Sensors Market is analyzed across a wide range of industries including Residential, Commercial, Government Agencies, Power Plants, and Others. Of these, the industry held a significant market share in 2023. Power plants play a significant role in driving the Air Quality Sensors Market. These facilities, which generate energy through various processes, often emit pollutants such as sulfur dioxide (SO2), nitrogen oxides (NOx), particulate matter (PM), and volatile organic compounds (VOCs). To meet environmental regulations and ensure public health, power plants increasingly utilize air quality sensors to monitor emissions, assess pollution levels, and implement effective mitigation strategies. Continuous monitoring enables power plants to optimize their operations, reduce emissions, and demonstrate compliance with air quality standards. The integration of advanced sensor technologies in power plants underscores the industry's commitment to cleaner energy production and environmental sustainability, thus propelling the growth of the air quality sensors market.
Air Quality Sensors Market Segmentation
By Type
- Signal-gas Monitoring Sensor
- Multi-gas Monitoring Sensor
By Industry
- Residential
- Commercial
- Government Agencies
- Power Plants
- Others
By Technology
- Non-Dispersive Infrared Radiation Sensors
- Electrochemical Sensors
- Electroacoustic Sensors
- Others
By End-user
- Residential
- Commercial
- Government Agencies
- Academic institutes
- Others
By Region
- North America (United States, Canada, Mexico)
- Europe (Germany, France, United Kingdom, Spain, Italy, Others)
- Asia Pacific (China, India, Japan, South Korea, Australia, Others)
- Latin America (Brazil, Argentina, Others)
- Middle East and Africa (Saudi Arabia, UAE, Kuwait, Other Middle East, South Africa, Nigeria, Other Africa)
Air Quality Sensors Market Companies
- Energomonitors.r. o
- Met One Instruments Inc.
- SUEZ
- Renesas Electronics Corporation
- Sensirion AG
- Zhengzhou Winsen Electronics Technology Co., Ltd
- Aeroqual Ltd
- Siemens AG
- Honeywell International Inc.
- Schneider Electric
* List not exhaustive
Air Quality Sensors Market Outlook 2023
1 Market Overview
1.1 Introduction to the Air Quality Sensors Market
1.2 Scope of the Study
1.3 Research Objective
1.3.1 Key Market Scope and Segments
1.3.2 Players Covered
1.3.3 Years Considered
2 Executive Summary
2.1 2023 Air Quality Sensors Industry- Market Statistics
3 Market Dynamics
3.1 Market Drivers
3.2 Market Challenges
3.3 Market Opportunities
3.4 Market Trends
4 Market Factor Analysis
4.1 Porter’s Five Forces
4.2 Market Entropy
4.2.1 Global Air Quality Sensors Market Companies with Area Served
4.2.2 Products Offerings Global Air Quality Sensors Market
5 COVID-19 Impact Analysis and Outlook Scenarios
5.1.1 Covid-19 Impact Analysis
5.1.2 Post-COVID-19 Scenario- Low Growth Case
5.1.3 Post-COVID-19 Scenario- Reference Growth Case
5.1.4 Post-COVID-19 Scenario- Low Growth Case
6 Global Air Quality Sensors Market Trends
6.1 Global Air Quality Sensors Revenue (USD Million) and CAGR (%) by Type (2018-2030)
6.2 Global Air Quality Sensors Revenue (USD Million) and CAGR (%) by Applications (2018-2030)
6.3 Global Air Quality Sensors Revenue (USD Million) and CAGR (%) by Regions (2018-2030)
7 Global Air Quality Sensors Market Revenue (USD Million) by Type, and Applications (2018-2022)
7.1 Global Air Quality Sensors Revenue (USD Million) by Type (2018-2022)
7.1.1 Global Air Quality Sensors Revenue (USD Million), Market Share (%) by Type (2018-2022)
7.2 Global Air Quality Sensors Revenue (USD Million) by Applications (2018-2022)
7.2.1 Global Air Quality Sensors Revenue (USD Million), Market Share (%) by Applications (2018-2022)
8 Global Air Quality Sensors Development Regional Status and Outlook
8.1 Global Air Quality Sensors Revenue (USD Million) By Regions (2018-2022)
8.2 North America Air Quality Sensors Revenue (USD Million) by Type, and Application (2018-2022)
8.2.1 North America Air Quality Sensors Revenue (USD Million) by Country (2018-2022)
8.2.2 North America Air Quality Sensors Revenue (USD Million) by Type (2018-2022)
8.2.3 North America Air Quality Sensors Revenue (USD Million) by Applications (2018-2022)
8.3 Europe Air Quality Sensors Revenue (USD Million), by Type, and Applications (USD Million) (2018-2022)
8.3.1 Europe Air Quality Sensors Revenue (USD Million), by Country (2018-2022)
8.3.2 Europe Air Quality Sensors Revenue (USD Million) by Type (2018-2022)
8.3.3 Europe Air Quality Sensors Revenue (USD Million) by Applications (2018-2022)
8.4 Asia Pacific Air Quality Sensors Revenue (USD Million), and Revenue (USD Million) by Type, and Applications (2018-2022)
8.4.1 Asia Pacific Air Quality Sensors Revenue (USD Million) by Country (2018-2022)
8.4.2 Asia Pacific Air Quality Sensors Revenue (USD Million) by Type (2018-2022)
8.4.3 Asia Pacific Air Quality Sensors Revenue (USD Million) by Applications (2018-2022)
8.5 South America Air Quality Sensors Revenue (USD Million), by Type, and Applications (2018-2022)
8.5.1 South America Air Quality Sensors Revenue (USD Million), by Country (2018-2022)
8.5.2 South America Air Quality Sensors Revenue (USD Million) by Type (2018-2022)
8.5.3 South America Air Quality Sensors Revenue (USD Million) by Applications (2018-2022)
8.6 Middle East and Africa Air Quality Sensors Revenue (USD Million), by Type, Technology, Application, Thickness (2018-2022)
8.6.1 Middle East and Africa Air Quality Sensors Revenue (USD Million) by Country (2018-2022)
8.6.2 Middle East and Africa Air Quality Sensors Revenue (USD Million) by Type (2018-2022)
8.6.3 Middle East and Africa Air Quality Sensors Revenue (USD Million) by Applications (2018-2022)
9 Company Profiles
10 Global Air Quality Sensors Market Revenue (USD Million), by Type, and Applications (2023-2030)
10.1 Global Air Quality Sensors Revenue (USD Million) and Market Share (%) by Type (2023-2030)
10.1.1 Global Air Quality Sensors Revenue (USD Million), and Market Share (%) by Type (2023-2030)
10.2 Global Air Quality Sensors Revenue (USD Million) and Market Share (%) by Applications (2023-2030)
10.2.1 Global Air Quality Sensors Revenue (USD Million), and Market Share (%) by Applications (2023-2030)
11 Global Air Quality Sensors Development Regional Status and Outlook Forecast
11.1 Global Air Quality Sensors Revenue (USD Million) By Regions (2023-2030)
11.2 North America Air Quality Sensors Revenue (USD Million) by Type, and Applications (2023-2030)
11.2.1 North America Air Quality Sensors Revenue (USD) Million by Country (2023-2030)
11.2.2 North America Air Quality Sensors Revenue (USD Million), by Type (2023-2030)
11.2.3 North America Air Quality Sensors Revenue (USD Million), Market Share (%) by Applications (2023-2030)
11.3 Europe Air Quality Sensors Revenue (USD Million), by Type, and Applications (2023-2030)
11.3.1 Europe Air Quality Sensors Revenue (USD Million), by Country (2023-2030)
11.3.2 Europe Air Quality Sensors Revenue (USD Million), by Type (2023-2030)
11.3.3 Europe Air Quality Sensors Revenue (USD Million), by Applications (2023-2030)
11.4 Asia Pacific Air Quality Sensors Revenue (USD Million) by Type, and Applications (2023-2030)
11.4.1 Asia Pacific Air Quality Sensors Revenue (USD Million), by Country (2023-2030)
11.4.2 Asia Pacific Air Quality Sensors Revenue (USD Million), by Type (2023-2030)
11.4.3 Asia Pacific Air Quality Sensors Revenue (USD Million), by Applications (2023-2030)
11.5 South America Air Quality Sensors Revenue (USD Million), by Type, and Applications (2023-2030)
11.5.1 South America Air Quality Sensors Revenue (USD Million), by Country (2023-2030)
11.5.2 South America Air Quality Sensors Revenue (USD Million), by Type (2023-2030)
11.5.3 South America Air Quality Sensors Revenue (USD Million), by Applications (2023-2030)
11.6 Middle East and Africa Air Quality Sensors Revenue (USD Million), by Type, and Applications (2023-2030)
11.6.1 Middle East and Africa Air Quality Sensors Revenue (USD Million), by Region (2023-2030)
11.6.2 Middle East and Africa Air Quality Sensors Revenue (USD Million), by Type (2023-2030)
11.6.3 Middle East and Africa Air Quality Sensors Revenue (USD Million), by Applications (2023-2030)
12 Methodology and Data Sources
12.1 Methodology/Research Approach
12.1.1 Research Programs/Design
12.1.2 Market Size Estimation
12.1.3 Market Breakdown and Data Triangulation
12.2 Data Sources
12.2.1 Secondary Sources
12.2.2 Primary Sources
12.3 Disclaimer
List of Tables
Table 1 Market Segmentation Analysis
Table 2 Global Air Quality Sensors Market Companies with Areas Served
Table 3 Products Offerings Global Air Quality Sensors Market
Table 4 Low Growth Scenario Forecasts
Table 5 Reference Case Growth Scenario
Table 6 High Growth Case Scenario
Table 7 Global Air Quality Sensors Revenue (USD Million) And CAGR (%) By Type (2018-2030)
Table 8 Global Air Quality Sensors Revenue (USD Million) And CAGR (%) By Applications (2018-2030)
Table 9 Global Air Quality Sensors Revenue (USD Million) And CAGR (%) By Regions (2018-2030)
Table 10 Global Air Quality Sensors Revenue (USD Million) By Type (2018-2022)
Table 11 Global Air Quality Sensors Revenue Market Share (%) By Type (2018-2022)
Table 12 Global Air Quality Sensors Revenue (USD Million) By Applications (2018-2022)
Table 13 Global Air Quality Sensors Revenue Market Share (%) By Applications (2018-2022)
Table 14 Global Air Quality Sensors Market Revenue (USD Million) By Regions (2018-2022)
Table 15 Global Air Quality Sensors Market Share (%) By Regions (2018-2022)
Table 16 North America Air Quality Sensors Revenue (USD Million) By Country (2018-2022)
Table 17 North America Air Quality Sensors Revenue (USD Million) By Type (2018-2022)
Table 18 North America Air Quality Sensors Revenue (USD Million) By Applications (2018-2022)
Table 19 Europe Air Quality Sensors Revenue (USD Million) By Country (2018-2022)
Table 20 Europe Air Quality Sensors Revenue (USD Million) By Type (2018-2022)
Table 21 Europe Air Quality Sensors Revenue (USD Million) By Applications (2018-2022)
Table 22 Asia Pacific Air Quality Sensors Revenue (USD Million) By Country (2018-2022)
Table 23 Asia Pacific Air Quality Sensors Revenue (USD Million) By Type (2018-2022)
Table 24 Asia Pacific Air Quality Sensors Revenue (USD Million) By Applications (2018-2022)
Table 25 South America Air Quality Sensors Revenue (USD Million) By Country (2018-2022)
Table 26 South America Air Quality Sensors Revenue (USD Million) By Type (2018-2022)
Table 27 South America Air Quality Sensors Revenue (USD Million) By Applications (2018-2022)
Table 28 Middle East and Africa Air Quality Sensors Revenue (USD Million) By Region (2018-2022)
Table 29 Middle East and Africa Air Quality Sensors Revenue (USD Million) By Type (2018-2022)
Table 30 Middle East and Africa Air Quality Sensors Revenue (USD Million) By Applications (2018-2022)
Table 31 Financial Analysis
Table 32 Global Air Quality Sensors Revenue (USD Million) By Type (2023-2030)
Table 33 Global Air Quality Sensors Revenue Market Share (%) By Type (2023-2030)
Table 34 Global Air Quality Sensors Revenue (USD Million) By Applications (2023-2030)
Table 35 Global Air Quality Sensors Revenue Market Share (%) By Applications (2023-2030)
Table 36 Global Air Quality Sensors Market Revenue (USD Million), And Revenue (USD Million) By Regions (2023-2030)
Table 37 North America Air Quality Sensors Revenue (USD)By Country (2023-2030)
Table 38 North America Air Quality Sensors Revenue (USD Million) By Type (2023-2030)
Table 39 North America Air Quality Sensors Revenue (USD Million) By Applications (2023-2030)
Table 40 Europe Air Quality Sensors Revenue (USD Million) By Country (2023-2030)
Table 41 Europe Air Quality Sensors Revenue (USD Million) By Type (2023-2030)
Table 42 Europe Air Quality Sensors Revenue (USD Million) By Applications (2023-2030)
Table 43 Asia Pacific Air Quality Sensors Revenue (USD Million) By Country (2023-2030)
Table 44 Asia Pacific Air Quality Sensors Revenue (USD Million) By Type (2023-2030)
Table 45 Asia Pacific Air Quality Sensors Revenue (USD Million) By Applications (2023-2030)
Table 46 South America Air Quality Sensors Revenue (USD Million) By Country (2023-2030)
Table 47 South America Air Quality Sensors Revenue (USD Million) By Type (2023-2030)
Table 48 South America Air Quality Sensors Revenue (USD Million) By Applications (2023-2030)
Table 49 Middle East and Africa Air Quality Sensors Revenue (USD Million) By Region (2023-2030)
Table 50 Middle East and Africa Air Quality Sensors Revenue (USD Million) By Region (2023-2030)
Table 51 Middle East and Africa Air Quality Sensors Revenue (USD Million) By Type (2023-2030)
Table 52 Middle East and Africa Air Quality Sensors Revenue (USD Million) By Applications (2023-2030)
Table 53 Research Programs/Design for This Report
Table 54 Key Data Information from Secondary Sources
Table 55 Key Data Information from Primary Sources
List of Figures
Figure 1 Market Scope
Figure 2 Porter’s Five Forces
Figure 3 Global Air Quality Sensors Revenue (USD Million) By Type (2018-2022)
Figure 4 Global Air Quality Sensors Revenue Market Share (%) By Type (2022)
Figure 5 Global Air Quality Sensors Revenue (USD Million) By Applications (2018-2022)
Figure 6 Global Air Quality Sensors Revenue Market Share (%) By Applications (2022)
Figure 7 Global Air Quality Sensors Market Revenue (USD Million) By Regions (2018-2022)
Figure 8 Global Air Quality Sensors Market Share (%) By Regions (2022)
Figure 9 North America Air Quality Sensors Revenue (USD Million) By Country (2018-2022)
Figure 10 North America Air Quality Sensors Revenue (USD Million) By Type (2018-2022)
Figure 11 North America Air Quality Sensors Revenue (USD Million) By Applications (2018-2022)
Figure 12 Europe Air Quality Sensors Revenue (USD Million) By Country (2018-2022)
Figure 13 Europe Air Quality Sensors Revenue (USD Million) By Type (2018-2022)
Figure 14 Europe Air Quality Sensors Revenue (USD Million) By Applications (2018-2022)
Figure 15 Asia Pacific Air Quality Sensors Revenue (USD Million) By Country (2018-2022)
Figure 16 Asia Pacific Air Quality Sensors Revenue (USD Million) By Type (2018-2022)
Figure 17 Asia Pacific Air Quality Sensors Revenue (USD Million) By Applications (2018-2022)
Figure 18 South America Air Quality Sensors Revenue (USD Million) By Country (2018-2022)
Figure 19 South America Air Quality Sensors Revenue (USD Million) By Type (2018-2022)
Figure 20 South America Air Quality Sensors Revenue (USD Million) By Applications (2018-2022)
Figure 21 Middle East and Africa Air Quality Sensors Revenue (USD Million) By Region (2018-2022)
Figure 22 Middle East and Africa Air Quality Sensors Revenue (USD Million) By Type (2018-2022)
Figure 23 Middle East and Africa Air Quality Sensors Revenue (USD Million) By Applications (2018-2022)
Figure 24 Global Air Quality Sensors Revenue (USD Million) By Type (2023-2030)
Figure 25 Global Air Quality Sensors Revenue Market Share (%) By Type (2030)
Figure 26 Global Air Quality Sensors Revenue (USD Million) By Applications (2023-2030)
Figure 27 Global Air Quality Sensors Revenue Market Share (%) By Applications (2030)
Figure 28 Global Air Quality Sensors Market Revenue (USD Million) By Regions (2023-2030)
Figure 29 North America Air Quality Sensors Revenue (USD Million) By Country (2023-2030)
Figure 30 North America Air Quality Sensors Revenue (USD Million) By Type (2023-2030)
Figure 31 North America Air Quality Sensors Revenue (USD Million) By Applications (2023-2030)
Figure 32 Europe Air Quality Sensors Revenue (USD Million) By Country (2023-2030)
Figure 33 Europe Air Quality Sensors Revenue (USD Million) By Type (2023-2030)
Figure 34 Europe Air Quality Sensors Revenue (USD Million) By Applications (2023-2030)
Figure 35 Asia Pacific Air Quality Sensors Revenue (USD Million) By Country (2023-2030)
Figure 36 Asia Pacific Air Quality Sensors Revenue (USD Million) By Type (2023-2030)
Figure 37 Asia Pacific Air Quality Sensors Revenue (USD Million) By Applications (2023-2030)
Figure 38 South America Air Quality Sensors Revenue (USD Million) By Country (2023-2030)
Figure 39 South America Air Quality Sensors Revenue (USD Million) By Type (2023-2030)
Figure 40 South America Air Quality Sensors Revenue (USD Million) By Applications (2023-2030)
Figure 41 Middle East and Africa Air Quality Sensors Revenue (USD Million) By Region (2023-2030)
Figure 42 Middle East and Africa Air Quality Sensors Revenue (USD Million) By Region (2023-2030)
Figure 43 Middle East and Africa Air Quality Sensors Revenue (USD Million) By Type (2023-2030)
Figure 44 Middle East and Africa Air Quality Sensors Revenue (USD Million) By Applications (2023-2030)
Figure 45 Bottom-Up and Top-Down Approaches For This Report
Figure 46 Data Triangulation
