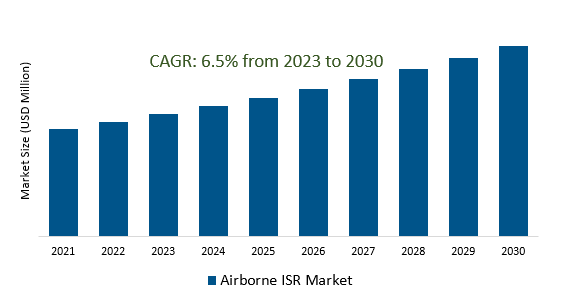
The Airborne ISR Market Size is estimated to register 6.5% growth over the forecast period from 2023 to 2030.
Airborne ISR Market Overview
Heightened geopolitical tensions, regional conflicts, and security threats globally are driving the demand for airborne ISR systems. Nations are seeking advanced ISR capabilities to monitor and respond to security challenges, enhancing situational awareness and decision-making. The increasing demand for real-time actionable intelligence to support military operations and missions fueling the demand. Further, increasing demand for persistent surveillance capabilities, requiring ISR platforms capable of extended flight durations, loitering capabilities, and long-endurance missions to monitor areas of interest continuously are driving the market growth. Multi-intelligence (Multi-INT) fusion involved in combining data from multiple sources such as radar, EO/IR (Electro-Optical/Infrared), SIGINT (Signals Intelligence), and others to generate a comprehensive situational awareness picture is increasing the market demand.
Airborne ISR Market Dynamics
Market Trends- Growing Adoption of Unmanned Aerial Vehicles (UAVs) in the Airborne ISR Market.
UAVs, commonly known as drones, are witnessing a rise in adoption owing to their versatility, cost-effectiveness, and operational advantages in ISR missions. Additionally, the increasing commercial applications beyond military use, such as in agriculture, infrastructure inspection, disaster response, and environmental monitoring are contributing to the growth in the market. Its smaller size, manoeuvrability, and capability to carry various sensor payloads are making them highly adaptable for different surveillance and reconnaissance, fuelling the demand.
Market Driver- Demand for Real-time Intelligence, Surveillance, and Reconnaissance (ISR) Data in Airborne ISR Market.
The necessity to gather, process, and disseminate real-time intelligence across various operational scenarios, enabling proactive decision-making and enhancing operational effectiveness are the prime factors. Businesses and defense entities are increasingly leveraging UAVs for ISR purposes due to their ability to operate in diverse environments, gather intelligence, and conduct surveillance without risking human lives. Further, the evolving nature of threats, heightened security concerns, and the need for comprehensive situational awareness are highly demanding the ISR platforms with cutting-edge sensor technologies, high-bandwidth communication systems, and sophisticated data analytics capabilities.
Market Opportunity- Expanding role in Environmental Monitoring and Disaster Response in the Airborne ISR Market.
The necessity to gather real-time data on environmental changes, natural disasters (such as hurricanes, wildfires, and floods), and their impact on communities and critical infrastructure are increasing the revenue. Additionally, the commercial applications of airborne ISR technologies for environmental purposes, such as assessing ecological changes, monitoring natural resources, and supporting conservation efforts are contributing to the market's growth. Further, various commercial sectors, such as agriculture, infrastructure inspection, and precision mapping are highly demanding ISR to track deforestation, monitoring pollution levels, and assessing damage.
Market Share Analysis - Target Tracking will register the fastest growth
The Airborne ISR Market is analyzed across Maritime Patrol, Rescue Operations, Target Tracking & Others. Target Tracking is poised to register the fastest growth. It involves the continuous monitoring and surveillance of targets, including vehicles, individuals, or objects, to gather critical intelligence or maintain situational awareness. Advanced target tracking technologies integrated into ISR platforms utilize various sensors such as radar, EO/IR (Electro-Optical/Infrared) cameras, and other sophisticated equipment to acquire and track targets accurately. These systems provide real-time information, enabling operators to observe and analyze movements, trajectories, and behaviors of targets within the surveillance area. It is crucial for both military and civilian applications to identify potential threats, monitoring adversaries activities, and supporting mission planning and execution, law enforcement, border control, and disaster response, target tracking facilitates monitoring and response to critical situations and incidents.
Market Share Analysis- Defense held a significant market share in 2023.
The Airborne ISR Market is analyzed across various End-users including Defense and Homeland Security. Of these, Defense held a significant market share in 2023. These systems employ a variety of sensors, imaging technologies, and communication systems integrated into aircraft or unmanned aerial vehicles (UAVs) to gather intelligence and provide a comprehensive understanding of the operational environment. They aid in enhancing situational awareness, enabling timely decision-making, and supporting various military operations, ranging from border surveillance, maritime patrol, and counterterrorism efforts to combat missions and peacekeeping operations. These systems provide critical data on enemy movements, terrain assessment, and potential threats, contributing to mission success and ensuring the safety of military personnel. Further, the evolution of defense-related ISR solutions focuses on improving the interoperability, endurance, and adaptability of airborne platforms to address evolving threats and complex operational environments.
Airborne ISR Market Segmentation
By Solution
- Systems
- Services
- Software
By Application
- Maritime Patrol
- Rescue Operations
- Target Tracking
- Others
By End-User
- Defense
- Homeland Security
By Region
- North America (United States, Canada, Mexico)
- Europe (Germany, France, United Kingdom, Spain, Italy, Others)
- Asia Pacific (China, India, Japan, South Korea, Australia, Others)
- Latin America (Brazil, Argentina, Others)
- Middle East and Africa (Saudi Arabia, UAE, Kuwait, Other Middle East, South Africa, Nigeria, Other Africa)
Airborne ISR Market Companies
- Bae Systems PLC (United Kingdom)
- Elbit Systems (Israel)
- L3Harris Technologies Inc (United States)
- Northrop Grumman (United States)
- Technologies Inc (United States)
- Leonardo S.p.A (Italy)
- Honeywell International (United States)
- Raytheon Technologies (United States)
- Lockheed Martin Corporation (United States)
- The Boeing Company (United States)
- Saab AB (Sweden)
- Airbus SE (Netherlands)
- General Dynamics Corporation (United States)
- Textron Inc (United States)
- Safran SA (France)
*List not exhaustive
Airborne ISR Market Outlook 2023
1 Market Overview
1.1 Introduction to the Airborne ISR Market
1.2 Scope of the Study
1.3 Research Objective
1.3.1 Key Market Scope and Segments
1.3.2 Players Covered
1.3.3 Years Considered
2 Executive Summary
2.1 2023 Airborne ISR Industry- Market Statistics
3 Market Dynamics
3.1 Market Drivers
3.2 Market Challenges
3.3 Market Opportunities
3.4 Market Trends
4 Market Factor Analysis
4.1 Porter’s Five Forces
4.2 Market Entropy
4.2.1 Global Airborne ISR Market Companies with Area Served
4.2.2 Products Offerings Global Airborne ISR Market
5 COVID-19 Impact Analysis and Outlook Scenarios
5.1.1 Covid-19 Impact Analysis
5.1.2 post-COVID-19 Scenario- Low Growth Case
5.1.3 post-COVID-19 Scenario- Reference Growth Case
5.1.4 post-COVID-19 Scenario- Low Growth Case
6 Global Airborne ISR Market Trends
6.1 Global Airborne ISR Revenue (USD Million) and CAGR (%) by Type (2018-2030)
6.2 Global Airborne ISR Revenue (USD Million) and CAGR (%) by Applications (2018-2030)
6.3 Global Airborne ISR Revenue (USD Million) and CAGR (%) by regions (2018-2030)
7 Global Airborne ISR Market Revenue (USD Million) by Type, and Applications (2018-2022)
7.1 Global Airborne ISR Revenue (USD Million) by Type (2018-2022)
7.1.1 Global Airborne ISR Revenue (USD Million), Market Share (%) by Type (2018-2022)
7.2 Global Airborne ISR Revenue (USD Million) by Applications (2018-2022)
7.2.1 Global Airborne ISR Revenue (USD Million), Market Share (%) by Applications (2018-2022)
8 Global Airborne ISR Development Regional Status and Outlook
8.1 Global Airborne ISR Revenue (USD Million) By Regions (2018-2022)
8.2 North America Airborne ISR Revenue (USD Million) by Type, and Application (2018-2022)
8.2.1 North America Airborne ISR Revenue (USD Million) by Country (2018-2022)
8.2.2 North America Airborne ISR Revenue (USD Million) by Type (2018-2022)
8.2.3 North America Airborne ISR Revenue (USD Million) by Applications (2018-2022)
8.3 Europe Airborne ISR Revenue (USD Million), by Type, and Applications (USD Million) (2018-2022)
8.3.1 Europe Airborne ISR Revenue (USD Million), by Country (2018-2022)
8.3.2 Europe Airborne ISR Revenue (USD Million) by Type (2018-2022)
8.3.3 Europe Airborne ISR Revenue (USD Million) by Applications (2018-2022)
8.4 Asia Pacific Airborne ISR Revenue (USD Million), and Revenue (USD Million) by Type, and Applications (2018-2022)
8.4.1 Asia Pacific Airborne ISR Revenue (USD Million) by Country (2018-2022)
8.4.2 Asia Pacific Airborne ISR Revenue (USD Million) by Type (2018-2022)
8.4.3 Asia Pacific Airborne ISR Revenue (USD Million) by Applications (2018-2022)
8.5 South America Airborne ISR Revenue (USD Million), by Type, and Applications (2018-2022)
8.5.1 South America Airborne ISR Revenue (USD Million), by Country (2018-2022)
8.5.2 South America Airborne ISR Revenue (USD Million) by Type (2018-2022)
8.5.3 South America Airborne ISR Revenue (USD Million) by Applications (2018-2022)
8.6 Middle East and Africa Airborne ISR Revenue (USD Million), by Type, Technology, Application, Thickness (2018-2022)
8.6.1 Middle East and Africa Airborne ISR Revenue (USD Million) by Country (2018-2022)
8.6.2 Middle East and Africa Airborne ISR Revenue (USD Million) by Type (2018-2022)
8.6.3 Middle East and Africa Airborne ISR Revenue (USD Million) by Applications (2018-2022)
9 Company Profiles
10 Global Airborne ISR Market Revenue (USD Million), by Type, and Applications (2023-2030)
10.1 Global Airborne ISR Revenue (USD Million) and Market Share (%) by Type (2023-2030)
10.1.1 Global Airborne ISR Revenue (USD Million), and Market Share (%) by Type (2023-2030)
10.2 Global Airborne ISR Revenue (USD Million) and Market Share (%) by Applications (2023-2030)
10.2.1 Global Airborne ISR Revenue (USD Million), and Market Share (%) by Applications (2023-2030)
11 Global Airborne ISR Development Regional Status and Outlook Forecast
11.1 Global Airborne ISR Revenue (USD Million) By Regions (2023-2030)
11.2 North America Airborne ISR Revenue (USD Million) by Type, and Applications (2023-2030)
11.2.1 North America Airborne ISR Revenue (USD) Million by Country (2023-2030)
11.2.2 North America Airborne ISR Revenue (USD Million), by Type (2023-2030)
11.2.3 North America Airborne ISR Revenue (USD Million), Market Share (%) by Applications (2023-2030)
11.3 Europe Airborne ISR Revenue (USD Million), by Type, and Applications (2023-2030)
11.3.1 Europe Airborne ISR Revenue (USD Million), by Country (2023-2030)
11.3.2 Europe Airborne ISR Revenue (USD Million), by Type (2023-2030)
11.3.3 Europe Airborne ISR Revenue (USD Million), by Applications (2023-2030)
11.4 Asia Pacific Airborne ISR Revenue (USD Million) by Type, and Applications (2023-2030)
11.4.1 Asia Pacific Airborne ISR Revenue (USD Million), by Country (2023-2030)
11.4.2 Asia Pacific Airborne ISR Revenue (USD Million), by Type (2023-2030)
11.4.3 Asia Pacific Airborne ISR Revenue (USD Million), by Applications (2023-2030)
11.5 South America Airborne ISR Revenue (USD Million), by Type, and Applications (2023-2030)
11.5.1 South America Airborne ISR Revenue (USD Million), by Country (2023-2030)
11.5.2 South America Airborne ISR Revenue (USD Million), by Type (2023-2030)
11.5.3 South America Airborne ISR Revenue (USD Million), by Applications (2023-2030)
11.6 Middle East and Africa Airborne ISR Revenue (USD Million), by Type, and Applications (2023-2030)
11.6.1 Middle East and Africa Airborne ISR Revenue (USD Million), by region (2023-2030)
11.6.2 Middle East and Africa Airborne ISR Revenue (USD Million), by Type (2023-2030)
11.6.3 Middle East and Africa Airborne ISR Revenue (USD Million), by Applications (2023-2030)
12 Methodology and Data Sources
12.1 Methodology/Research Approach
12.1.1 Research Programs/Design
12.1.2 Market Size Estimation
12.1.3 Market Breakdown and Data Triangulation
12.2 Data Sources
12.2.1 Secondary Sources
12.2.2 Primary Sources
12.3 Disclaimer
List of Tables
Table 1 Market Segmentation Analysis
Table 2 Global Airborne ISR Market Companies with Areas Served
Table 3 Products Offerings Global Airborne ISR Market
Table 4 Low Growth Scenario Forecasts
Table 5 Reference Case Growth Scenario
Table 6 High Growth Case Scenario
Table 7 Global Airborne ISR Revenue (USD Million) And CAGR (%) By Type (2018-2030)
Table 8 Global Airborne ISR Revenue (USD Million) And CAGR (%) By Applications (2018-2030)
Table 9 Global Airborne ISR Revenue (USD Million) And CAGR (%) By Regions (2018-2030)
Table 10 Global Airborne ISR Revenue (USD Million) By Type (2018-2022)
Table 11 Global Airborne ISR Revenue Market Share (%) By Type (2018-2022)
Table 12 Global Airborne ISR Revenue (USD Million) By Applications (2018-2022)
Table 13 Global Airborne ISR Revenue Market Share (%) By Applications (2018-2022)
Table 14 Global Airborne ISR Market Revenue (USD Million) By Regions (2018-2022)
Table 15 Global Airborne ISR Market Share (%) By Regions (2018-2022)
Table 16 North America Airborne ISR Revenue (USD Million) By Country (2018-2022)
Table 17 North America Airborne ISR Revenue (USD Million) By Type (2018-2022)
Table 18 North America Airborne ISR Revenue (USD Million) By Applications (2018-2022)
Table 19 Europe Airborne ISR Revenue (USD Million) By Country (2018-2022)
Table 20 Europe Airborne ISR Revenue (USD Million) By Type (2018-2022)
Table 21 Europe Airborne ISR Revenue (USD Million) By Applications (2018-2022)
Table 22 Asia Pacific Airborne ISR Revenue (USD Million) By Country (2018-2022)
Table 23 Asia Pacific Airborne ISR Revenue (USD Million) By Type (2018-2022)
Table 24 Asia Pacific Airborne ISR Revenue (USD Million) By Applications (2018-2022)
Table 25 South America Airborne ISR Revenue (USD Million) By Country (2018-2022)
Table 26 South America Airborne ISR Revenue (USD Million) By Type (2018-2022)
Table 27 South America Airborne ISR Revenue (USD Million) By Applications (2018-2022)
Table 28 Middle East and Africa Airborne ISR Revenue (USD Million) By Region (2018-2022)
Table 29 Middle East and Africa Airborne ISR Revenue (USD Million) By Type (2018-2022)
Table 30 Middle East and Africa Airborne ISR Revenue (USD Million) By Applications (2018-2022)
Table 31 Financial Analysis
Table 32 Global Airborne ISR Revenue (USD Million) By Type (2023-2030)
Table 33 Global Airborne ISR Revenue Market Share (%) By Type (2023-2030)
Table 34 Global Airborne ISR Revenue (USD Million) By Applications (2023-2030)
Table 35 Global Airborne ISR Revenue Market Share (%) By Applications (2023-2030)
Table 36 Global Airborne ISR Market Revenue (USD Million), And Revenue (USD Million) By Regions (2023-2030)
Table 37 North America Airborne ISR Revenue (USD)By Country (2023-2030)
Table 38 North America Airborne ISR Revenue (USD Million) By Type (2023-2030)
Table 39 North America Airborne ISR Revenue (USD Million) By Applications (2023-2030)
Table 40 Europe Airborne ISR Revenue (USD Million) By Country (2023-2030)
Table 41 Europe Airborne ISR Revenue (USD Million) By Type (2023-2030)
Table 42 Europe Airborne ISR Revenue (USD Million) By Applications (2023-2030)
Table 43 Asia Pacific Airborne ISR Revenue (USD Million) By Country (2023-2030)
Table 44 Asia Pacific Airborne ISR Revenue (USD Million) By Type (2023-2030)
Table 45 Asia Pacific Airborne ISR Revenue (USD Million) By Applications (2023-2030)
Table 46 South America Airborne ISR Revenue (USD Million) By Country (2023-2030)
Table 47 South America Airborne ISR Revenue (USD Million) By Type (2023-2030)
Table 48 South America Airborne ISR Revenue (USD Million) By Applications (2023-2030)
Table 49 Middle East and Africa Airborne ISR Revenue (USD Million) By Region (2023-2030)
Table 50 Middle East and Africa Airborne ISR Revenue (USD Million) By Region (2023-2030)
Table 51 Middle East and Africa Airborne ISR Revenue (USD Million) By Type (2023-2030)
Table 52 Middle East and Africa Airborne ISR Revenue (USD Million) By Applications (2023-2030)
Table 53 Research Programs/Design for This Report
Table 54 Key Data Information from Secondary Sources
Table 55 Key Data Information from Primary Sources
List of Figures
Figure 1 Market Scope
Figure 2 Porter’s Five Forces
Figure 3 Global Airborne ISR Revenue (USD Million) By Type (2018-2022)
Figure 4 Global Airborne ISR Revenue Market Share (%) By Type (2022)
Figure 5 Global Airborne ISR Revenue (USD Million) By Applications (2018-2022)
Figure 6 Global Airborne ISR Revenue Market Share (%) By Applications (2022)
Figure 7 Global Airborne ISR Market Revenue (USD Million) By Regions (2018-2022)
Figure 8 Global Airborne ISR Market Share (%) By Regions (2022)
Figure 9 North America Airborne ISR Revenue (USD Million) By Country (2018-2022)
Figure 10 North America Airborne ISR Revenue (USD Million) By Type (2018-2022)
Figure 11 North America Airborne ISR Revenue (USD Million) By Applications (2018-2022)
Figure 12 Europe Airborne ISR Revenue (USD Million) By Country (2018-2022)
Figure 13 Europe Airborne ISR Revenue (USD Million) By Type (2018-2022)
Figure 14 Europe Airborne ISR Revenue (USD Million) By Applications (2018-2022)
Figure 15 Asia Pacific Airborne ISR Revenue (USD Million) By Country (2018-2022)
Figure 16 Asia Pacific Airborne ISR Revenue (USD Million) By Type (2018-2022)
Figure 17 Asia Pacific Airborne ISR Revenue (USD Million) By Applications (2018-2022)
Figure 18 South America Airborne ISR Revenue (USD Million) By Country (2018-2022)
Figure 19 South America Airborne ISR Revenue (USD Million) By Type (2018-2022)
Figure 20 South America Airborne ISR Revenue (USD Million) By Applications (2018-2022)
Figure 21 Middle East and Africa Airborne ISR Revenue (USD Million) By Region (2018-2022)
Figure 22 Middle East and Africa Airborne ISR Revenue (USD Million) By Type (2018-2022)
Figure 23 Middle East and Africa Airborne ISR Revenue (USD Million) By Applications (2018-2022)
Figure 24 Global Airborne ISR Revenue (USD Million) By Type (2023-2030)
Figure 25 Global Airborne ISR Revenue Market Share (%) By Type (2030)
Figure 26 Global Airborne ISR Revenue (USD Million) By Applications (2023-2030)
Figure 27 Global Airborne ISR Revenue Market Share (%) By Applications (2030)
Figure 28 Global Airborne ISR Market Revenue (USD Million) By Regions (2023-2030)
Figure 29 North America Airborne ISR Revenue (USD Million) By Country (2023-2030)
Figure 30 North America Airborne ISR Revenue (USD Million) By Type (2023-2030)
Figure 31 North America Airborne ISR Revenue (USD Million) By Applications (2023-2030)
Figure 32 Europe Airborne ISR Revenue (USD Million) By Country (2023-2030)
Figure 33 Europe Airborne ISR Revenue (USD Million) By Type (2023-2030)
Figure 34 Europe Airborne ISR Revenue (USD Million) By Applications (2023-2030)
Figure 35 Asia Pacific Airborne ISR Revenue (USD Million) By Country (2023-2030)
Figure 36 Asia Pacific Airborne ISR Revenue (USD Million) By Type (2023-2030)
Figure 37 Asia Pacific Airborne ISR Revenue (USD Million) By Applications (2023-2030)
Figure 38 South America Airborne ISR Revenue (USD Million) By Country (2023-2030)
Figure 39 South America Airborne ISR Revenue (USD Million) By Type (2023-2030)
Figure 40 South America Airborne ISR Revenue (USD Million) By Applications (2023-2030)
Figure 41 Middle East and Africa Airborne ISR Revenue (USD Million) By Region (2023-2030)
Figure 42 Middle East and Africa Airborne ISR Revenue (USD Million) By Region (2023-2030)
Figure 43 Middle East and Africa Airborne ISR Revenue (USD Million) By Type (2023-2030)
Figure 44 Middle East and Africa Airborne ISR Revenue (USD Million) By Applications (2023-2030)
Figure 45 Bottom-Up and Top-Down Approaches for This Report
Figure 46 Data Triangulation
