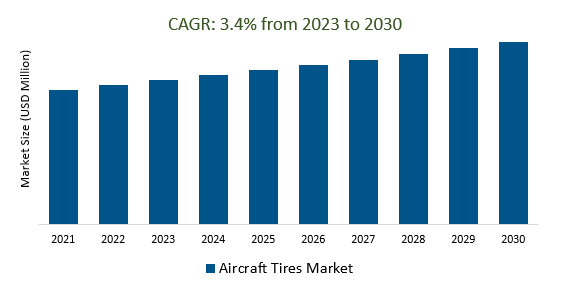
The Global Aircraft Tires Market Size is estimated to register 3.4% growth over the forecast period from 2023 to 2030.
The market growth is driven by the growth in air passenger traffic worldwide has been a significant driver for the aircraft tires market. More flights and increased aircraft utilization lead to higher demand for replacement tires. Leading companies that are focusing on increasing Air Travel, Fleet Expansion, Green Aviation, Increased Focus on Maintenance, Digitalization and Data Analytics, and others to boost market shares in the industry.
Market Overview
The Aircraft Tires Market, a significant segment of the aviation industry, is driven by global air travel growth, fleet expansion, technological advancements, and environmental concerns. Key players like Michelin, Bridgestone, Goodyear, and Dunlop cater to different aircraft types and applications. The market faces challenges including supply chain disruptions and regulatory compliance, but it is poised for growth, with innovations in tire technology, sustainability, and digital integration expected to shape its future.
Market Dynamics
Market Trends - Increased Focus on Safety Drives Demand for Advanced Technologies
Rising safety concerns in aviation are driving demand for advanced technologies in the Aircraft tire market, including improved tread patterns, advanced materials, and self-sealing tire technology. These innovations aim to enhance safety during takeoffs and landings, reduce tire-related incidents, and meet rigorous aviation safety standards, making safety a key driver shaping the market's future.
Market Driver- Growth in the Regional Aviation MarketDemand Aircraft Tires Market
The expansion of the regional aviation market is generating greater demand for specific aircraft tires, particularly for regional jets and turboprop aircraft, which is a key driver propelling growth in the Aircraft Tires Market.
Market Opportunity-Introduction of Technological Advancements
Technological advancements in the Aircraft Tires Market encompass lighter and fuel-efficient tire designs, enhanced tread patterns for better traction, increased durability, self-sealing tire technology, and digital monitoring systems. These innovations drive safety, efficiency, and maintenance improvements in the aviation industry, playing a pivotal role in shaping the market's future.
Market Share Analysis- Bias-ply Aircraft Tires Marketwill register the fastest growth
The Global Aircraft Tires Marketis analyzed across Radial-ply, Bias-ply, and others. Of these, Bias-ply is poised to register the fastest growth. Bias-ply tires are a significant component of the Aircraft Tires Market, valued for their robust construction with diagonal fabric cords. These tires are particularly well-suited for applications demanding high load-bearing capacity and durability, such as military and general aviation, even as radial tires gain popularity in commercial aviation for fuel efficiency.
Market Share Analysis- Commercial Aviation held a significant market share in 2023
The Global Aircraft Tires Marketis analyzed across a wide range of Aircraft Types including Commercial Aviation,Business and General Aviation, Military Aviation, and others. Of this Commercial Aviationheld a significant market share in 2023.Commercial aviation is a major driver of the Aircraft tire market, fueled by the high frequency of flights, regular tire wear during takeoffs and landings, and the necessity for passenger and cargo transportation. Airlines across various aircraft types rely on dependable tires for safe and smooth operations.
Aircraft Tires Market Segmentation
By Type
By Aircraft Type
- Military Aviation
- Business and General Aviation
- Commercial Aviation
By Platform
By Position
- Main Landing Tire
- Nose Landing Tire
By End-User
- OEMs
- Replacement
- Retreading
By Region
- North America (United States, Canada, Mexico)
- Europe (Germany, France, United Kingdom, Spain, Italy, and Others)
- Asia Pacific (China, India, Japan, South Korea, Australia, Others)
- Latin America (Brazil, Argentina, Others)
- Middle East and Africa (Saudi Arabia, UAE, Kuwait, Other Middle East, South Africa, Nigeria, Other Africa)
Aircraft Tires Market Companies
- Bridgestone Corporation (Japan)
- Goodyear Tire and Rubber Company (US)
- Michelin (France)
- Dunlop Aircraft Tyres Ltd. (UK)
- Wilkerson Aircraft Tires (US)
- Aviation Tires and Treads, LLC (US)
- Specialty Tires of America (US)
- Peltast Tire Corporation (Turkey)
- Qingdao Sentury Tires Company Limited (China)
*List not exhaustive
Aircraft Tires Market Outlook 2023
1 Market Overview
1.1 Introduction to the Aircraft Tires Market
1.2 Scope of the Study
1.3 Research Objective
1.3.1 Key Market Scope and Segments
1.3.2 Players Covered
1.3.3 Years Considered
2 Executive Summary
2.1 2023 Aircraft Tires Industry- Market Statistics
3 Market Dynamics
3.1 Market Drivers
3.2 Market Challenges
3.3 Market Opportunities
3.4 Market Trends
4 Market Factor Analysis
4.1 Porter’s Five Forces
4.2 Market Entropy
4.2.1 Global Aircraft Tires Market Companies with Area Served
4.2.2 Products Offerings Global Aircraft Tires Market
5 COVID-19 Impact Analysis and Outlook Scenarios
5.1.1 Covid-19 Impact Analysis
5.1.2 Post-COVID-19 Scenario- Low Growth Case
5.1.3 Post-COVID-19 Scenario- Reference Growth Case
5.1.4 Post-COVID-19 Scenario- Low Growth Case
6 Global Aircraft Tires Market Trends
6.1 Global Aircraft Tires Revenue (USD Million) and CAGR (%) by Type (2018-2030)
6.2 Global Aircraft Tires Revenue (USD Million) and CAGR (%) by Applications (2018-2030)
6.3 Global Aircraft Tires Revenue (USD Million) and CAGR (%) by Regions (2018-2030)
7 Global Aircraft Tires Market Revenue (USD Million) by Type, and Applications (2018-2022)
7.1 Global Aircraft Tires Revenue (USD Million) by Type (2018-2022)
7.1.1 Global Aircraft Tires Revenue (USD Million), Market Share (%) by Type (2018-2022)
7.2 Global Aircraft Tires Revenue (USD Million) by Applications (2018-2022)
7.2.1 Global Aircraft Tires Revenue (USD Million), Market Share (%) by Applications (2018-2022)
8 Global Aircraft Tires Development Regional Status and Outlook
8.1 Global Aircraft Tires Revenue (USD Million) By Regions (2018-2022)
8.2 North America Aircraft Tires Revenue (USD Million) by Type, and Application (2018-2022)
8.2.1 North America Aircraft Tires Revenue (USD Million) by Country (2018-2022)
8.2.2 North America Aircraft Tires Revenue (USD Million) by Type (2018-2022)
8.2.3 North America Aircraft Tires Revenue (USD Million) by Applications (2018-2022)
8.3 Europe Aircraft Tires Revenue (USD Million), by Type, and Applications (USD Million) (2018-2022)
8.3.1 Europe Aircraft Tires Revenue (USD Million), by Country (2018-2022)
8.3.2 Europe Aircraft Tires Revenue (USD Million) by Type (2018-2022)
8.3.3 Europe Aircraft Tires Revenue (USD Million) by Applications (2018-2022)
8.4 Asia Pacific Aircraft Tires Revenue (USD Million), and Revenue (USD Million) by Type, and Applications (2018-2022)
8.4.1 Asia Pacific Aircraft Tires Revenue (USD Million) by Country (2018-2022)
8.4.2 Asia Pacific Aircraft Tires Revenue (USD Million) by Type (2018-2022)
8.4.3 Asia Pacific Aircraft Tires Revenue (USD Million) by Applications (2018-2022)
8.5 South America Aircraft Tires Revenue (USD Million), by Type, and Applications (2018-2022)
8.5.1 South America Aircraft Tires Revenue (USD Million), by Country (2018-2022)
8.5.2 South America Aircraft Tires Revenue (USD Million) by Type (2018-2022)
8.5.3 South America Aircraft Tires Revenue (USD Million) by Applications (2018-2022)
8.6 Middle East and Africa Aircraft Tires Revenue (USD Million), by Type, Technology, Application, Thickness (2018-2022)
8.6.1 Middle East and Africa Aircraft Tires Revenue (USD Million) by Country (2018-2022)
8.6.2 Middle East and Africa Aircraft Tires Revenue (USD Million) by Type (2018-2022)
8.6.3 Middle East and Africa Aircraft Tires Revenue (USD Million) by Applications (2018-2022)
9 Company Profiles
10 Global Aircraft Tires Market Revenue (USD Million), by Type, and Applications (2023-2030)
10.1 Global Aircraft Tires Revenue (USD Million) and Market Share (%) by Type (2023-2030)
10.1.1 Global Aircraft Tires Revenue (USD Million), and Market Share (%) by Type (2023-2030)
10.2 Global Aircraft Tires Revenue (USD Million) and Market Share (%) by Applications (2023-2030)
10.2.1 Global Aircraft Tires Revenue (USD Million), and Market Share (%) by Applications (2023-2030)
11 Global Aircraft Tires Development Regional Status and Outlook Forecast
11.1 Global Aircraft Tires Revenue (USD Million) By Regions (2023-2030)
11.2 North America Aircraft Tires Revenue (USD Million) by Type, and Applications (2023-2030)
11.2.1 North America Aircraft Tires Revenue (USD) Million by Country (2023-2030)
11.2.2 North America Aircraft Tires Revenue (USD Million), by Type (2023-2030)
11.2.3 North America Aircraft Tires Revenue (USD Million), Market Share (%) by Applications (2023-2030)
11.3 Europe Aircraft Tires Revenue (USD Million), by Type, and Applications (2023-2030)
11.3.1 Europe Aircraft Tires Revenue (USD Million), by Country (2023-2030)
11.3.2 Europe Aircraft Tires Revenue (USD Million), by Type (2023-2030)
11.3.3 Europe Aircraft Tires Revenue (USD Million), by Applications (2023-2030)
11.4 Asia Pacific Aircraft Tires Revenue (USD Million) by Type, and Applications (2023-2030)
11.4.1 Asia Pacific Aircraft Tires Revenue (USD Million), by Country (2023-2030)
11.4.2 Asia Pacific Aircraft Tires Revenue (USD Million), by Type (2023-2030)
11.4.3 Asia Pacific Aircraft Tires Revenue (USD Million), by Applications (2023-2030)
11.5 South America Aircraft Tires Revenue (USD Million), by Type, and Applications (2023-2030)
11.5.1 South America Aircraft Tires Revenue (USD Million), by Country (2023-2030)
11.5.2 South America Aircraft Tires Revenue (USD Million), by Type (2023-2030)
11.5.3 South America Aircraft Tires Revenue (USD Million), by Applications (2023-2030)
11.6 Middle East and Africa Aircraft Tires Revenue (USD Million), by Type, and Applications (2023-2030)
11.6.1 Middle East and Africa Aircraft Tires Revenue (USD Million), by Region (2023-2030)
11.6.2 Middle East and Africa Aircraft Tires Revenue (USD Million), by Type (2023-2030)
11.6.3 Middle East and Africa Aircraft Tires Revenue (USD Million), by Applications (2023-2030)
12 Methodology and Data Sources
12.1 Methodology/Research Approach
12.1.1 Research Programs/Design
12.1.2 Market Size Estimation
12.1.3 Market Breakdown and Data Triangulation
12.2 Data Sources
12.2.1 Secondary Sources
12.2.2 Primary Sources
12.3 Disclaimer
List of Tables
Table 1 Market Segmentation Analysis
Table 2 Global Aircraft Tires Market Companies with Areas Served
Table 3 Products Offerings Global Aircraft Tires Market
Table 4 Low Growth Scenario Forecasts
Table 5 Reference Case Growth Scenario
Table 6 High Growth Case Scenario
Table 7 Global Aircraft Tires Revenue (USD Million) And CAGR (%) By Type (2018-2030)
Table 8 Global Aircraft Tires Revenue (USD Million) And CAGR (%) By Applications (2018-2030)
Table 9 Global Aircraft Tires Revenue (USD Million) And CAGR (%) By Regions (2018-2030)
Table 10 Global Aircraft Tires Revenue (USD Million) By Type (2018-2022)
Table 11 Global Aircraft Tires Revenue Market Share (%) By Type (2018-2022)
Table 12 Global Aircraft Tires Revenue (USD Million) By Applications (2018-2022)
Table 13 Global Aircraft Tires Revenue Market Share (%) By Applications (2018-2022)
Table 14 Global Aircraft Tires Market Revenue (USD Million) By Regions (2018-2022)
Table 15 Global Aircraft Tires Market Share (%) By Regions (2018-2022)
Table 16 North America Aircraft Tires Revenue (USD Million) By Country (2018-2022)
Table 17 North America Aircraft Tires Revenue (USD Million) By Type (2018-2022)
Table 18 North America Aircraft Tires Revenue (USD Million) By Applications (2018-2022)
Table 19 Europe Aircraft Tires Revenue (USD Million) By Country (2018-2022)
Table 20 Europe Aircraft Tires Revenue (USD Million) By Type (2018-2022)
Table 21 Europe Aircraft Tires Revenue (USD Million) By Applications (2018-2022)
Table 22 Asia Pacific Aircraft Tires Revenue (USD Million) By Country (2018-2022)
Table 23 Asia Pacific Aircraft Tires Revenue (USD Million) By Type (2018-2022)
Table 24 Asia Pacific Aircraft Tires Revenue (USD Million) By Applications (2018-2022)
Table 25 South America Aircraft Tires Revenue (USD Million) By Country (2018-2022)
Table 26 South America Aircraft Tires Revenue (USD Million) By Type (2018-2022)
Table 27 South America Aircraft Tires Revenue (USD Million) By Applications (2018-2022)
Table 28 Middle East and Africa Aircraft Tires Revenue (USD Million) By Region (2018-2022)
Table 29 Middle East and Africa Aircraft Tires Revenue (USD Million) By Type (2018-2022)
Table 30 Middle East and Africa Aircraft Tires Revenue (USD Million) By Applications (2018-2022)
Table 31 Financial Analysis
Table 32 Global Aircraft Tires Revenue (USD Million) By Type (2023-2030)
Table 33 Global Aircraft Tires Revenue Market Share (%) By Type (2023-2030)
Table 34 Global Aircraft Tires Revenue (USD Million) By Applications (2023-2030)
Table 35 Global Aircraft Tires Revenue Market Share (%) By Applications (2023-2030)
Table 36 Global Aircraft Tires Market Revenue (USD Million), And Revenue (USD Million) By Regions (2023-2030)
Table 37 North America Aircraft Tires Revenue (USD)By Country (2023-2030)
Table 38 North America Aircraft Tires Revenue (USD Million) By Type (2023-2030)
Table 39 North America Aircraft Tires Revenue (USD Million) By Applications (2023-2030)
Table 40 Europe Aircraft Tires Revenue (USD Million) By Country (2023-2030)
Table 41 Europe Aircraft Tires Revenue (USD Million) By Type (2023-2030)
Table 42 Europe Aircraft Tires Revenue (USD Million) By Applications (2023-2030)
Table 43 Asia Pacific Aircraft Tires Revenue (USD Million) By Country (2023-2030)
Table 44 Asia Pacific Aircraft Tires Revenue (USD Million) By Type (2023-2030)
Table 45 Asia Pacific Aircraft Tires Revenue (USD Million) By Applications (2023-2030)
Table 46 South America Aircraft Tires Revenue (USD Million) By Country (2023-2030)
Table 47 South America Aircraft Tires Revenue (USD Million) By Type (2023-2030)
Table 48 South America Aircraft Tires Revenue (USD Million) By Applications (2023-2030)
Table 49 Middle East and Africa Aircraft Tires Revenue (USD Million) By Region (2023-2030)
Table 50 Middle East and Africa Aircraft Tires Revenue (USD Million) By Region (2023-2030)
Table 51 Middle East and Africa Aircraft Tires Revenue (USD Million) By Type (2023-2030)
Table 52 Middle East and Africa Aircraft Tires Revenue (USD Million) By Applications (2023-2030)
Table 53 Research Programs/Design for This Report
Table 54 Key Data Information from Secondary Sources
Table 55 Key Data Information from Primary Sources
List of Figures
Figure 1 Market Scope
Figure 2 Porter’s Five Forces
Figure 3 Global Aircraft Tires Revenue (USD Million) By Type (2018-2022)
Figure 4 Global Aircraft Tires Revenue Market Share (%) By Type (2022)
Figure 5 Global Aircraft Tires Revenue (USD Million) By Applications (2018-2022)
Figure 6 Global Aircraft Tires Revenue Market Share (%) By Applications (2022)
Figure 7 Global Aircraft Tires Market Revenue (USD Million) By Regions (2018-2022)
Figure 8 Global Aircraft Tires Market Share (%) By Regions (2022)
Figure 9 North America Aircraft Tires Revenue (USD Million) By Country (2018-2022)
Figure 10 North America Aircraft Tires Revenue (USD Million) By Type (2018-2022)
Figure 11 North America Aircraft Tires Revenue (USD Million) By Applications (2018-2022)
Figure 12 Europe Aircraft Tires Revenue (USD Million) By Country (2018-2022)
Figure 13 Europe Aircraft Tires Revenue (USD Million) By Type (2018-2022)
Figure 14 Europe Aircraft Tires Revenue (USD Million) By Applications (2018-2022)
Figure 15 Asia Pacific Aircraft Tires Revenue (USD Million) By Country (2018-2022)
Figure 16 Asia Pacific Aircraft Tires Revenue (USD Million) By Type (2018-2022)
Figure 17 Asia Pacific Aircraft Tires Revenue (USD Million) By Applications (2018-2022)
Figure 18 South America Aircraft Tires Revenue (USD Million) By Country (2018-2022)
Figure 19 South America Aircraft Tires Revenue (USD Million) By Type (2018-2022)
Figure 20 South America Aircraft Tires Revenue (USD Million) By Applications (2018-2022)
Figure 21 Middle East and Africa Aircraft Tires Revenue (USD Million) By Region (2018-2022)
Figure 22 Middle East and Africa Aircraft Tires Revenue (USD Million) By Type (2018-2022)
Figure 23 Middle East and Africa Aircraft Tires Revenue (USD Million) By Applications (2018-2022)
Figure 24 Global Aircraft Tires Revenue (USD Million) By Type (2023-2030)
Figure 25 Global Aircraft Tires Revenue Market Share (%) By Type (2030)
Figure 26 Global Aircraft Tires Revenue (USD Million) By Applications (2023-2030)
Figure 27 Global Aircraft Tires Revenue Market Share (%) By Applications (2030)
Figure 28 Global Aircraft Tires Market Revenue (USD Million) By Regions (2023-2030)
Figure 29 North America Aircraft Tires Revenue (USD Million) By Country (2023-2030)
Figure 30 North America Aircraft Tires Revenue (USD Million) By Type (2023-2030)
Figure 31 North America Aircraft Tires Revenue (USD Million) By Applications (2023-2030)
Figure 32 Europe Aircraft Tires Revenue (USD Million) By Country (2023-2030)
Figure 33 Europe Aircraft Tires Revenue (USD Million) By Type (2023-2030)
Figure 34 Europe Aircraft Tires Revenue (USD Million) By Applications (2023-2030)
Figure 35 Asia Pacific Aircraft Tires Revenue (USD Million) By Country (2023-2030)
Figure 36 Asia Pacific Aircraft Tires Revenue (USD Million) By Type (2023-2030)
Figure 37 Asia Pacific Aircraft Tires Revenue (USD Million) By Applications (2023-2030)
Figure 38 South America Aircraft Tires Revenue (USD Million) By Country (2023-2030)
Figure 39 South America Aircraft Tires Revenue (USD Million) By Type (2023-2030)
Figure 40 South America Aircraft Tires Revenue (USD Million) By Applications (2023-2030)
Figure 41 Middle East and Africa Aircraft Tires Revenue (USD Million) By Region (2023-2030)
Figure 42 Middle East and Africa Aircraft Tires Revenue (USD Million) By Region (2023-2030)
Figure 43 Middle East and Africa Aircraft Tires Revenue (USD Million) By Type (2023-2030)
Figure 44 Middle East and Africa Aircraft Tires Revenue (USD Million) By Applications (2023-2030)
Figure 45 Bottom-Up and Top-Down Approaches For This Report
Figure 46 Data Triangulation
