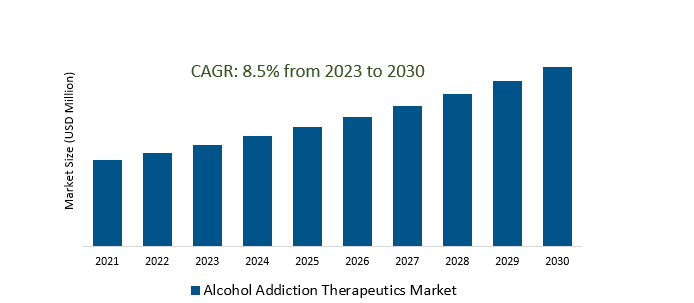
The Alcohol Addiction Therapeutics Market Size is estimated to register 8.5% growth over the forecast period from 2023 to 2030.
Alcohol Addiction Therapeutics Market Overview
he escalating cases of alcohol abuse globally, fostering the demand for better treatment options. Research and development advancements in neurobiology and pharmacology are pushing the boundaries of therapeutic innovation. increased research efforts and innovative developments in addiction therapeutics, such as targeted pharmacological approaches and personalized medicine strategies, are gaining momentum. Supportive policies, increased healthcare spending, and government initiatives aimed at addressing substance abuse disorders are pivotal in expanding the market growth. Additionally, there's a growing preference for integrated therapies that combine medications with behavioral interventions, aiming for comprehensive and holistic approaches to tackle alcohol addiction. Further, the shift towards personalized medicine and precision therapies in addiction treatment is gaining prominence, emphasizing the need for tailored interventions for better patient outcomes.
Alcohol Addiction Therapeutics Market Dynamics
Market Trends- Integration of AUD Care into General Healthcare is expanding access and enhancing treatment outcomes.
Providers are increasingly recognizing the necessity of identifying and managing AUD within routine healthcare, leading to the incorporation of screening, brief interventions, and appropriate treatment options for individuals with alcohol addiction.
The integrated approach, aiming to facilitate early identification, intervention, and ongoing management of alcohol-related concerns while reducing the stigma associated with seeking specialized addiction care are fueling the market demand.
Further, the emphasis of patient-centered strategy that enhances accessibility to alcohol addiction treatments, promoting more holistic healthcare approach, and facilitating more effective management of AUD through comprehensive healthcare services are propelling the market.
Market Driver- Personalized treatment and tailored therapies drive innovation and precision in the Alcohol Addiction Therapeutics Market.
Advancements in understanding the genetic, neurobiological, and behavioral factors contributing to addiction are the prime factors.
Tailored therapies, aiming to offer interventions specific to an individual's unique characteristics, considering factors such as genetic predisposition, co-existing mental health conditions, and varying responses to treatments promotes precise and targeted interventions.
The focus on personalized approaches, which not only aims to enhance treatment efficacy but also to reduce the risk of relapse, ultimately improving patient outcomes and offering more effective solutions are driving the market growth.
Market Opportunity- Introduction of Digital health interventions are transforming the Alcohol Addiction Therapeutics Market.
The increased adoption of telemedicine platforms, mobile applications, and other digital health solutions for alcohol addiction treatment is reshaping therapeutic approaches.
The ability to provide remote support, deliver educational resources, facilitate counseling sessions, and enable real-time monitoring of patient progress are propelling the market growth.
Further, growing preference for technology-enabled solutions that enhance treatment accessibility, improve patient engagement, and bridge gaps in traditional healthcare delivery methods are raising the market revenue.
Market Share Analysis- CM-1212 will register the fastest growth.
The Alcohol Addiction Therapeutics Market is analyzed across CM-1212, CTDP-002, A-705253, ABT-436, ADX-71441 & Others. CM-1212 is poised to register the fastest growth. CM-1212 is a promising new medication for the treatment of alcohol addiction. It works by blocking the activation of the κ-opioid receptor. This receptor is involved in the rewarding effects of alcohol and other substances of abuse. By blocking the activation of this receptor, CM-1212 may reduce the cravings and withdrawal symptoms associated with alcohol addiction. CM-1212 has the potential to be a safe and effective treatment for alcohol addiction. It is not an opioid, so it does not carry the risk of addiction or overdose and is a long-acting medication, which means that it can be taken less frequently than other medications.
Market Share Analysis- Clinics held a significant market share in 2023.
The Alcohol Addiction Therapeutics Market is analyzed across various applications including Hospitals, Clinics & Others. Of these, Clinics held a significant market share in 2023. Clinics specializing in addiction treatment provide a range of services tailored to address the diverse needs of patients struggling with alcohol use disorder (AUD). These facilities offer outpatient care, counseling sessions, medication management, behavioral therapies, support groups, and other evidence-based interventions aimed at assisting individuals in their recovery journey. Clinics often serve as accessible and community-based healthcare centers, providing a more focused and personalized approach to treating AUD. The treatment provided in clinics allows individuals to continue with their daily routines while receiving the necessary support and guidance to overcome alcohol addiction.
Alcohol Addiction Therapeutics Market Segmentation
By Type
- CM-1212
- CTDP-002
- A-705253
- ABT-436
- ADX-71441
- Others
By Application
By Region
- North America (United States, Canada, Mexico)
- Europe (Germany, France, United Kingdom, Spain, Italy, Others)
- Asia Pacific (China, India, Japan, South Korea, Australia, Others)
- Latin America (Brazil, Argentina, Others)
- Middle East and Africa (Saudi Arabia, UAE, Kuwait, Other Middle East, South Africa, Nigeria, Other Africa)
Alcohol Addiction Therapeutics Market Companies
- BioCorRx Inc
- Omeros Corp
- Chronos Therapeutics Ltd
- Corcept Therapeutics Inc
- Curemark LLC
- Eli Lilly and Company
- Ethypharm SA
- Bionex Pharmaceuticals LLC
- Cerecor Inc
- AstraZeneca Plc
- Kinnov Therapeutics SAS
- H. Lundbeck A/S
- Heptares Therapeutics Ltd
- Indivior Plc
- Kyorin Pharmaceutical Co Ltd
- Lohocla Research Corp
- Montisera Ltd
- Opiant Pharmaceuticals Inc
- Kinnov Therapeutics SAS
*List not exhaustive
Alcohol Addiction Therapeutics Market Outlook 2023
1 Market Overview
1.1 Introduction to the Alcohol Addiction Therapeutics Market
1.2 Scope of the Study
1.3 Research Objective
1.3.1 Key Market Scope and Segments
1.3.2 Players Covered
1.3.3 Years Considered
2 Executive Summary
2.1 2023 Alcohol Addiction Therapeutics Industry- Market Statistics
3 Market Dynamics
3.1 Market Drivers
3.2 Market Challenges
3.3 Market Opportunities
3.4 Market Trends
4 Market Factor Analysis
4.1 Porter’s Five Forces
4.2 Market Entropy
4.2.1 Global Alcohol Addiction Therapeutics Market Companies with Area Served
4.2.2 Products Offerings Global Alcohol Addiction Therapeutics Market
5 COVID-19 Impact Analysis and Outlook Scenarios
5.1.1 Covid-19 Impact Analysis
5.1.2 post-COVID-19 Scenario- Low Growth Case
5.1.3 post-COVID-19 Scenario- Reference Growth Case
5.1.4 post-COVID-19 Scenario- Low Growth Case
6 Global Alcohol Addiction Therapeutics Market Trends
6.1 Global Alcohol Addiction Therapeutics Revenue (USD Million) and CAGR (%) by Type (2018-2030)
6.2 Global Alcohol Addiction Therapeutics Revenue (USD Million) and CAGR (%) by Applications (2018-2030)
6.3 Global Alcohol Addiction Therapeutics Revenue (USD Million) and CAGR (%) by regions (2018-2030)
7 Global Alcohol Addiction Therapeutics Market Revenue (USD Million) by Type, and Applications (2018-2022)
7.1 Global Alcohol Addiction Therapeutics Revenue (USD Million) by Type (2018-2022)
7.1.1 Global Alcohol Addiction Therapeutics Revenue (USD Million), Market Share (%) by Type (2018-2022)
7.2 Global Alcohol Addiction Therapeutics Revenue (USD Million) by Applications (2018-2022)
7.2.1 Global Alcohol Addiction Therapeutics Revenue (USD Million), Market Share (%) by Applications (2018-2022)
8 Global Alcohol Addiction Therapeutics Development Regional Status and Outlook
8.1 Global Alcohol Addiction Therapeutics Revenue (USD Million) By Regions (2018-2022)
8.2 North America Alcohol Addiction Therapeutics Revenue (USD Million) by Type, and Application (2018-2022)
8.2.1 North America Alcohol Addiction Therapeutics Revenue (USD Million) by Country (2018-2022)
8.2.2 North America Alcohol Addiction Therapeutics Revenue (USD Million) by Type (2018-2022)
8.2.3 North America Alcohol Addiction Therapeutics Revenue (USD Million) by Applications (2018-2022)
8.3 Europe Alcohol Addiction Therapeutics Revenue (USD Million), by Type, and Applications (USD Million) (2018-2022)
8.3.1 Europe Alcohol Addiction Therapeutics Revenue (USD Million), by Country (2018-2022)
8.3.2 Europe Alcohol Addiction Therapeutics Revenue (USD Million) by Type (2018-2022)
8.3.3 Europe Alcohol Addiction Therapeutics Revenue (USD Million) by Applications (2018-2022)
8.4 Asia Pacific Alcohol Addiction Therapeutics Revenue (USD Million), and Revenue (USD Million) by Type, and Applications (2018-2022)
8.4.1 Asia Pacific Alcohol Addiction Therapeutics Revenue (USD Million) by Country (2018-2022)
8.4.2 Asia Pacific Alcohol Addiction Therapeutics Revenue (USD Million) by Type (2018-2022)
8.4.3 Asia Pacific Alcohol Addiction Therapeutics Revenue (USD Million) by Applications (2018-2022)
8.5 South America Alcohol Addiction Therapeutics Revenue (USD Million), by Type, and Applications (2018-2022)
8.5.1 South America Alcohol Addiction Therapeutics Revenue (USD Million), by Country (2018-2022)
8.5.2 South America Alcohol Addiction Therapeutics Revenue (USD Million) by Type (2018-2022)
8.5.3 South America Alcohol Addiction Therapeutics Revenue (USD Million) by Applications (2018-2022)
8.6 Middle East and Africa Alcohol Addiction Therapeutics Revenue (USD Million), by Type, Technology, Application, Thickness (2018-2022)
8.6.1 Middle East and Africa Alcohol Addiction Therapeutics Revenue (USD Million) by Country (2018-2022)
8.6.2 Middle East and Africa Alcohol Addiction Therapeutics Revenue (USD Million) by Type (2018-2022)
8.6.3 Middle East and Africa Alcohol Addiction Therapeutics Revenue (USD Million) by Applications (2018-2022)
9 Company Profiles
10 Global Alcohol Addiction Therapeutics Market Revenue (USD Million), by Type, and Applications (2023-2030)
10.1 Global Alcohol Addiction Therapeutics Revenue (USD Million) and Market Share (%) by Type (2023-2030)
10.1.1 Global Alcohol Addiction Therapeutics Revenue (USD Million), and Market Share (%) by Type (2023-2030)
10.2 Global Alcohol Addiction Therapeutics Revenue (USD Million) and Market Share (%) by Applications (2023-2030)
10.2.1 Global Alcohol Addiction Therapeutics Revenue (USD Million), and Market Share (%) by Applications (2023-2030)
11 Global Alcohol Addiction Therapeutics Development Regional Status and Outlook Forecast
11.1 Global Alcohol Addiction Therapeutics Revenue (USD Million) By Regions (2023-2030)
11.2 North America Alcohol Addiction Therapeutics Revenue (USD Million) by Type, and Applications (2023-2030)
11.2.1 North America Alcohol Addiction Therapeutics Revenue (USD) Million by Country (2023-2030)
11.2.2 North America Alcohol Addiction Therapeutics Revenue (USD Million), by Type (2023-2030)
11.2.3 North America Alcohol Addiction Therapeutics Revenue (USD Million), Market Share (%) by Applications (2023-2030)
11.3 Europe Alcohol Addiction Therapeutics Revenue (USD Million), by Type, and Applications (2023-2030)
11.3.1 Europe Alcohol Addiction Therapeutics Revenue (USD Million), by Country (2023-2030)
11.3.2 Europe Alcohol Addiction Therapeutics Revenue (USD Million), by Type (2023-2030)
11.3.3 Europe Alcohol Addiction Therapeutics Revenue (USD Million), by Applications (2023-2030)
11.4 Asia Pacific Alcohol Addiction Therapeutics Revenue (USD Million) by Type, and Applications (2023-2030)
11.4.1 Asia Pacific Alcohol Addiction Therapeutics Revenue (USD Million), by Country (2023-2030)
11.4.2 Asia Pacific Alcohol Addiction Therapeutics Revenue (USD Million), by Type (2023-2030)
11.4.3 Asia Pacific Alcohol Addiction Therapeutics Revenue (USD Million), by Applications (2023-2030)
11.5 South America Alcohol Addiction Therapeutics Revenue (USD Million), by Type, and Applications (2023-2030)
11.5.1 South America Alcohol Addiction Therapeutics Revenue (USD Million), by Country (2023-2030)
11.5.2 South America Alcohol Addiction Therapeutics Revenue (USD Million), by Type (2023-2030)
11.5.3 South America Alcohol Addiction Therapeutics Revenue (USD Million), by Applications (2023-2030)
11.6 Middle East and Africa Alcohol Addiction Therapeutics Revenue (USD Million), by Type, and Applications (2023-2030)
11.6.1 Middle East and Africa Alcohol Addiction Therapeutics Revenue (USD Million), by region (2023-2030)
11.6.2 Middle East and Africa Alcohol Addiction Therapeutics Revenue (USD Million), by Type (2023-2030)
11.6.3 Middle East and Africa Alcohol Addiction Therapeutics Revenue (USD Million), by Applications (2023-2030)
12 Methodology and Data Sources
12.1 Methodology/Research Approach
12.1.1 Research Programs/Design
12.1.2 Market Size Estimation
12.1.3 Market Breakdown and Data Triangulation
12.2 Data Sources
12.2.1 Secondary Sources
12.2.2 Primary Sources
12.3 Disclaimer
List of Tables
Table 1 Market Segmentation Analysis
Table 2 Global Alcohol Addiction Therapeutics Market Companies with Areas Served
Table 3 Products Offerings Global Alcohol Addiction Therapeutics Market
Table 4 Low Growth Scenario Forecasts
Table 5 Reference Case Growth Scenario
Table 6 High Growth Case Scenario
Table 7 Global Alcohol Addiction Therapeutics Revenue (USD Million) And CAGR (%) By Type (2018-2030)
Table 8 Global Alcohol Addiction Therapeutics Revenue (USD Million) And CAGR (%) By Applications (2018-2030)
Table 9 Global Alcohol Addiction Therapeutics Revenue (USD Million) And CAGR (%) By Regions (2018-2030)
Table 10 Global Alcohol Addiction Therapeutics Revenue (USD Million) By Type (2018-2022)
Table 11 Global Alcohol Addiction Therapeutics Revenue Market Share (%) By Type (2018-2022)
Table 12 Global Alcohol Addiction Therapeutics Revenue (USD Million) By Applications (2018-2022)
Table 13 Global Alcohol Addiction Therapeutics Revenue Market Share (%) By Applications (2018-2022)
Table 14 Global Alcohol Addiction Therapeutics Market Revenue (USD Million) By Regions (2018-2022)
Table 15 Global Alcohol Addiction Therapeutics Market Share (%) By Regions (2018-2022)
Table 16 North America Alcohol Addiction Therapeutics Revenue (USD Million) By Country (2018-2022)
Table 17 North America Alcohol Addiction Therapeutics Revenue (USD Million) By Type (2018-2022)
Table 18 North America Alcohol Addiction Therapeutics Revenue (USD Million) By Applications (2018-2022)
Table 19 Europe Alcohol Addiction Therapeutics Revenue (USD Million) By Country (2018-2022)
Table 20 Europe Alcohol Addiction Therapeutics Revenue (USD Million) By Type (2018-2022)
Table 21 Europe Alcohol Addiction Therapeutics Revenue (USD Million) By Applications (2018-2022)
Table 22 Asia Pacific Alcohol Addiction Therapeutics Revenue (USD Million) By Country (2018-2022)
Table 23 Asia Pacific Alcohol Addiction Therapeutics Revenue (USD Million) By Type (2018-2022)
Table 24 Asia Pacific Alcohol Addiction Therapeutics Revenue (USD Million) By Applications (2018-2022)
Table 25 South America Alcohol Addiction Therapeutics Revenue (USD Million) By Country (2018-2022)
Table 26 South America Alcohol Addiction Therapeutics Revenue (USD Million) By Type (2018-2022)
Table 27 South America Alcohol Addiction Therapeutics Revenue (USD Million) By Applications (2018-2022)
Table 28 Middle East and Africa Alcohol Addiction Therapeutics Revenue (USD Million) By Region (2018-2022)
Table 29 Middle East and Africa Alcohol Addiction Therapeutics Revenue (USD Million) By Type (2018-2022)
Table 30 Middle East and Africa Alcohol Addiction Therapeutics Revenue (USD Million) By Applications (2018-2022)
Table 31 Financial Analysis
Table 32 Global Alcohol Addiction Therapeutics Revenue (USD Million) By Type (2023-2030)
Table 33 Global Alcohol Addiction Therapeutics Revenue Market Share (%) By Type (2023-2030)
Table 34 Global Alcohol Addiction Therapeutics Revenue (USD Million) By Applications (2023-2030)
Table 35 Global Alcohol Addiction Therapeutics Revenue Market Share (%) By Applications (2023-2030)
Table 36 Global Alcohol Addiction Therapeutics Market Revenue (USD Million), And Revenue (USD Million) By Regions (2023-2030)
Table 37 North America Alcohol Addiction Therapeutics Revenue (USD)By Country (2023-2030)
Table 38 North America Alcohol Addiction Therapeutics Revenue (USD Million) By Type (2023-2030)
Table 39 North America Alcohol Addiction Therapeutics Revenue (USD Million) By Applications (2023-2030)
Table 40 Europe Alcohol Addiction Therapeutics Revenue (USD Million) By Country (2023-2030)
Table 41 Europe Alcohol Addiction Therapeutics Revenue (USD Million) By Type (2023-2030)
Table 42 Europe Alcohol Addiction Therapeutics Revenue (USD Million) By Applications (2023-2030)
Table 43 Asia Pacific Alcohol Addiction Therapeutics Revenue (USD Million) By Country (2023-2030)
Table 44 Asia Pacific Alcohol Addiction Therapeutics Revenue (USD Million) By Type (2023-2030)
Table 45 Asia Pacific Alcohol Addiction Therapeutics Revenue (USD Million) By Applications (2023-2030)
Table 46 South America Alcohol Addiction Therapeutics Revenue (USD Million) By Country (2023-2030)
Table 47 South America Alcohol Addiction Therapeutics Revenue (USD Million) By Type (2023-2030)
Table 48 South America Alcohol Addiction Therapeutics Revenue (USD Million) By Applications (2023-2030)
Table 49 Middle East and Africa Alcohol Addiction Therapeutics Revenue (USD Million) By Region (2023-2030)
Table 50 Middle East and Africa Alcohol Addiction Therapeutics Revenue (USD Million) By Region (2023-2030)
Table 51 Middle East and Africa Alcohol Addiction Therapeutics Revenue (USD Million) By Type (2023-2030)
Table 52 Middle East and Africa Alcohol Addiction Therapeutics Revenue (USD Million) By Applications (2023-2030)
Table 53 Research Programs/Design for This Report
Table 54 Key Data Information from Secondary Sources
Table 55 Key Data Information from Primary Sources
List of Figures
Figure 1 Market Scope
Figure 2 Porter’s Five Forces
Figure 3 Global Alcohol Addiction Therapeutics Revenue (USD Million) By Type (2018-2022)
Figure 4 Global Alcohol Addiction Therapeutics Revenue Market Share (%) By Type (2022)
Figure 5 Global Alcohol Addiction Therapeutics Revenue (USD Million) By Applications (2018-2022)
Figure 6 Global Alcohol Addiction Therapeutics Revenue Market Share (%) By Applications (2022)
Figure 7 Global Alcohol Addiction Therapeutics Market Revenue (USD Million) By Regions (2018-2022)
Figure 8 Global Alcohol Addiction Therapeutics Market Share (%) By Regions (2022)
Figure 9 North America Alcohol Addiction Therapeutics Revenue (USD Million) By Country (2018-2022)
Figure 10 North America Alcohol Addiction Therapeutics Revenue (USD Million) By Type (2018-2022)
Figure 11 North America Alcohol Addiction Therapeutics Revenue (USD Million) By Applications (2018-2022)
Figure 12 Europe Alcohol Addiction Therapeutics Revenue (USD Million) By Country (2018-2022)
Figure 13 Europe Alcohol Addiction Therapeutics Revenue (USD Million) By Type (2018-2022)
Figure 14 Europe Alcohol Addiction Therapeutics Revenue (USD Million) By Applications (2018-2022)
Figure 15 Asia Pacific Alcohol Addiction Therapeutics Revenue (USD Million) By Country (2018-2022)
Figure 16 Asia Pacific Alcohol Addiction Therapeutics Revenue (USD Million) By Type (2018-2022)
Figure 17 Asia Pacific Alcohol Addiction Therapeutics Revenue (USD Million) By Applications (2018-2022)
Figure 18 South America Alcohol Addiction Therapeutics Revenue (USD Million) By Country (2018-2022)
Figure 19 South America Alcohol Addiction Therapeutics Revenue (USD Million) By Type (2018-2022)
Figure 20 South America Alcohol Addiction Therapeutics Revenue (USD Million) By Applications (2018-2022)
Figure 21 Middle East and Africa Alcohol Addiction Therapeutics Revenue (USD Million) By Region (2018-2022)
Figure 22 Middle East and Africa Alcohol Addiction Therapeutics Revenue (USD Million) By Type (2018-2022)
Figure 23 Middle East and Africa Alcohol Addiction Therapeutics Revenue (USD Million) By Applications (2018-2022)
Figure 24 Global Alcohol Addiction Therapeutics Revenue (USD Million) By Type (2023-2030)
Figure 25 Global Alcohol Addiction Therapeutics Revenue Market Share (%) By Type (2030)
Figure 26 Global Alcohol Addiction Therapeutics Revenue (USD Million) By Applications (2023-2030)
Figure 27 Global Alcohol Addiction Therapeutics Revenue Market Share (%) By Applications (2030)
Figure 28 Global Alcohol Addiction Therapeutics Market Revenue (USD Million) By Regions (2023-2030)
Figure 29 North America Alcohol Addiction Therapeutics Revenue (USD Million) By Country (2023-2030)
Figure 30 North America Alcohol Addiction Therapeutics Revenue (USD Million) By Type (2023-2030)
Figure 31 North America Alcohol Addiction Therapeutics Revenue (USD Million) By Applications (2023-2030)
Figure 32 Europe Alcohol Addiction Therapeutics Revenue (USD Million) By Country (2023-2030)
Figure 33 Europe Alcohol Addiction Therapeutics Revenue (USD Million) By Type (2023-2030)
Figure 34 Europe Alcohol Addiction Therapeutics Revenue (USD Million) By Applications (2023-2030)
Figure 35 Asia Pacific Alcohol Addiction Therapeutics Revenue (USD Million) By Country (2023-2030)
Figure 36 Asia Pacific Alcohol Addiction Therapeutics Revenue (USD Million) By Type (2023-2030)
Figure 37 Asia Pacific Alcohol Addiction Therapeutics Revenue (USD Million) By Applications (2023-2030)
Figure 38 South America Alcohol Addiction Therapeutics Revenue (USD Million) By Country (2023-2030)
Figure 39 South America Alcohol Addiction Therapeutics Revenue (USD Million) By Type (2023-2030)
Figure 40 South America Alcohol Addiction Therapeutics Revenue (USD Million) By Applications (2023-2030)
Figure 41 Middle East and Africa Alcohol Addiction Therapeutics Revenue (USD Million) By Region (2023-2030)
Figure 42 Middle East and Africa Alcohol Addiction Therapeutics Revenue (USD Million) By Region (2023-2030)
Figure 43 Middle East and Africa Alcohol Addiction Therapeutics Revenue (USD Million) By Type (2023-2030)
Figure 44 Middle East and Africa Alcohol Addiction Therapeutics Revenue (USD Million) By Applications (2023-2030)
Figure 45 Bottom-Up and Top-Down Approaches for This Report
Figure 46 Data Triangulation
