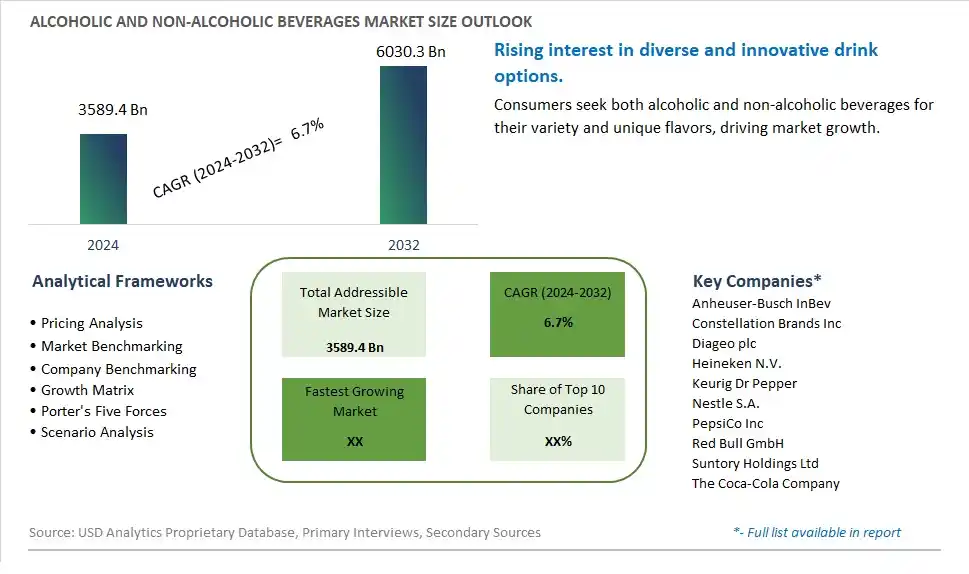
Global Alcoholic and Non-Alcoholic Beverages Market Size is valued at $3589.4 Billion in 2024 and is forecast to register a growth rate (CAGR) of 6.7% to reach $6030.3 Billion by 2032.
The global Alcoholic and Non-Alcoholic Beverages Market Comprehensive Study analyzes and forecasts the market size across 6 regions and 24 countries for diverse segments -By Product (Alcoholic Beverages, -Beer, -Wine, -Spirits, Non-Alcoholic Beverages, -Energy & Sports Drink, -Soft Drinks, -Bottled Water, -Packaged Juice, -RTD Tea and Coffee, -Others), By Distribution Channel (On-trade, Off-trade, -Supermarkets/Hypermarkets, -Convenience/Grocery Stores, -Online Retail Stores, -Others)
An Introduction to Alcoholic and Non-Alcoholic Beverages Market
The Alcoholic and Non-Alcoholic Beverages Market encompasses a wide range of drinks, from traditional alcoholic beverages like beer, wine, and spirits to non-alcoholic options such as soft drinks, juices, and functional beverages. The market is driven by changing consumer preferences, increasing demand for healthier drink options, and growing innovation in beverage flavors and formulations. Additionally, the expansion of distribution channels and the rise of premium and craft beverages contribute to market growth.
Alcoholic and Non Alcoholic Beverages Competitive Landscape
The market report analyses the leading companies in the industry including Anheuser-Busch InBev, Constellation Brands Inc, Diageo plc, Heineken N.V., Keurig Dr Pepper, Nestle S.A., PepsiCo Inc, Red Bull GmbH, Suntory Holdings Ltd, The Coca-Cola Company, and Others.
Alcoholic and Non Alcoholic Beverages Market Dynamics
Market Trend: Convergence of Health and Indulgence in Beverage Choices
The market for both alcoholic and non-alcoholic beverages is experiencing a significant trend towards the convergence of health and indulgence in beverage choices. Consumers are increasingly looking for products that offer both pleasurable drinking experiences and health benefits. This trend is evident in the rising popularity of functional beverages that combine natural ingredients, low calories, and added health benefits such as vitamins, minerals, and probiotics. Additionally, the demand for premium and craft beverages that offer unique flavors and high-quality ingredients is growing, as consumers seek out indulgent experiences without compromising their health goals. This dual focus on health and indulgence is reshaping the beverage market, driving innovation and diversification.
Market Driver: Changing Consumer Preferences and Lifestyles
The primary driver for the alcoholic and non-alcoholic beverages market is the changing consumer preferences and lifestyles. As more consumers prioritize health and wellness, they are seeking out beverages that align with their values and lifestyle choices. This includes a preference for natural, organic, and clean label products that provide transparency in ingredients. Additionally, the increasing awareness of the negative health impacts of sugary and high-calorie drinks is pushing consumers towards healthier alternatives. The rise of social media and the influence of wellness influencers are also shaping consumer preferences, making it essential for beverage companies to innovate and cater to the evolving demands for healthier and more functional beverage options.
Market Opportunity: Innovation in Hybrid Beverages
A significant opportunity for the alcoholic and non-alcoholic beverages market lies in the innovation of hybrid beverages. Creating products that blend the characteristics of alcoholic and non-alcoholic drinks can attract a wide range of consumers looking for versatile and novel beverage experiences. For example, low-alcohol or alcohol-free beers, wines, and spirits that retain the flavors and sophistication of their alcoholic counterparts can cater to consumers who want to enjoy social drinking occasions without the effects of alcohol. Additionally, beverages that combine elements of wellness, such as herbal infusions or adaptogens, with traditional drink formats can appeal to health-conscious consumers. By exploring these hybrid categories and investing in research and development, beverage companies can tap into emerging trends and expand their market presence.
Alcoholic and Non-Alcoholic Beverages Market Share Analysis- Largest Segment by Product
The largest segment in the Alcoholic and Non-Alcoholic Beverages Market by product is the Non-Alcoholic Beverages segment, particularly Soft Drinks. This segment's dominance is attributed to its widespread appeal and consumption across all age groups and geographies. Soft drinks, which include carbonated beverages, flavored sodas, and colas, have a strong market presence and are staples in both developed and developing markets. Their extensive distribution networks, aggressive marketing strategies, and continuous product innovation contribute to their vast market share. The convenience of availability in various packaging sizes, from single-serve bottles to large family packs, also enhances their market penetration. Moreover, the increasing demand for healthier, low-calorie, and sugar-free variants has spurred growth within this segment, catering to the evolving consumer preferences for healthier beverage options without compromising on taste.
Alcoholic and Non-Alcoholic Beverages Market Share Analysis- Fastest Growing Segment by Distribution Channel
The Online Retail Stores segment is expected to grow the fastest in the Alcoholic and Non-Alcoholic Beverages Market by distribution channel over the next five years. This growth is driven by the increasing shift towards e-commerce and the convenience it offers. Online platforms provide consumers with a vast array of options, detailed product information, customer reviews, and competitive pricing, which enhances the shopping experience. The COVID-19 pandemic has accelerated the adoption of online shopping, as consumers seek safe and contactless purchasing methods. Moreover, advancements in logistics and delivery services have improved the efficiency and reliability of online beverage purchases. The ability to access niche and premium products, often unavailable in physical stores, further propels the growth of online retail. As more consumers become comfortable with online transactions and as e-commerce platforms continue to innovate and expand, the online retail segment is set to experience significant growth.
Alcoholic and Non Alcoholic Beverages Market Segmentation
By Product
Alcoholic Beverages
-Beer
-Wine
-Spirits
Non-Alcoholic Beverages
-Energy & Sports Drink
-Soft Drinks
-Bottled Water
-Packaged Juice
-RTD Tea and Coffee
-Others
By Distribution Channel
On-trade
Off-trade
-Supermarkets/Hypermarkets
-Convenience/Grocery Stores
-Online Retail Stores
-Others
Countries Analyzed
North America (US, Canada, Mexico)
Europe (Germany, UK, France, Spain, Italy, Russia, Rest of Europe)
Asia Pacific (China, India, Japan, South Korea, Australia, South East Asia, Rest of Asia)
South America (Brazil, Argentina, Rest of South America)
Middle East and Africa (Saudi Arabia, UAE, Rest of Middle East, South Africa, Egypt, Rest of Africa)
Alcoholic and Non Alcoholic Beverages Companies Profiled in the Study
Anheuser-Busch InBev
Constellation Brands Inc
Diageo plc
Heineken N.V.
Keurig Dr Pepper
Nestle S.A.
PepsiCo Inc
Red Bull GmbH
Suntory Holdings Ltd
The Coca-Cola Company
*- List Not Exhaustive
Chapter 1. TABLE OF CONTENTS
Chapter 2. Introduction to Alcoholic and Non Alcoholic Beverages Market
2.1. Market Overview
2.2. Key Statistics and Report Highlights
2.3. Scope of the Comprehensive Study
2.3.1. Market Definition
2.3.2 Countries and Regions Covered
2.3.3 Research Objective
2.3.4 Units, Currency, and Conversions
2.3.5 Industry Value Chain
2.4. Key Market Segments
2.5. Key Companies
2.6. Study Period
Chapter 3. Strategic Analysis Review
3.1. Alcoholic and Non Alcoholic Beverages Pricing Analysis and Forecast
3.2. Porter’s Five Forces
3.3. Market Ecosystem
3.4. SWOT Analysis
3.5. Regulatory Scenario
3.3. Effects of Inflation, Russia-Ukraine War, moderating economic growth, and other macroeconomic factors
Chapter 4. Competitive Landscape
4.1. Market Share Analysis
4.1.1. Global Alcoholic and Non Alcoholic Beverages Market Share by Company, 2023
4.1.2. Product Offerings of Leading Alcoholic and Non Alcoholic Beverages Companies
4.2. Market Entropy
4.2.1. New Product Launches in the Industry
4.2.2. Mergers, Acquisitions, Joint ventures, and Partnerships
4.3. Key Strategies and Best Practices
Chapter 5. Global Market Projections: Best, Reference, and Low Case Scenarios
5.1. Growth Analysis- Case Scenario Definitions
5.2. Low Growth Case Scenario Forecasts
5.3. Reference Growth Case Scenario Forecasts
5.4. High Growth Case Scenario Forecasts
Chapter 6. Market Dynamics
6.1. Alcoholic and Non Alcoholic Beverages Market Drivers
6.2. Alcoholic and Non Alcoholic Beverages Market Challenges
6.6. Alcoholic and Non Alcoholic Beverages Market Opportunities
6.4. Alcoholic and Non Alcoholic Beverages Market Trends
Chapter 7. Global Alcoholic and Non Alcoholic Beverages Market Outlook Trends
7.1. Global Alcoholic and Non Alcoholic Beverages Revenue (USD Million) and CAGR (%) by Type (2021-2032)
7.2. Global Alcoholic and Non Alcoholic Beverages Revenue (USD Million) and CAGR (%) by Application (2021-2032)
7.3. Global Alcoholic and Non Alcoholic Beverages Revenue (USD Million) and CAGR (%) by Product (2021-2032)
By Product
Alcoholic Beverages
-Beer
-Wine
-Spirits
Non-Alcoholic Beverages
-Energy & Sports Drink
-Soft Drinks
-Bottled Water
-Packaged Juice
-RTD Tea and Coffee
-Others
By Distribution Channel
On-trade
Off-trade
-Supermarkets/Hypermarkets
-Convenience/Grocery Stores
-Online Retail Stores
-Others
Chapter 8. Global Alcoholic and Non Alcoholic Beverages Regional Analysis and Outlook
8.1. Global Alcoholic and Non Alcoholic Beverages Revenue (USD Million) By Regions (2021- 2032)
8.2. North America Alcoholic and Non Alcoholic Beverages Revenue (USD Million) by Country (2021-2032)
8.2.1. United States Alcoholic and Non Alcoholic Beverages Regional Analysis and Outlook
8.2.2. Canada Alcoholic and Non Alcoholic Beverages Regional Analysis and Outlook
8.2.3. Mexico Alcoholic and Non Alcoholic Beverages Regional Analysis and Outlook
8.3. Europe Alcoholic and Non Alcoholic Beverages Revenue (USD Million), by Country (2021-2032)
8.3.1. Germany Alcoholic and Non Alcoholic Beverages Regional Analysis and Outlook
8.3.2. France Alcoholic and Non Alcoholic Beverages Regional Analysis and Outlook
8.3.3. United Kingdom Alcoholic and Non Alcoholic Beverages Regional Analysis and Outlook
8.3.4. Spain Alcoholic and Non Alcoholic Beverages Regional Analysis and Outlook
8.3.5. Italy Alcoholic and Non Alcoholic Beverages Regional Analysis and Outlook
8.3.6. Russia Alcoholic and Non Alcoholic Beverages Regional Analysis and Outlook
8.3.7. Rest of Europe Alcoholic and Non Alcoholic Beverages Regional Analysis and Outlook
8.4. Asia Pacific Alcoholic and Non Alcoholic Beverages Revenue (USD Million) by Country (2021-2032)
8.4.1. China Alcoholic and Non Alcoholic Beverages Regional Analysis and Outlook
8.4.2. Japan Alcoholic and Non Alcoholic Beverages Regional Analysis and Outlook
8.4.3. India Alcoholic and Non Alcoholic Beverages Regional Analysis and Outlook
8.4.4. South Korea Alcoholic and Non Alcoholic Beverages Regional Analysis and Outlook
8.4.5. Australia Alcoholic and Non Alcoholic Beverages Regional Analysis and Outlook
8.4.6. South East Asia Alcoholic and Non Alcoholic Beverages Regional Analysis and Outlook
8.4.7. Rest of Asia Pacific Alcoholic and Non Alcoholic Beverages Regional Analysis and Outlook
8.5. South America Alcoholic and Non Alcoholic Beverages Revenue (USD Million), by Country (2021-2032)
8.5.1. Brazil Alcoholic and Non Alcoholic Beverages Regional Analysis and Outlook
8.5.2. Argentina Alcoholic and Non Alcoholic Beverages Regional Analysis and Outlook
8.5.3. Rest of South America Alcoholic and Non Alcoholic Beverages Regional Analysis and Outlook
8.6. Middle East and Africa Alcoholic and Non Alcoholic Beverages Revenue (USD Million) by Country (2021-2032)
8.6.1. Middle East Alcoholic and Non Alcoholic Beverages Regional Analysis and Outlook
8.6.2. Africa Alcoholic and Non Alcoholic Beverages Regional Analysis and Outlook
Chapter 9. North America Alcoholic and Non Alcoholic Beverages Analysis and Outlook
9.1. North America Alcoholic and Non Alcoholic Beverages Revenue (USD Million) by Segments (2021-2032)
9.1.1. North America Alcoholic and Non Alcoholic Beverages Revenue (USD Million) by Type (2021-2032)
9.1.2. North America Alcoholic and Non Alcoholic Beverages Revenue (USD Million) by Application (2021-2032)
9.1.3. North America Alcoholic and Non Alcoholic Beverages Revenue (USD Million) by Product (2021-2032)
By Product
Alcoholic Beverages
-Beer
-Wine
-Spirits
Non-Alcoholic Beverages
-Energy & Sports Drink
-Soft Drinks
-Bottled Water
-Packaged Juice
-RTD Tea and Coffee
-Others
By Distribution Channel
On-trade
Off-trade
-Supermarkets/Hypermarkets
-Convenience/Grocery Stores
-Online Retail Stores
-Others
Chapter 10. Europe Alcoholic and Non Alcoholic Beverages Analysis and Outlook
10.1. Europe Alcoholic and Non Alcoholic Beverages Revenue (USD Million), by Segments (USD Million) (2021-2032)
10.1.1. Europe Alcoholic and Non Alcoholic Beverages Revenue (USD Million) by Type (2021-2032)
10.1.2. Europe Alcoholic and Non Alcoholic Beverages Revenue (USD Million) by Application (2021-2032)
10.1.3. Europe Alcoholic and Non Alcoholic Beverages Revenue (USD Million) by Product (2021-2032)
By Product
Alcoholic Beverages
-Beer
-Wine
-Spirits
Non-Alcoholic Beverages
-Energy & Sports Drink
-Soft Drinks
-Bottled Water
-Packaged Juice
-RTD Tea and Coffee
-Others
By Distribution Channel
On-trade
Off-trade
-Supermarkets/Hypermarkets
-Convenience/Grocery Stores
-Online Retail Stores
-Others
Chapter 11. Asia Pacific Alcoholic and Non Alcoholic Beverages Analysis and Outlook
11.1. Asia Pacific Alcoholic and Non Alcoholic Beverages Revenue (USD Million), and Revenue (USD Million) by Segments (2021-2032)
11.1.1. Asia Pacific Alcoholic and Non Alcoholic Beverages Revenue (USD Million) by Type (2021-2032)
11.1.2. Asia Pacific Alcoholic and Non Alcoholic Beverages Revenue (USD Million) by Application (2021-2032)
11.1.3. Asia Pacific Alcoholic and Non Alcoholic Beverages Revenue (USD Million) by Product (2021-2032)
By Product
Alcoholic Beverages
-Beer
-Wine
-Spirits
Non-Alcoholic Beverages
-Energy & Sports Drink
-Soft Drinks
-Bottled Water
-Packaged Juice
-RTD Tea and Coffee
-Others
By Distribution Channel
On-trade
Off-trade
-Supermarkets/Hypermarkets
-Convenience/Grocery Stores
-Online Retail Stores
-Others
Chapter 12. South America Alcoholic and Non Alcoholic Beverages Analysis and Outlook
12.1. South America Alcoholic and Non Alcoholic Beverages Revenue (USD Million), by Segments (2021-2032)
12.1.1. South America Alcoholic and Non Alcoholic Beverages Revenue (USD Million) by Type (2021-2032)
12.1.2. South America Alcoholic and Non Alcoholic Beverages Revenue (USD Million) by Application (2021-2032)
12.1.3. South America Alcoholic and Non Alcoholic Beverages Revenue (USD Million) by Product (2021-2032)
By Product
Alcoholic Beverages
-Beer
-Wine
-Spirits
Non-Alcoholic Beverages
-Energy & Sports Drink
-Soft Drinks
-Bottled Water
-Packaged Juice
-RTD Tea and Coffee
-Others
By Distribution Channel
On-trade
Off-trade
-Supermarkets/Hypermarkets
-Convenience/Grocery Stores
-Online Retail Stores
-Others
Chapter 13. Middle East and Africa Alcoholic and Non Alcoholic Beverages Analysis and Outlook
13.1. Middle East and Africa Alcoholic and Non Alcoholic Beverages Revenue (USD Million), by Segments (2021-2032)
13.1.1. Middle East and Africa Alcoholic and Non Alcoholic Beverages Revenue (USD Million) by Type (2021-2032)
13.1.2. Middle East and Africa Alcoholic and Non Alcoholic Beverages Revenue (USD Million) by Application (2021-2032)
13.1.3. Middle East and Africa Alcoholic and Non Alcoholic Beverages Revenue (USD Million) by Product (2021-2032)
By Product
Alcoholic Beverages
-Beer
-Wine
-Spirits
Non-Alcoholic Beverages
-Energy & Sports Drink
-Soft Drinks
-Bottled Water
-Packaged Juice
-RTD Tea and Coffee
-Others
By Distribution Channel
On-trade
Off-trade
-Supermarkets/Hypermarkets
-Convenience/Grocery Stores
-Online Retail Stores
-Others
Chapter 14. Alcoholic and Non Alcoholic Beverages Company Profiles
14.1 Business Overview
14.2 Product Profiles
14.3 SWOT Profiles
14.5 Recent Developments
14.6 Financial Profile
List of Companies
Anheuser-Busch InBev
Constellation Brands Inc
Diageo plc
Heineken N.V.
Keurig Dr Pepper
Nestle S.A.
PepsiCo Inc
Red Bull GmbH
Suntory Holdings Ltd
The Coca-Cola Company
15. Methodology and Data Sources
15.1 Customization Offerings
15.2 Subscription Services
15.3 Related Reports
15.4 Publisher Expertise
LIST OF TABLES
Table 1 Market Segmentation Analysis
Table 2 Global Alcoholic and Non Alcoholic Beverages Market Share of Leading Companies, 2023
Table 3 Product Offerings of Leading Companies
Table 4 Low Growth Scenario Forecasts
Table 5 Reference Case Growth Scenario
Table 6 High Growth Case Scenario
Table 7 Global Alcoholic and Non Alcoholic Beverages Revenue (USD Million) And CAGR (%) By Type (2021-2032)
Table 8 Global Alcoholic and Non Alcoholic Beverages Revenue (USD Million) And CAGR (%) By Application (2021-2032)
Table 9 Global Alcoholic and Non Alcoholic Beverages Revenue (USD Million) And CAGR (%) By Product (2021-2032)
Table 10 Global Alcoholic and Non Alcoholic Beverages Market Revenue (USD Million) By Regions (2021-2032)
Table 11 Global Alcoholic and Non Alcoholic Beverages Market Share (%) By Regions (2021-2032)
Table 12 North America Alcoholic and Non Alcoholic Beverages Revenue (USD Million) By Country (2021-2032)
Table 13 Europe Alcoholic and Non Alcoholic Beverages Revenue (USD Million) By Country (2021-2032)
Table 14 Asia Pacific Alcoholic and Non Alcoholic Beverages Revenue (USD Million) By Country (2021-2032)
Table 15 South America Alcoholic and Non Alcoholic Beverages Revenue (USD Million) By Country (2021-2032)
Table 16 Middle East and Africa Alcoholic and Non Alcoholic Beverages Revenue (USD Million) By Region (2021-2032)
Table 17 North America Alcoholic and Non Alcoholic Beverages Revenue (USD Million) By Type (2021-2032)
Table 18 North America Alcoholic and Non Alcoholic Beverages Revenue (USD Million) By Application (2021-2032)
Table 19 North America Alcoholic and Non Alcoholic Beverages Revenue (USD Million) By Product (2021-2032)
Table 20 Europe Alcoholic and Non Alcoholic Beverages Revenue (USD Million) By Type (2021-2032)
Table 21 Europe Alcoholic and Non Alcoholic Beverages Revenue (USD Million) By Application (2021-2032)
Table 22 Europe Alcoholic and Non Alcoholic Beverages Revenue (USD Million) By Product (2021-2032)
Table 23 Asia Pacific Alcoholic and Non Alcoholic Beverages Revenue (USD Million) By Type (2021-2032)
Table 24 Asia Pacific Alcoholic and Non Alcoholic Beverages Revenue (USD Million) By Application (2021-2032)
Table 25 Asia Pacific Alcoholic and Non Alcoholic Beverages Revenue (USD Million) By Product (2021-2032)
Table 26 South America Alcoholic and Non Alcoholic Beverages Revenue (USD Million) By Type (2021-2032)
Table 27 South America Alcoholic and Non Alcoholic Beverages Revenue (USD Million) By Application (2021-2032)
Table 28 South America Alcoholic and Non Alcoholic Beverages Revenue (USD Million) By Product (2021-2032)
Table 29 Middle East and Africa Alcoholic and Non Alcoholic Beverages Revenue (USD Million) By Type (2021-2032)
Table 30 Middle East and Africa Alcoholic and Non Alcoholic Beverages Revenue (USD Million) By Application (2021-2032)
Table 31 Middle East and Africa Alcoholic and Non Alcoholic Beverages Revenue (USD Million) By Product (2021-2032)
LIST OF FIGURES
Figure 1. Market Scope
Figure 2. Pricing Forecasts Per Unit, 2023- 2032
Figure 3. Porter’s Five Forces
Figure 4. Global Alcoholic and Non Alcoholic Beverages Market Revenue (USD Million) By Regions (2021-2032)
Figure 5. Global Alcoholic and Non Alcoholic Beverages Market Share (%) By Regions (2023)
Figure 6. North America Alcoholic and Non Alcoholic Beverages Revenue (USD Million) By Country (2021-2032)
Figure 7. United States Alcoholic and Non Alcoholic Beverages Revenue (USD Million) By Country (2021-2032)
Figure 8. Canada Alcoholic and Non Alcoholic Beverages Revenue (USD Million) By Country (2021-2032)
Figure 9. Mexico Alcoholic and Non Alcoholic Beverages Revenue (USD Million) By Country (2021-2032)
Figure 10. Europe Alcoholic and Non Alcoholic Beverages Revenue (USD Million) By Country (2021-2032)
Figure 11. Germany Alcoholic and Non Alcoholic Beverages Revenue (USD Million) By Country (2021-2032)
Figure 12. France Alcoholic and Non Alcoholic Beverages Revenue (USD Million) By Country (2021-2032)
Figure 13. United Kingdom Alcoholic and Non Alcoholic Beverages Revenue (USD Million) By Country (2021-2032)
Figure 14. Spain Alcoholic and Non Alcoholic Beverages Revenue (USD Million) By Country (2021-2032)
Figure 15. Italy Alcoholic and Non Alcoholic Beverages Revenue (USD Million) By Country (2021-2032)
Figure 16. Russia Alcoholic and Non Alcoholic Beverages Revenue (USD Million) By Country (2021-2032)
Figure 17. Rest of Europe Alcoholic and Non Alcoholic Beverages Revenue (USD Million) By Country (2021-2032)
Figure 11. Asia Pacific Alcoholic and Non Alcoholic Beverages Revenue (USD Million) By Country (2021-2032)
Figure 12. China Alcoholic and Non Alcoholic Beverages Revenue (USD Million) By Country (2021-2032)
Figure 13. Japan Alcoholic and Non Alcoholic Beverages Revenue (USD Million) By Country (2021-2032)
Figure 14. India Alcoholic and Non Alcoholic Beverages Revenue (USD Million) By Country (2021-2032)
Figure 15. South Korea Alcoholic and Non Alcoholic Beverages Revenue (USD Million) By Country (2021-2032)
Figure 16. Australia Alcoholic and Non Alcoholic Beverages Revenue (USD Million) By Country (2021-2032)
Figure 17. South East Asia Alcoholic and Non Alcoholic Beverages Revenue (USD Million) By Country (2021-2032)
Figure 18. South America Alcoholic and Non Alcoholic Beverages Revenue (USD Million) By Country (2021-2032)
Figure 19. Brazil Alcoholic and Non Alcoholic Beverages Revenue (USD Million) By Country (2021-2032)
Figure 20. Argentina Alcoholic and Non Alcoholic Beverages Revenue (USD Million) By Country (2021-2032)
Figure 21. Rest of Asia Pacific Alcoholic and Non Alcoholic Beverages Revenue (USD Million) By Country (2021-2032)
Figure 22. Middle East and Africa Alcoholic and Non Alcoholic Beverages Revenue (USD Million) By Region (2021-2032)
Figure 23. Saudi Arabia Alcoholic and Non Alcoholic Beverages Revenue (USD Million) By Region (2021-2032)
Figure 24. The UAE Alcoholic and Non Alcoholic Beverages Revenue (USD Million) By Region (2021-2032)
Figure 25. Rest of Middle East Alcoholic and Non Alcoholic Beverages Revenue (USD Million) By Region (2021-2032)
Figure 26. South Africa Alcoholic and Non Alcoholic Beverages Revenue (USD Million) By Region (2021-2032)
Figure 27. Africa Alcoholic and Non Alcoholic Beverages Revenue (USD Million) By Region (2021-2032)
Figure 28. North America Alcoholic and Non Alcoholic Beverages Revenue (USD Million) By Type (2021-2032)
Figure 29. North America Alcoholic and Non Alcoholic Beverages Revenue (USD Million) By Application (2021-2032)
Figure 30. North America Alcoholic and Non Alcoholic Beverages Revenue (USD Million) By Product (2021-2032)
Figure 31. Europe Alcoholic and Non Alcoholic Beverages Revenue (USD Million) By Type (2021-2032)
Figure 32. Europe Alcoholic and Non Alcoholic Beverages Revenue (USD Million) By Application (2021-2032)
Figure 33. Europe Alcoholic and Non Alcoholic Beverages Revenue (USD Million) By Product (2021-2032)
Figure 34. Asia Pacific Alcoholic and Non Alcoholic Beverages Revenue (USD Million) By Type (2021-2032)
Figure 35. Asia Pacific Alcoholic and Non Alcoholic Beverages Revenue (USD Million) By Application (2021-2032)
Figure 36. Asia Pacific Alcoholic and Non Alcoholic Beverages Revenue (USD Million) By Product (2021-2032)
Figure 37. South America Alcoholic and Non Alcoholic Beverages Revenue (USD Million) By Type (2021-2032)
Figure 38. South America Alcoholic and Non Alcoholic Beverages Revenue (USD Million) By Application (2021-2032)
Figure 39. South America Alcoholic and Non Alcoholic Beverages Revenue (USD Million) By Product (2021-2032)
Figure 40. Middle East and Africa Alcoholic and Non Alcoholic Beverages Revenue (USD Million) By Type (2021-2032)
Figure 41. Middle East and Africa Alcoholic and Non Alcoholic Beverages Revenue (USD Million) By Application (2021-2032)
Figure 42. Middle East and Africa Alcoholic and Non Alcoholic Beverages Revenue (USD Million) By Product (2021-2032)
By Product
Alcoholic Beverages
-Beer
-Wine
-Spirits
Non-Alcoholic Beverages
-Energy & Sports Drink
-Soft Drinks
-Bottled Water
-Packaged Juice
-RTD Tea and Coffee
-Others
By Distribution Channel
On-trade
Off-trade
-Supermarkets/Hypermarkets
-Convenience/Grocery Stores
-Online Retail Stores
-Others
Countries Analyzed
North America (US, Canada, Mexico)
Europe (Germany, UK, France, Spain, Italy, Russia, Rest of Europe)
Asia Pacific (China, India, Japan, South Korea, Australia, South East Asia, Rest of Asia)
South America (Brazil, Argentina, Rest of South America)
Middle East and Africa (Saudi Arabia, UAE, Rest of Middle East, South Africa, Egypt, Rest of Africa)
