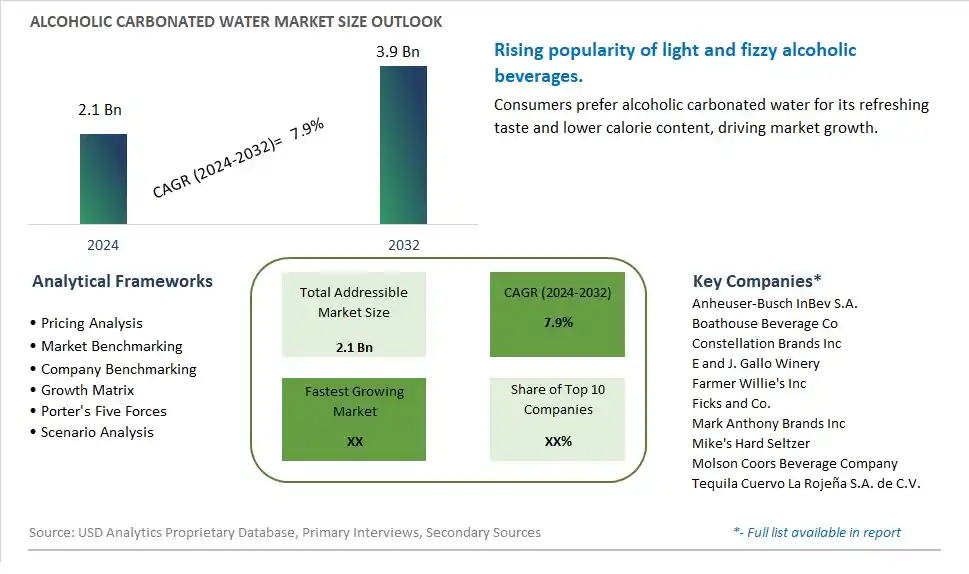
Global Alcoholic Carbonated Water Market Size is valued at $2.1 Billion in 2024 and is forecast to register a growth rate (CAGR) of 7.9% to reach $3.9 Billion by 2032.
The global Alcoholic Carbonated Water Market Comprehensive Study analyzes and forecasts the market size across 6 regions and 24 countries for diverse segments -By Type (Flavored, Plain), By Packaging (Bottles, Cans), By Distribution Channel (Supermarkets/Hypermarkets, Specialty Stores, Online Retail, Others)
An Introduction to Alcoholic Carbonated Water Market
In 2024, the Alcoholic Carbonated Water market is witnessing significant growth, propelled by the rising consumer preference for light and refreshing alcoholic beverages. The market segment, which includes products like hard seltzers, is popular among health-conscious consumers looking for low-calorie and low-sugar options. The market is supported by innovations in flavoring and carbonation technologies, offering a variety of fruity and exotic tastes. The convenience of canned packaging and the appeal of a sessionable beverage are further driving demand. The market is also seeing increased competition and product differentiation as new brands enter the space and existing brands expand their offerings.
Alcoholic Carbonated Water Competitive Landscape
The market report analyses the leading companies in the industry including Anheuser-Busch InBev S.A., Boathouse Beverage Co, Constellation Brands Inc, E and J. Gallo Winery, Farmer Willie's Inc, Ficks and Co., Mark Anthony Brands Inc, Mike's Hard Seltzer, Molson Coors Beverage Company, Tequila Cuervo La Rojeña S.A. de C.V., and Others.
Alcoholic Carbonated Water Market Dynamics
Alcoholic Carbonated Water Market Trend: Increasing Popularity of Hard Seltzers
The market for alcoholic carbonated water, commonly known as hard seltzers, is experiencing a significant trend towards increasing popularity. Consumers are gravitating towards these beverages due to their refreshing taste, lower calorie count, and perceived health benefits compared to traditional alcoholic drinks. Hard seltzers often appeal to a younger demographic and those looking for a lighter alternative to beer and cocktails. This trend is fueled by the rise of health-conscious drinking habits, with many opting for beverages that align with their lifestyle choices focused on wellness and moderation. The clean label movement, emphasizing natural flavors and minimal ingredients, also supports the popularity of hard seltzers.
Alcoholic Carbonated Water Market Driver: Shift in Consumer Preferences Towards Low-Calorie Alcoholic Beverages
The primary driver for the alcoholic carbonated water market is the shift in consumer preferences towards low-calorie alcoholic beverages. As more consumers become health-conscious and mindful of their calorie intake, there is a growing demand for alcoholic options that do not compromise on flavor but offer lower calories and sugars. Hard seltzers, which typically have fewer calories and carbs than traditional beers and mixed drinks, cater perfectly to this demand. This shift is further driven by the rise in fitness culture and dietary trends that emphasize balanced consumption, making hard seltzers a preferred choice for those seeking a healthier alternative without sacrificing their social drinking habits.
Alcoholic Carbonated Water Market Opportunity: Product Innovation and Market Expansion
A significant opportunity for the alcoholic carbonated water market lies in product innovation and market expansion. Companies can explore new and exotic flavor combinations, functional ingredients like vitamins and electrolytes, and even collaborations with popular brands to create unique and appealing products. Additionally, expanding into untapped markets, both geographically and demographically, can drive growth. This includes targeting regions where hard seltzers are not yet widely available and appealing to older demographics who may appreciate the low-calorie aspect but are not yet familiar with the product. Effective marketing strategies that highlight the health benefits, variety of flavors, and lifestyle compatibility of hard seltzers can further boost consumer adoption and market presence.
Alcoholic Carbonated Water Market Share Analysis: Flavored segment generated the highest revenue share in the industry
The Flavored segment is the largest in the Alcoholic Carbonated Water Market by type. Flavored alcoholic carbonated waters, commonly known as hard seltzers, have surged in popularity due to their refreshing taste, lower calorie content, and variety of flavor options. Consumers are increasingly drawn to these beverages as a lighter alternative to traditional alcoholic drinks such as beer and cocktails. The variety of flavors, ranging from citrus and berry to more exotic options, caters to a wide range of taste preferences, making flavored alcoholic carbonated water a versatile and appealing choice for many consumers. The marketing and branding efforts by major beverage companies have also played a significant role in driving the demand for flavored options, solidifying their position as the largest segment in the market.
Alcoholic Carbonated Water Market Share Analysis: Cans is the fastest growing segment over the forecast period to 2032
The Cans segment within the Alcoholic Carbonated Water Market is projected to be the fastest growing segment by 2032. This rapid growth is driven by the convenience, portability, and sustainability that canned beverages offer. Cans are lightweight, easy to transport, and ideal for outdoor activities, making them a popular choice among consumers. The environmental benefits of cans, such as their high recyclability and lower carbon footprint compared to bottles, also appeal to the growing number of ecoconscious consumers. Additionally, the trend of singleserve packaging aligns well with the can format, further boosting its popularity. As consumers continue to prioritize convenience and sustainability, the demand for canned alcoholic carbonated water is expected to see substantial growth, making it the fastest growing packaging option through 2032.
Alcoholic Carbonated Water Market Share Analysis: Supermarkets/Hypermarkets segment generated the highest revenue share in the industry
The Supermarkets/Hypermarkets segment is the largest in the Alcoholic Carbonated Water Market by distribution channel. This segment's prominence is due to the extensive reach and accessibility of supermarkets and hypermarkets, which serve as primary shopping destinations for a wide range of consumer goods, including alcoholic beverages. These large retail formats offer a vast selection of products, allowing consumers to easily find and purchase their preferred brands and flavors of alcoholic carbonated water. The strategic placement of promotional displays and the convenience of onestop shopping further enhance the appeal of supermarkets and hypermarkets. Additionally, the ability to buy in bulk and take advantage of discounts and promotions makes these retail channels particularly attractive to consumers, solidifying their position as the largest distribution channel in the market.
Alcoholic Carbonated Water Market Segmentation
By Type
Flavored
Plain
By Packaging
Bottles
Cans
By Distribution Channel
Supermarkets/Hypermarkets
Specialty Stores
Online Retail
Others
Countries Analyzed
North America (US, Canada, Mexico)
Europe (Germany, UK, France, Spain, Italy, Russia, Rest of Europe)
Asia Pacific (China, India, Japan, South Korea, Australia, South East Asia, Rest of Asia)
South America (Brazil, Argentina, Rest of South America)
Middle East and Africa (Saudi Arabia, UAE, Rest of Middle East, South Africa, Egypt, Rest of Africa)
Alcoholic Carbonated Water Companies Profiled in the Study
Anheuser-Busch InBev S.A.
Boathouse Beverage Co
Constellation Brands Inc
E and J. Gallo Winery
Farmer Willie's Inc
Ficks and Co.
Mark Anthony Brands Inc
Mike's Hard Seltzer
Molson Coors Beverage Company
Tequila Cuervo La Rojeña S.A. de C.V.
*- List Not Exhaustive
Chapter 1. TABLE OF CONTENTS
Chapter 2. Introduction to Alcoholic Carbonated Water Market
2.1. Market Overview
2.2. Key Statistics and Report Highlights
2.3. Scope of the Comprehensive Study
2.3.1. Market Definition
2.3.2 Countries and Regions Covered
2.3.3 Research Objective
2.3.4 Units, Currency, and Conversions
2.3.5 Industry Value Chain
2.4. Key Market Segments
2.5. Key Companies
2.6. Study Period
Chapter 3. Strategic Analysis Review
3.1. Alcoholic Carbonated Water Pricing Analysis and Forecast
3.2. Porter’s Five Forces
3.3. Market Ecosystem
3.4. SWOT Analysis
3.5. Regulatory Scenario
3.3. Effects of Inflation, Russia-Ukraine War, moderating economic growth, and other macroeconomic factors
Chapter 4. Competitive Landscape
4.1. Market Share Analysis
4.1.1. Global Alcoholic Carbonated Water Market Share by Company, 2023
4.1.2. Product Offerings of Leading Alcoholic Carbonated Water Companies
4.2. Market Entropy
4.2.1. New Product Launches in the Industry
4.2.2. Mergers, Acquisitions, Joint ventures, and Partnerships
4.3. Key Strategies and Best Practices
Chapter 5. Global Market Projections: Best, Reference, and Low Case Scenarios
5.1. Growth Analysis- Case Scenario Definitions
5.2. Low Growth Case Scenario Forecasts
5.3. Reference Growth Case Scenario Forecasts
5.4. High Growth Case Scenario Forecasts
Chapter 6. Market Dynamics
6.1. Alcoholic Carbonated Water Market Drivers
6.2. Alcoholic Carbonated Water Market Challenges
6.6. Alcoholic Carbonated Water Market Opportunities
6.4. Alcoholic Carbonated Water Market Trends
Chapter 7. Global Alcoholic Carbonated Water Market Outlook Trends
7.1. Global Alcoholic Carbonated Water Revenue (USD Million) and CAGR (%) by Type (2021-2032)
7.2. Global Alcoholic Carbonated Water Revenue (USD Million) and CAGR (%) by Application (2021-2032)
7.3. Global Alcoholic Carbonated Water Revenue (USD Million) and CAGR (%) by Product (2021-2032)
By Type
Flavored
Plain
By Packaging
Bottles
Cans
By Distribution Channel
Supermarkets/Hypermarkets
Specialty Stores
Online Retail
Others
Chapter 8. Global Alcoholic Carbonated Water Regional Analysis and Outlook
8.1. Global Alcoholic Carbonated Water Revenue (USD Million) By Regions (2021- 2032)
8.2. North America Alcoholic Carbonated Water Revenue (USD Million) by Country (2021-2032)
8.2.1. United States Alcoholic Carbonated Water Regional Analysis and Outlook
8.2.2. Canada Alcoholic Carbonated Water Regional Analysis and Outlook
8.2.3. Mexico Alcoholic Carbonated Water Regional Analysis and Outlook
8.3. Europe Alcoholic Carbonated Water Revenue (USD Million), by Country (2021-2032)
8.3.1. Germany Alcoholic Carbonated Water Regional Analysis and Outlook
8.3.2. France Alcoholic Carbonated Water Regional Analysis and Outlook
8.3.3. United Kingdom Alcoholic Carbonated Water Regional Analysis and Outlook
8.3.4. Spain Alcoholic Carbonated Water Regional Analysis and Outlook
8.3.5. Italy Alcoholic Carbonated Water Regional Analysis and Outlook
8.3.6. Russia Alcoholic Carbonated Water Regional Analysis and Outlook
8.3.7. Rest of Europe Alcoholic Carbonated Water Regional Analysis and Outlook
8.4. Asia Pacific Alcoholic Carbonated Water Revenue (USD Million) by Country (2021-2032)
8.4.1. China Alcoholic Carbonated Water Regional Analysis and Outlook
8.4.2. Japan Alcoholic Carbonated Water Regional Analysis and Outlook
8.4.3. India Alcoholic Carbonated Water Regional Analysis and Outlook
8.4.4. South Korea Alcoholic Carbonated Water Regional Analysis and Outlook
8.4.5. Australia Alcoholic Carbonated Water Regional Analysis and Outlook
8.4.6. South East Asia Alcoholic Carbonated Water Regional Analysis and Outlook
8.4.7. Rest of Asia Pacific Alcoholic Carbonated Water Regional Analysis and Outlook
8.5. South America Alcoholic Carbonated Water Revenue (USD Million), by Country (2021-2032)
8.5.1. Brazil Alcoholic Carbonated Water Regional Analysis and Outlook
8.5.2. Argentina Alcoholic Carbonated Water Regional Analysis and Outlook
8.5.3. Rest of South America Alcoholic Carbonated Water Regional Analysis and Outlook
8.6. Middle East and Africa Alcoholic Carbonated Water Revenue (USD Million) by Country (2021-2032)
8.6.1. Middle East Alcoholic Carbonated Water Regional Analysis and Outlook
8.6.2. Africa Alcoholic Carbonated Water Regional Analysis and Outlook
Chapter 9. North America Alcoholic Carbonated Water Analysis and Outlook
9.1. North America Alcoholic Carbonated Water Revenue (USD Million) by Segments (2021-2032)
9.1.1. North America Alcoholic Carbonated Water Revenue (USD Million) by Type (2021-2032)
9.1.2. North America Alcoholic Carbonated Water Revenue (USD Million) by Application (2021-2032)
9.1.3. North America Alcoholic Carbonated Water Revenue (USD Million) by Product (2021-2032)
By Type
Flavored
Plain
By Packaging
Bottles
Cans
By Distribution Channel
Supermarkets/Hypermarkets
Specialty Stores
Online Retail
Others
Chapter 10. Europe Alcoholic Carbonated Water Analysis and Outlook
10.1. Europe Alcoholic Carbonated Water Revenue (USD Million), by Segments (USD Million) (2021-2032)
10.1.1. Europe Alcoholic Carbonated Water Revenue (USD Million) by Type (2021-2032)
10.1.2. Europe Alcoholic Carbonated Water Revenue (USD Million) by Application (2021-2032)
10.1.3. Europe Alcoholic Carbonated Water Revenue (USD Million) by Product (2021-2032)
By Type
Flavored
Plain
By Packaging
Bottles
Cans
By Distribution Channel
Supermarkets/Hypermarkets
Specialty Stores
Online Retail
Others
Chapter 11. Asia Pacific Alcoholic Carbonated Water Analysis and Outlook
11.1. Asia Pacific Alcoholic Carbonated Water Revenue (USD Million), and Revenue (USD Million) by Segments (2021-2032)
11.1.1. Asia Pacific Alcoholic Carbonated Water Revenue (USD Million) by Type (2021-2032)
11.1.2. Asia Pacific Alcoholic Carbonated Water Revenue (USD Million) by Application (2021-2032)
11.1.3. Asia Pacific Alcoholic Carbonated Water Revenue (USD Million) by Product (2021-2032)
By Type
Flavored
Plain
By Packaging
Bottles
Cans
By Distribution Channel
Supermarkets/Hypermarkets
Specialty Stores
Online Retail
Others
Chapter 12. South America Alcoholic Carbonated Water Analysis and Outlook
12.1. South America Alcoholic Carbonated Water Revenue (USD Million), by Segments (2021-2032)
12.1.1. South America Alcoholic Carbonated Water Revenue (USD Million) by Type (2021-2032)
12.1.2. South America Alcoholic Carbonated Water Revenue (USD Million) by Application (2021-2032)
12.1.3. South America Alcoholic Carbonated Water Revenue (USD Million) by Product (2021-2032)
By Type
Flavored
Plain
By Packaging
Bottles
Cans
By Distribution Channel
Supermarkets/Hypermarkets
Specialty Stores
Online Retail
Others
Chapter 13. Middle East and Africa Alcoholic Carbonated Water Analysis and Outlook
13.1. Middle East and Africa Alcoholic Carbonated Water Revenue (USD Million), by Segments (2021-2032)
13.1.1. Middle East and Africa Alcoholic Carbonated Water Revenue (USD Million) by Type (2021-2032)
13.1.2. Middle East and Africa Alcoholic Carbonated Water Revenue (USD Million) by Application (2021-2032)
13.1.3. Middle East and Africa Alcoholic Carbonated Water Revenue (USD Million) by Product (2021-2032)
By Type
Flavored
Plain
By Packaging
Bottles
Cans
By Distribution Channel
Supermarkets/Hypermarkets
Specialty Stores
Online Retail
Others
Chapter 14. Alcoholic Carbonated Water Company Profiles
14.1 Business Overview
14.2 Product Profiles
14.3 SWOT Profiles
14.5 Recent Developments
14.6 Financial Profile
List of Companies
Anheuser-Busch InBev S.A.
Boathouse Beverage Co
Constellation Brands Inc
E and J. Gallo Winery
Farmer Willie's Inc
Ficks and Co.
Mark Anthony Brands Inc
Mike's Hard Seltzer
Molson Coors Beverage Company
Tequila Cuervo La Rojeña S.A. de C.V.
15. Methodology and Data Sources
15.1 Customization Offerings
15.2 Subscription Services
15.3 Related Reports
15.4 Publisher Expertise
LIST OF TABLES
Table 1 Market Segmentation Analysis
Table 2 Global Alcoholic Carbonated Water Market Share of Leading Companies, 2023
Table 3 Product Offerings of Leading Companies
Table 4 Low Growth Scenario Forecasts
Table 5 Reference Case Growth Scenario
Table 6 High Growth Case Scenario
Table 7 Global Alcoholic Carbonated Water Revenue (USD Million) And CAGR (%) By Type (2021-2032)
Table 8 Global Alcoholic Carbonated Water Revenue (USD Million) And CAGR (%) By Application (2021-2032)
Table 9 Global Alcoholic Carbonated Water Revenue (USD Million) And CAGR (%) By Product (2021-2032)
Table 10 Global Alcoholic Carbonated Water Market Revenue (USD Million) By Regions (2021-2032)
Table 11 Global Alcoholic Carbonated Water Market Share (%) By Regions (2021-2032)
Table 12 North America Alcoholic Carbonated Water Revenue (USD Million) By Country (2021-2032)
Table 13 Europe Alcoholic Carbonated Water Revenue (USD Million) By Country (2021-2032)
Table 14 Asia Pacific Alcoholic Carbonated Water Revenue (USD Million) By Country (2021-2032)
Table 15 South America Alcoholic Carbonated Water Revenue (USD Million) By Country (2021-2032)
Table 16 Middle East and Africa Alcoholic Carbonated Water Revenue (USD Million) By Region (2021-2032)
Table 17 North America Alcoholic Carbonated Water Revenue (USD Million) By Type (2021-2032)
Table 18 North America Alcoholic Carbonated Water Revenue (USD Million) By Application (2021-2032)
Table 19 North America Alcoholic Carbonated Water Revenue (USD Million) By Product (2021-2032)
Table 20 Europe Alcoholic Carbonated Water Revenue (USD Million) By Type (2021-2032)
Table 21 Europe Alcoholic Carbonated Water Revenue (USD Million) By Application (2021-2032)
Table 22 Europe Alcoholic Carbonated Water Revenue (USD Million) By Product (2021-2032)
Table 23 Asia Pacific Alcoholic Carbonated Water Revenue (USD Million) By Type (2021-2032)
Table 24 Asia Pacific Alcoholic Carbonated Water Revenue (USD Million) By Application (2021-2032)
Table 25 Asia Pacific Alcoholic Carbonated Water Revenue (USD Million) By Product (2021-2032)
Table 26 South America Alcoholic Carbonated Water Revenue (USD Million) By Type (2021-2032)
Table 27 South America Alcoholic Carbonated Water Revenue (USD Million) By Application (2021-2032)
Table 28 South America Alcoholic Carbonated Water Revenue (USD Million) By Product (2021-2032)
Table 29 Middle East and Africa Alcoholic Carbonated Water Revenue (USD Million) By Type (2021-2032)
Table 30 Middle East and Africa Alcoholic Carbonated Water Revenue (USD Million) By Application (2021-2032)
Table 31 Middle East and Africa Alcoholic Carbonated Water Revenue (USD Million) By Product (2021-2032)
LIST OF FIGURES
Figure 1. Market Scope
Figure 2. Pricing Forecasts Per Unit, 2023- 2032
Figure 3. Porter’s Five Forces
Figure 4. Global Alcoholic Carbonated Water Market Revenue (USD Million) By Regions (2021-2032)
Figure 5. Global Alcoholic Carbonated Water Market Share (%) By Regions (2023)
Figure 6. North America Alcoholic Carbonated Water Revenue (USD Million) By Country (2021-2032)
Figure 7. United States Alcoholic Carbonated Water Revenue (USD Million) By Country (2021-2032)
Figure 8. Canada Alcoholic Carbonated Water Revenue (USD Million) By Country (2021-2032)
Figure 9. Mexico Alcoholic Carbonated Water Revenue (USD Million) By Country (2021-2032)
Figure 10. Europe Alcoholic Carbonated Water Revenue (USD Million) By Country (2021-2032)
Figure 11. Germany Alcoholic Carbonated Water Revenue (USD Million) By Country (2021-2032)
Figure 12. France Alcoholic Carbonated Water Revenue (USD Million) By Country (2021-2032)
Figure 13. United Kingdom Alcoholic Carbonated Water Revenue (USD Million) By Country (2021-2032)
Figure 14. Spain Alcoholic Carbonated Water Revenue (USD Million) By Country (2021-2032)
Figure 15. Italy Alcoholic Carbonated Water Revenue (USD Million) By Country (2021-2032)
Figure 16. Russia Alcoholic Carbonated Water Revenue (USD Million) By Country (2021-2032)
Figure 17. Rest of Europe Alcoholic Carbonated Water Revenue (USD Million) By Country (2021-2032)
Figure 11. Asia Pacific Alcoholic Carbonated Water Revenue (USD Million) By Country (2021-2032)
Figure 12. China Alcoholic Carbonated Water Revenue (USD Million) By Country (2021-2032)
Figure 13. Japan Alcoholic Carbonated Water Revenue (USD Million) By Country (2021-2032)
Figure 14. India Alcoholic Carbonated Water Revenue (USD Million) By Country (2021-2032)
Figure 15. South Korea Alcoholic Carbonated Water Revenue (USD Million) By Country (2021-2032)
Figure 16. Australia Alcoholic Carbonated Water Revenue (USD Million) By Country (2021-2032)
Figure 17. South East Asia Alcoholic Carbonated Water Revenue (USD Million) By Country (2021-2032)
Figure 18. South America Alcoholic Carbonated Water Revenue (USD Million) By Country (2021-2032)
Figure 19. Brazil Alcoholic Carbonated Water Revenue (USD Million) By Country (2021-2032)
Figure 20. Argentina Alcoholic Carbonated Water Revenue (USD Million) By Country (2021-2032)
Figure 21. Rest of Asia Pacific Alcoholic Carbonated Water Revenue (USD Million) By Country (2021-2032)
Figure 22. Middle East and Africa Alcoholic Carbonated Water Revenue (USD Million) By Region (2021-2032)
Figure 23. Saudi Arabia Alcoholic Carbonated Water Revenue (USD Million) By Region (2021-2032)
Figure 24. The UAE Alcoholic Carbonated Water Revenue (USD Million) By Region (2021-2032)
Figure 25. Rest of Middle East Alcoholic Carbonated Water Revenue (USD Million) By Region (2021-2032)
Figure 26. South Africa Alcoholic Carbonated Water Revenue (USD Million) By Region (2021-2032)
Figure 27. Africa Alcoholic Carbonated Water Revenue (USD Million) By Region (2021-2032)
Figure 28. North America Alcoholic Carbonated Water Revenue (USD Million) By Type (2021-2032)
Figure 29. North America Alcoholic Carbonated Water Revenue (USD Million) By Application (2021-2032)
Figure 30. North America Alcoholic Carbonated Water Revenue (USD Million) By Product (2021-2032)
Figure 31. Europe Alcoholic Carbonated Water Revenue (USD Million) By Type (2021-2032)
Figure 32. Europe Alcoholic Carbonated Water Revenue (USD Million) By Application (2021-2032)
Figure 33. Europe Alcoholic Carbonated Water Revenue (USD Million) By Product (2021-2032)
Figure 34. Asia Pacific Alcoholic Carbonated Water Revenue (USD Million) By Type (2021-2032)
Figure 35. Asia Pacific Alcoholic Carbonated Water Revenue (USD Million) By Application (2021-2032)
Figure 36. Asia Pacific Alcoholic Carbonated Water Revenue (USD Million) By Product (2021-2032)
Figure 37. South America Alcoholic Carbonated Water Revenue (USD Million) By Type (2021-2032)
Figure 38. South America Alcoholic Carbonated Water Revenue (USD Million) By Application (2021-2032)
Figure 39. South America Alcoholic Carbonated Water Revenue (USD Million) By Product (2021-2032)
Figure 40. Middle East and Africa Alcoholic Carbonated Water Revenue (USD Million) By Type (2021-2032)
Figure 41. Middle East and Africa Alcoholic Carbonated Water Revenue (USD Million) By Application (2021-2032)
Figure 42. Middle East and Africa Alcoholic Carbonated Water Revenue (USD Million) By Product (2021-2032)
By Type
Flavored
Plain
By Packaging
Bottles
Cans
By Distribution Channel
Supermarkets/Hypermarkets
Specialty Stores
Online Retail
Others
Countries Analyzed
North America (US, Canada, Mexico)
Europe (Germany, UK, France, Spain, Italy, Russia, Rest of Europe)
Asia Pacific (China, India, Japan, South Korea, Australia, South East Asia, Rest of Asia)
South America (Brazil, Argentina, Rest of South America)
Middle East and Africa (Saudi Arabia, UAE, Rest of Middle East, South Africa, Egypt, Rest of Africa)
