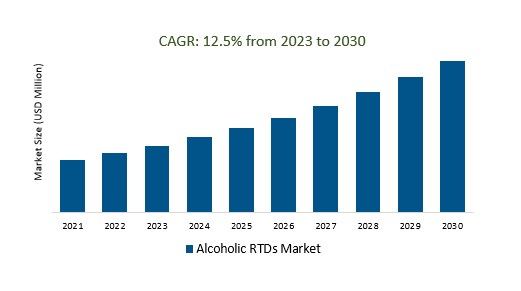
The Global Alcoholic RTDs Market is estimated to register 12.5% growth over the forecast period from 2023 to 2030.
The market growth is driven by the increasing Consumers who are increasingly looking for unique and exotic flavors in alcoholic RTDs, driving innovation in flavor profiles and combinations. Leading companies that are focused on Expanding Product Variety, Sustainability, Eco-Friendly Packaging, Global Expansion, On-the-Go Convenience, Regulatory Changes, Virtual and At-Home Experiences, Health and Safety Awareness, and others to boost market shares in the industry.
Market Overview
The Alcoholic Ready-to-Drink (RTD) market, characterized by pre-mixed, convenient cocktails, experienced substantial growth due to changing consumer preferences, convenience, and innovation, particularly popular among younger generations. Key drivers included flavor innovation, health-consciousness, craft options, sustainability, and premiumization. Competition was fierce, with branding and marketing playing a vital role. Regulations vary by region, impacting product availability.
Market Dynamics
Market Trends - Health and Wellness: A New Frontier for Alcoholic RTDs
The emerging trend in alcoholic Ready-to-Drink (RTD) beverages is a shift towards health and wellness, marked by low-calorie, low-sugar options, natural and organic ingredients, functional additives, lower alcohol content, transparent labeling, alternative bases, mindful drinking promotion, sustainability, innovative flavors, and wellness-oriented marketing. This reflects consumers' growing desire for healthier and more responsible drinking choices within the alcoholic RTD market.
Market Driver- Marketing and Branding Demand Alcoholic RTDs Market
Marketing and branding are crucial drivers of demand in the alcoholic Ready-to-Drink (RTD) market. Effective marketing strategies and strong branding help create awareness, appeal to target demographics, and differentiate products. They highlight product features such as flavor, quality, and health benefits while also emphasizing the lifestyle and experience associated with these beverages. In a competitive market, successful marketing and branding campaigns play a pivotal role in shaping consumer preferences and driving sales.
Market Opportunity-Introduction of Lifestyle Changes
Lifestyle changes are significantly influencing the alcoholic Ready-to-Drink (RTD) market. Consumers are seeking convenient, lower-calorie, and healthier options, leading to the rise of RTDs with reduced sugar content, natural ingredients, and lower alcohol by volume. There is also a growing trend towards mindful drinking, emphasizing responsible consumption. Sustainable packaging and transparent labeling are gaining importance, aligning with environmentally conscious lifestyles.
Market Share Analysis- Malt Base Alcoholic RTDs Market will register the fastest growth
The Global Alcoholic RTDs Market is analyzed across Malt Base, Spirit Base, Wine Base, and others. Malt Base is poised to register the fastest growth. Malt bases are gaining popularity in the Alcoholic Ready-to-Drink (RTD) market due to their versatility, flavor variety, and alignment with craft and premium beverage trends, offering a bridge between traditional beer and innovative mixed drinks, broadening consumer choices in the RTD sector.
Market Share Analysis- Online held a significant market share in 2023
The Global Alcoholic RTDs Market is analyzed across various applications including Supermarkets, Convenience Stores, Liquor Stores, Online, and others. Of these, online held a significant market share in 2023. The online channel has become a crucial component of the Alcoholic Ready-to-Drink (RTD) market, providing convenient access to a diverse range of RTD products, fostering digital shopping trends, enabling product discovery, and offering opportunities for brands to engage consumers through targeted marketing and direct sales.
Alcoholic RTDs Market Segmentation
By Type
- Malt Base
- Spirit Base
- Wine Base
- Others
By Application
- Supermarkets
- Convenience Store
- Liquor Stores
- Online
- Others
By Flavour
- Grapefruit
- Lime
- Mango
- Black Cherry
- Others
By Region
- North America (United States, Canada, Mexico)
- Europe (Germany, France, United Kingdom, Spain, Italy, Others)
- Asia Pacific (China, India, Japan, South Korea, Australia, Others)
- Latin America (Brazil, Argentina, Others)
- Middle East and Africa (Saudi Arabia, UAE, Kuwait, Other Middle East, South Africa, Nigeria, Other Africa)
Alcoholic RTDs Market Companies
- Beam Suntory (United States)
- Bacardi limited (Bermuda)
- White Claw Hard Seltzer (United States)
- Diageo (United Kingdom)
- Suntory Holdings Limited (Japan)
- Phusion Projects (United States)
- Loverboy Inc (United States)
- Mark Anthony Brands (Canada)
- Anheuser Busch (United States)
- Brown Forman (United States)
*List not exhaustive
Alcoholic RTDs Market Outlook 2023
1 Market Overview
1.1 Introduction to the Alcoholic RTDs Market
1.2 Scope of the Study
1.3 Research Objective
1.3.1 Key Market Scope and Segments
1.3.2 Players Covered
1.3.3 Years Considered
2 Executive Summary
2.1 2023 Alcoholic RTDs - Market Statistics
3 Market Dynamics
3.1 Market Drivers
3.2 Market Challenges
3.3 Market Opportunities
3.4 Market Trends
4 Market Factor Analysis
4.1 Porter’s Five Forces
4.2 Market Entropy
4.2.1 Global Alcoholic RTDs Market Companies with Area Served
4.2.2 Products Offerings Global Alcoholic RTDs Market
5 COVID-19 Impact Analysis and Outlook Scenarios
5.1.1 Covid-19 Impact Analysis
5.1.2 post-COVID-19 Scenario- Low Growth Case
5.1.3 post-COVID-19 Scenario- Reference Growth Case
5.1.4 post-COVID-19 Scenario- Low Growth Case
6 Global Alcoholic RTDs Market Trends
6.1 Global Alcoholic RTDs Revenue (USD Million) and CAGR (%) by Type (2018-2030)
6.2 Global Alcoholic RTDs Revenue (USD Million) and CAGR (%) by Applications (2018-2030)
6.3 Global Alcoholic RTDs Revenue (USD Million) and CAGR (%) by regions (2018-2030)
7 Global Alcoholic RTDs Market Revenue (USD Million) by Type, and Applications (2018-2022)
7.1 Global Alcoholic RTDs Revenue (USD Million) by Type (2018-2022)
7.1.1 Global Alcoholic RTDs Revenue (USD Million), Market Share (%) by Type (2018-2022)
7.2 Global Alcoholic RTDs Revenue (USD Million) by Applications (2018-2022)
7.2.1 Global Alcoholic RTDs Revenue (USD Million), Market Share (%) by Applications (2018-2022)
8 Global Alcoholic RTDs Development Regional Status and Outlook
8.1 Global Alcoholic RTDs Revenue (USD Million) By Regions (2018-2022)
8.2 North America Alcoholic RTDs Revenue (USD Million) by Type, and Application (2018-2022)
8.2.1 North America Alcoholic RTDs Revenue (USD Million) by Country (2018-2022)
8.2.2 North America Alcoholic RTDs Revenue (USD Million) by Type (2018-2022)
8.2.3 North America Alcoholic RTDs Revenue (USD Million) by Applications (2018-2022)
8.3 Europe Alcoholic RTDs Revenue (USD Million), by Type, and Applications (USD Million) (2018-2022)
8.3.1 Europe Alcoholic RTDs Revenue (USD Million), by Country (2018-2022)
8.3.2 Europe Alcoholic RTDs Revenue (USD Million) by Type (2018-2022)
8.3.3 Europe Alcoholic RTDs Revenue (USD Million) by Applications (2018-2022)
8.4 Asia Pacific Alcoholic RTDs Revenue (USD Million), and Revenue (USD Million) by Type, and Applications (2018-2022)
8.4.1 Asia Pacific Alcoholic RTDs Revenue (USD Million) by Country (2018-2022)
8.4.2 Asia Pacific Alcoholic RTDs Revenue (USD Million) by Type (2018-2022)
8.4.3 Asia Pacific Alcoholic RTDs Revenue (USD Million) by Applications (2018-2022)
8.5 South America Alcoholic RTDs Revenue (USD Million), by Type, and Applications (2018-2022)
8.5.1 South America Alcoholic RTDs Revenue (USD Million), by Country (2018-2022)
8.5.2 South America Alcoholic RTDs Revenue (USD Million) by Type (2018-2022)
8.5.3 South America Alcoholic RTDs Revenue (USD Million) by Applications (2018-2022)
8.6 Middle East and Africa Alcoholic RTDs Revenue (USD Million), by Type, Technology, Application, Thickness (2018-2022)
8.6.1 Middle East and Africa Alcoholic RTDs Revenue (USD Million) by Country (2018-2022)
8.6.2 Middle East and Africa Alcoholic RTDs Revenue (USD Million) by Type (2018-2022)
8.6.3 Middle East and Africa Alcoholic RTDs Revenue (USD Million) by Applications (2018-2022)
9 Company Profiles
10 Global Alcoholic RTDs Market Revenue (USD Million), by Type, and Applications (2023-2030)
10.1 Global Alcoholic RTDs Revenue (USD Million) and Market Share (%) by Type (2023-2030)
10.1.1 Global Alcoholic RTDs Revenue (USD Million), and Market Share (%) by Type (2023-2030)
10.2 Global Alcoholic RTDs Revenue (USD Million) and Market Share (%) by Applications (2023-2030)
10.2.1 Global Alcoholic RTDs Revenue (USD Million), and Market Share (%) by Applications (2023-2030)
11 Global Alcoholic RTDs Development Regional Status and Outlook Forecast
11.1 Global Alcoholic RTDs Revenue (USD Million) By Regions (2023-2030)
11.2 North America Alcoholic RTDs Revenue (USD Million) by Type, and Applications (2023-2030)
11.2.1 North America Alcoholic RTDs Revenue (USD) Million by Country (2023-2030)
11.2.2 North America Alcoholic RTDs Revenue (USD Million), by Type (2023-2030)
11.2.3 North America Alcoholic RTDs Revenue (USD Million), Market Share (%) by Applications (2023-2030)
11.3 Europe Alcoholic RTDs Revenue (USD Million), by Type, and Applications (2023-2030)
11.3.1 Europe Alcoholic RTDs Revenue (USD Million), by Country (2023-2030)
11.3.2 Europe Alcoholic RTDs Revenue (USD Million), by Type (2023-2030)
11.3.3 Europe Alcoholic RTDs Revenue (USD Million), by Applications (2023-2030)
11.4 Asia Pacific Alcoholic RTDs Revenue (USD Million) by Type, and Applications (2023-2030)
11.4.1 Asia Pacific Alcoholic RTDs Revenue (USD Million), by Country (2023-2030)
11.4.2 Asia Pacific Alcoholic RTDs Revenue (USD Million), by Type (2023-2030)
11.4.3 Asia Pacific Alcoholic RTDs Revenue (USD Million), by Applications (2023-2030)
11.5 South America Alcoholic RTDs Revenue (USD Million), by Type, and Applications (2023-2030)
11.5.1 South America Alcoholic RTDs Revenue (USD Million), by Country (2023-2030)
11.5.2 South America Alcoholic RTDs Revenue (USD Million), by Type (2023-2030)
11.5.3 South America Alcoholic RTDs Revenue (USD Million), by Applications (2023-2030)
11.6 Middle East and Africa Alcoholic RTDs Revenue (USD Million), by Type, and Applications (2023-2030)
11.6.1 Middle East and Africa Alcoholic RTDs Revenue (USD Million), by region (2023-2030)
11.6.2 Middle East and Africa Alcoholic RTDs Revenue (USD Million), by Type (2023-2030)
11.6.3 Middle East and Africa Alcoholic RTDs Revenue (USD Million), by Applications (2023-2030)
12 Methodology and Data Sources
12.1 Methodology/Research Approach
12.1.1 Research Programs/Design
12.1.2 Market Size Estimation
12.1.3 Market Breakdown and Data Triangulation
12.2 Data Sources
12.2.1 Secondary Sources
12.2.2 Primary Sources
12.3 Disclaimer
List of Tables
Table 1 Market Segmentation Analysis
Table 2 Global Alcoholic RTDs Market Companies with Areas Served
Table 3 Products Offerings Global Alcoholic RTDs Market
Table 4 Low Growth Scenario Forecasts
Table 5 Reference Case Growth Scenario
Table 6 High Growth Case Scenario
Table 7 Global Alcoholic RTDs Revenue (USD Million) And CAGR (%) By Type (2018-2030)
Table 8 Global Alcoholic RTDs Revenue (USD Million) And CAGR (%) By Applications (2018-2030)
Table 9 Global Alcoholic RTDs Revenue (USD Million) And CAGR (%) By Regions (2018-2030)
Table 10 Global Alcoholic RTDs Revenue (USD Million) By Type (2018-2022)
Table 11 Global Alcoholic RTDs Revenue Market Share (%) By Type (2018-2022)
Table 12 Global Alcoholic RTDs Revenue (USD Million) By Applications (2018-2022)
Table 13 Global Alcoholic RTDs Revenue Market Share (%) By Applications (2018-2022)
Table 14 Global Alcoholic RTDs Market Revenue (USD Million) By Regions (2018-2022)
Table 15 Global Alcoholic RTDs Market Share (%) By Regions (2018-2022)
Table 16 North America Alcoholic RTDs Revenue (USD Million) By Country (2018-2022)
Table 17 North America Alcoholic RTDs Revenue (USD Million) By Type (2018-2022)
Table 18 North America Alcoholic RTDs Revenue (USD Million) By Applications (2018-2022)
Table 19 Europe Alcoholic RTDs Revenue (USD Million) By Country (2018-2022)
Table 20 Europe Alcoholic RTDs Revenue (USD Million) By Type (2018-2022)
Table 21 Europe Alcoholic RTDs Revenue (USD Million) By Applications (2018-2022)
Table 22 Asia Pacific Alcoholic RTDs Revenue (USD Million) By Country (2018-2022)
Table 23 Asia Pacific Alcoholic RTDs Revenue (USD Million) By Type (2018-2022)
Table 24 Asia Pacific Alcoholic RTDs Revenue (USD Million) By Applications (2018-2022)
Table 25 South America Alcoholic RTDs Revenue (USD Million) By Country (2018-2022)
Table 26 South America Alcoholic RTDs Revenue (USD Million) By Type (2018-2022)
Table 27 South America Alcoholic RTDs Revenue (USD Million) By Applications (2018-2022)
Table 28 Middle East and Africa Alcoholic RTDs Revenue (USD Million) By Region (2018-2022)
Table 29 Middle East and Africa Alcoholic RTDs Revenue (USD Million) By Type (2018-2022)
Table 30 Middle East and Africa Alcoholic RTDs Revenue (USD Million) By Applications (2018-2022)
Table 31 Financial Analysis
Table 32 Global Alcoholic RTDs Revenue (USD Million) By Type (2023-2030)
Table 33 Global Alcoholic RTDs Revenue Market Share (%) By Type (2023-2030)
Table 34 Global Alcoholic RTDs Revenue (USD Million) By Applications (2023-2030)
Table 35 Global Alcoholic RTDs Revenue Market Share (%) By Applications (2023-2030)
Table 36 Global Alcoholic RTDs Market Revenue (USD Million), And Revenue (USD Million) By Regions (2023-2030)
Table 37 North America Alcoholic RTDs Revenue (USD)By Country (2023-2030)
Table 38 North America Alcoholic RTDs Revenue (USD Million) By Type (2023-2030)
Table 39 North America Alcoholic RTDs Revenue (USD Million) By Applications (2023-2030)
Table 40 Europe Alcoholic RTDs Revenue (USD Million) By Country (2023-2030)
Table 41 Europe Alcoholic RTDs Revenue (USD Million) By Type (2023-2030)
Table 42 Europe Alcoholic RTDs Revenue (USD Million) By Applications (2023-2030)
Table 43 Asia Pacific Alcoholic RTDs Revenue (USD Million) By Country (2023-2030)
Table 44 Asia Pacific Alcoholic RTDs Revenue (USD Million) By Type (2023-2030)
Table 45 Asia Pacific Alcoholic RTDs Revenue (USD Million) By Applications (2023-2030)
Table 46 South America Alcoholic RTDs Revenue (USD Million) By Country (2023-2030)
Table 47 South America Alcoholic RTDs Revenue (USD Million) By Type (2023-2030)
Table 48 South America Alcoholic RTDs Revenue (USD Million) By Applications (2023-2030)
Table 49 Middle East and Africa Alcoholic RTDs Revenue (USD Million) By Region (2023-2030)
Table 50 Middle East and Africa Alcoholic RTDs Revenue (USD Million) By Region (2023-2030)
Table 51 Middle East and Africa Alcoholic RTDs Revenue (USD Million) By Type (2023-2030)
Table 52 Middle East and Africa Alcoholic RTDs Revenue (USD Million) By Applications (2023-2030)
Table 53 Research Programs/Design for This Report
Table 54 Key Data Information from Secondary Sources
Table 55 Key Data Information from Primary Sources
List of Figures
Figure 1 Market Scope
Figure 2 Porter’s Five Forces
Figure 3 Global Alcoholic RTDs Revenue (USD Million) By Type (2018-2022)
Figure 4 Global Alcoholic RTDs Revenue Market Share (%) By Type (2022)
Figure 5 Global Alcoholic RTDs Revenue (USD Million) By Applications (2018-2022)
Figure 6 Global Alcoholic RTDs Revenue Market Share (%) By Applications (2022)
Figure 7 Global Alcoholic RTDs Market Revenue (USD Million) By Regions (2018-2022)
Figure 8 Global Alcoholic RTDs Market Share (%) By Regions (2022)
Figure 9 North America Alcoholic RTDs Revenue (USD Million) By Country (2018-2022)
Figure 10 North America Alcoholic RTDs Revenue (USD Million) By Type (2018-2022)
Figure 11 North America Alcoholic RTDs Revenue (USD Million) By Applications (2018-2022)
Figure 12 Europe Alcoholic RTDs Revenue (USD Million) By Country (2018-2022)
Figure 13 Europe Alcoholic RTDs Revenue (USD Million) By Type (2018-2022)
Figure 14 Europe Alcoholic RTDs Revenue (USD Million) By Applications (2018-2022)
Figure 15 Asia Pacific Alcoholic RTDs Revenue (USD Million) By Country (2018-2022)
Figure 16 Asia Pacific Alcoholic RTDs Revenue (USD Million) By Type (2018-2022)
Figure 17 Asia Pacific Alcoholic RTDs Revenue (USD Million) By Applications (2018-2022)
Figure 18 South America Alcoholic RTDs Revenue (USD Million) By Country (2018-2022)
Figure 19 South America Alcoholic RTDs Revenue (USD Million) By Type (2018-2022)
Figure 20 South America Alcoholic RTDs Revenue (USD Million) By Applications (2018-2022)
Figure 21 Middle East and Africa Alcoholic RTDs Revenue (USD Million) By Region (2018-2022)
Figure 22 Middle East and Africa Alcoholic RTDs Revenue (USD Million) By Type (2018-2022)
Figure 23 Middle East and Africa Alcoholic RTDs Revenue (USD Million) By Applications (2018-2022)
Figure 24 Global Alcoholic RTDs Revenue (USD Million) By Type (2023-2030)
Figure 25 Global Alcoholic RTDs Revenue Market Share (%) By Type (2030)
Figure 26 Global Alcoholic RTDs Revenue (USD Million) By Applications (2023-2030)
Figure 27 Global Alcoholic RTDs Revenue Market Share (%) By Applications (2030)
Figure 28 Global Alcoholic RTDs Market Revenue (USD Million) By Regions (2023-2030)
Figure 29 North America Alcoholic RTDs Revenue (USD Million) By Country (2023-2030)
Figure 30 North America Alcoholic RTDs Revenue (USD Million) By Type (2023-2030)
Figure 31 North America Alcoholic RTDs Revenue (USD Million) By Applications (2023-2030)
Figure 32 Europe Alcoholic RTDs Revenue (USD Million) By Country (2023-2030)
Figure 33 Europe Alcoholic RTDs Revenue (USD Million) By Type (2023-2030)
Figure 34 Europe Alcoholic RTDs Revenue (USD Million) By Applications (2023-2030)
Figure 35 Asia Pacific Alcoholic RTDs Revenue (USD Million) By Country (2023-2030)
Figure 36 Asia Pacific Alcoholic RTDs Revenue (USD Million) By Type (2023-2030)
Figure 37 Asia Pacific Alcoholic RTDs Revenue (USD Million) By Applications (2023-2030)
Figure 38 South America Alcoholic RTDs Revenue (USD Million) By Country (2023-2030)
Figure 39 South America Alcoholic RTDs Revenue (USD Million) By Type (2023-2030)
Figure 40 South America Alcoholic RTDs Revenue (USD Million) By Applications (2023-2030)
Figure 41 Middle East and Africa Alcoholic RTDs Revenue (USD Million) By Region (2023-2030)
Figure 42 Middle East and Africa Alcoholic RTDs Revenue (USD Million) By Region (2023-2030)
Figure 43 Middle East and Africa Alcoholic RTDs Revenue (USD Million) By Type (2023-2030)
Figure 44 Middle East and Africa Alcoholic RTDs Revenue (USD Million) By Applications (2023-2030)
Figure 45 Bottom-Up and Top-Down Approaches for This Report
Figure 46 Data Triangulation
