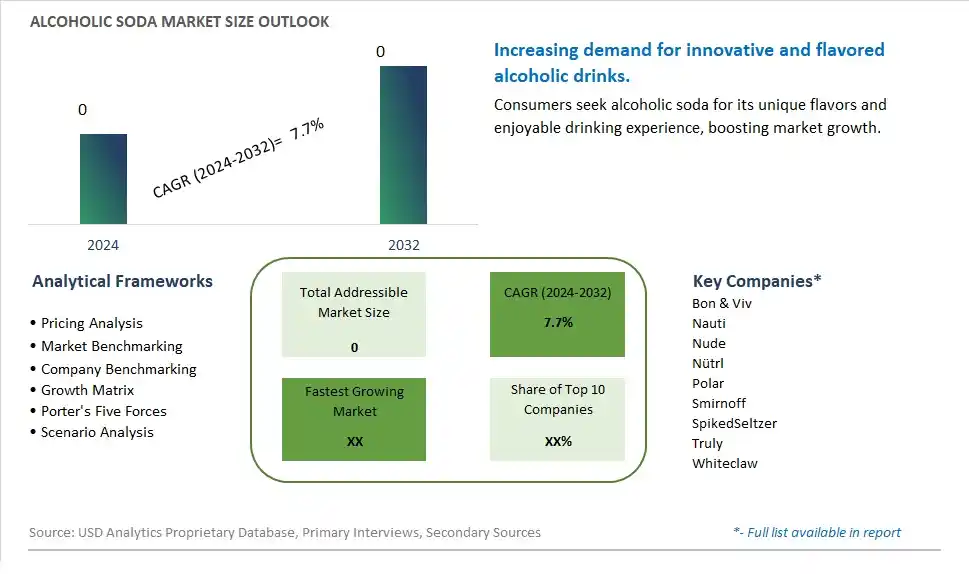
Global Alcoholic Soda Market Size is valued at $XX Million in 2024 and is forecast to register a growth rate (CAGR) of 7.7% to reach $XX Million by 2032.
The global Alcoholic Soda Market Comprehensive Study analyzes and forecasts the market size across 6 regions and 24 countries for diverse segments -By Type (Below 4% ABV, 4 to 5% ABV, Above 5% ABV), By Application (Supermarkets/Hypermarkets, Convenience Stores, Online, Others)
An Introduction to Alcoholic Soda Market
The Alcoholic Soda market in 2024 is experiencing robust growth, driven by the demand for innovative and nostalgic beverage options. Alcoholic sodas combine the classic appeal of soda with a mild alcohol content, catering to consumers looking for a fun and flavorful drink. The market is benefiting from the trend towards ready-to-drink alcoholic beverages and the growing interest in low-ABV (alcohol by volume) products. Advances in flavor development and carbonation techniques are enhancing product quality and variety. The market is also seeing increased interest from younger consumers seeking novel and convenient alcoholic beverages for social occasions.
Alcoholic Soda Competitive Landscape
The market report analyses the leading companies in the industry including Bon & Viv, Nauti, Nude, Nütrl, Polar, Smirnoff, SpikedSeltzer, Truly, Whiteclaw, and Others.
Alcoholic Soda Market Dynamics
Alcoholic Soda Market Trend: Revival of Retro and Nostalgic Flavors
The market for alcoholic soda is witnessing a significant trend towards the revival of retro and nostalgic flavors. Consumers are increasingly drawn to beverages that evoke a sense of nostalgia, reminiscent of classic sodas they enjoyed in their youth, but with an adult twist. This trend is driven by the desire for unique and enjoyable drinking experiences that combine the familiarity of traditional soda flavors with the excitement of alcohol. Brands are capitalizing on this trend by reintroducing popular soda flavors, such as cola, root beer, and cream soda, infused with alcohol, creating a refreshing and indulgent beverage option that appeals to both younger and older demographics.
Alcoholic Soda Market Driver: Growing Demand for Ready-to-Drink (RTD) Alcoholic Beverages
The primary driver for the alcoholic soda market is the growing demand for ready-to-drink (RTD) alcoholic beverages. Consumers are increasingly seeking convenience without compromising on quality and taste, making RTD alcoholic sodas a popular choice. This demand is fueled by the busy lifestyles of modern consumers who prefer easily accessible, pre-mixed drinks that can be enjoyed on the go or at social gatherings. The rise of casual and spontaneous drinking occasions, along with the preference for low-effort, high-quality beverage options, is driving the growth of the alcoholic soda market. Additionally, the trend towards innovative and diverse flavor profiles in the RTD category further supports the market's expansion.
Alcoholic Soda Market Opportunity: Development of Low-Calorie and Health-Conscious Options
A significant opportunity for the alcoholic soda market lies in the development of low-calorie and health-conscious options. As consumers become more health-aware, there is a growing demand for beverages that align with their dietary preferences and fitness goals. Introducing low-calorie, sugar-free, and organic versions of alcoholic sodas can attract health-conscious consumers who seek to enjoy alcoholic beverages without the guilt associated with high-calorie drinks. Furthermore, leveraging natural ingredients and promoting clean labels can enhance the appeal of alcoholic sodas to this demographic. By innovating and expanding product lines to include healthier alternatives, brands can capture a broader market segment and drive growth in the alcoholic soda market.
Alcoholic Soda Market Share Analysis: 4 to 5% ABV segment generated the highest revenue share in the industry
The 4 to 5% ABV segment is the largest in the Alcoholic Soda Market by type. This segment's prominence is driven by the balance it offers between moderate alcohol content and enjoyable drinking experience, making it a popular choice among consumers. Alcoholic sodas within this ABV range are often seen as light and refreshing alternatives to traditional beers and spirits, catering to a wide demographic that includes both occasional and regular drinkers. The 4 to 5% ABV range provides enough alcohol to deliver a satisfying experience without being too strong, making it suitable for social gatherings, casual consumption, and recreational activities. Additionally, this segment benefits from extensive marketing and branding efforts by beverage companies, which promote these products as trendy and appealing options for a variety of occasions. The wide acceptance and versatile appeal of 4 to 5% ABV alcoholic sodas ensure their leading position in the market.
Alcoholic Soda Market Share Analysis: Online is the fastest growing segment over the forecast period to 2032
The Online segment within the Alcoholic Soda Market is projected to be the fastest growing segment by 2032. This growth is fueled by the increasing consumer preference for the convenience and ease of online shopping. The rise of ecommerce platforms has revolutionized the way consumers purchase alcoholic beverages, offering them a wide variety of options at their fingertips. Online retailers provide detailed product information, customer reviews, and competitive pricing, enhancing the overall shopping experience. The Recent past has further accelerated the shift towards online shopping, as consumers seek safer and more convenient ways to buy their favorite beverages. Further, the availability of subscription services and directtoconsumer sales models is boosting the popularity of online channels. As more consumers turn to digital platforms for their beverage needs, the online segment is expected to see significant expansion, making it the fastest growing application area for alcoholic sodas through 2032.
Alcoholic Soda Market Segmentation
By Type
Below 4% ABV
4 to 5% ABV
Above 5% ABV
By Application
Supermarkets/Hypermarkets
Convenience Stores
Online
Others
Countries Analyzed
North America (US, Canada, Mexico)
Europe (Germany, UK, France, Spain, Italy, Russia, Rest of Europe)
Asia Pacific (China, India, Japan, South Korea, Australia, South East Asia, Rest of Asia)
South America (Brazil, Argentina, Rest of South America)
Middle East and Africa (Saudi Arabia, UAE, Rest of Middle East, South Africa, Egypt, Rest of Africa)
Alcoholic Soda Companies Profiled in the Study
Bon & Viv
Nauti
Nude
Nütrl
Polar
Smirnoff
SpikedSeltzer
Truly
Whiteclaw
*- List Not Exhaustive
Chapter 1. TABLE OF CONTENTS
Chapter 2. Introduction to Alcoholic Soda Market
2.1. Market Overview
2.2. Key Statistics and Report Highlights
2.3. Scope of the Comprehensive Study
2.3.1. Market Definition
2.3.2 Countries and Regions Covered
2.3.3 Research Objective
2.3.4 Units, Currency, and Conversions
2.3.5 Industry Value Chain
2.4. Key Market Segments
2.5. Key Companies
2.6. Study Period
Chapter 3. Strategic Analysis Review
3.1. Alcoholic Soda Pricing Analysis and Forecast
3.2. Porter’s Five Forces
3.3. Market Ecosystem
3.4. SWOT Analysis
3.5. Regulatory Scenario
3.3. Effects of Inflation, Russia-Ukraine War, moderating economic growth, and other macroeconomic factors
Chapter 4. Competitive Landscape
4.1. Market Share Analysis
4.1.1. Global Alcoholic Soda Market Share by Company, 2023
4.1.2. Product Offerings of Leading Alcoholic Soda Companies
4.2. Market Entropy
4.2.1. New Product Launches in the Industry
4.2.2. Mergers, Acquisitions, Joint ventures, and Partnerships
4.3. Key Strategies and Best Practices
Chapter 5. Global Market Projections: Best, Reference, and Low Case Scenarios
5.1. Growth Analysis- Case Scenario Definitions
5.2. Low Growth Case Scenario Forecasts
5.3. Reference Growth Case Scenario Forecasts
5.4. High Growth Case Scenario Forecasts
Chapter 6. Market Dynamics
6.1. Alcoholic Soda Market Drivers
6.2. Alcoholic Soda Market Challenges
6.6. Alcoholic Soda Market Opportunities
6.4. Alcoholic Soda Market Trends
Chapter 7. Global Alcoholic Soda Market Outlook Trends
7.1. Global Alcoholic Soda Revenue (USD Million) and CAGR (%) by Type (2021-2032)
7.2. Global Alcoholic Soda Revenue (USD Million) and CAGR (%) by Application (2021-2032)
7.3. Global Alcoholic Soda Revenue (USD Million) and CAGR (%) by Product (2021-2032)
By Type
Below 4% ABV
4 to 5% ABV
Above 5% ABV
By Application
Supermarkets/Hypermarkets
Convenience Stores
Online
Others
Chapter 8. Global Alcoholic Soda Regional Analysis and Outlook
8.1. Global Alcoholic Soda Revenue (USD Million) By Regions (2021- 2032)
8.2. North America Alcoholic Soda Revenue (USD Million) by Country (2021-2032)
8.2.1. United States Alcoholic Soda Regional Analysis and Outlook
8.2.2. Canada Alcoholic Soda Regional Analysis and Outlook
8.2.3. Mexico Alcoholic Soda Regional Analysis and Outlook
8.3. Europe Alcoholic Soda Revenue (USD Million), by Country (2021-2032)
8.3.1. Germany Alcoholic Soda Regional Analysis and Outlook
8.3.2. France Alcoholic Soda Regional Analysis and Outlook
8.3.3. United Kingdom Alcoholic Soda Regional Analysis and Outlook
8.3.4. Spain Alcoholic Soda Regional Analysis and Outlook
8.3.5. Italy Alcoholic Soda Regional Analysis and Outlook
8.3.6. Russia Alcoholic Soda Regional Analysis and Outlook
8.3.7. Rest of Europe Alcoholic Soda Regional Analysis and Outlook
8.4. Asia Pacific Alcoholic Soda Revenue (USD Million) by Country (2021-2032)
8.4.1. China Alcoholic Soda Regional Analysis and Outlook
8.4.2. Japan Alcoholic Soda Regional Analysis and Outlook
8.4.3. India Alcoholic Soda Regional Analysis and Outlook
8.4.4. South Korea Alcoholic Soda Regional Analysis and Outlook
8.4.5. Australia Alcoholic Soda Regional Analysis and Outlook
8.4.6. South East Asia Alcoholic Soda Regional Analysis and Outlook
8.4.7. Rest of Asia Pacific Alcoholic Soda Regional Analysis and Outlook
8.5. South America Alcoholic Soda Revenue (USD Million), by Country (2021-2032)
8.5.1. Brazil Alcoholic Soda Regional Analysis and Outlook
8.5.2. Argentina Alcoholic Soda Regional Analysis and Outlook
8.5.3. Rest of South America Alcoholic Soda Regional Analysis and Outlook
8.6. Middle East and Africa Alcoholic Soda Revenue (USD Million) by Country (2021-2032)
8.6.1. Middle East Alcoholic Soda Regional Analysis and Outlook
8.6.2. Africa Alcoholic Soda Regional Analysis and Outlook
Chapter 9. North America Alcoholic Soda Analysis and Outlook
9.1. North America Alcoholic Soda Revenue (USD Million) by Segments (2021-2032)
9.1.1. North America Alcoholic Soda Revenue (USD Million) by Type (2021-2032)
9.1.2. North America Alcoholic Soda Revenue (USD Million) by Application (2021-2032)
9.1.3. North America Alcoholic Soda Revenue (USD Million) by Product (2021-2032)
By Type
Below 4% ABV
4 to 5% ABV
Above 5% ABV
By Application
Supermarkets/Hypermarkets
Convenience Stores
Online
Others
Chapter 10. Europe Alcoholic Soda Analysis and Outlook
10.1. Europe Alcoholic Soda Revenue (USD Million), by Segments (USD Million) (2021-2032)
10.1.1. Europe Alcoholic Soda Revenue (USD Million) by Type (2021-2032)
10.1.2. Europe Alcoholic Soda Revenue (USD Million) by Application (2021-2032)
10.1.3. Europe Alcoholic Soda Revenue (USD Million) by Product (2021-2032)
By Type
Below 4% ABV
4 to 5% ABV
Above 5% ABV
By Application
Supermarkets/Hypermarkets
Convenience Stores
Online
Others
Chapter 11. Asia Pacific Alcoholic Soda Analysis and Outlook
11.1. Asia Pacific Alcoholic Soda Revenue (USD Million), and Revenue (USD Million) by Segments (2021-2032)
11.1.1. Asia Pacific Alcoholic Soda Revenue (USD Million) by Type (2021-2032)
11.1.2. Asia Pacific Alcoholic Soda Revenue (USD Million) by Application (2021-2032)
11.1.3. Asia Pacific Alcoholic Soda Revenue (USD Million) by Product (2021-2032)
By Type
Below 4% ABV
4 to 5% ABV
Above 5% ABV
By Application
Supermarkets/Hypermarkets
Convenience Stores
Online
Others
Chapter 12. South America Alcoholic Soda Analysis and Outlook
12.1. South America Alcoholic Soda Revenue (USD Million), by Segments (2021-2032)
12.1.1. South America Alcoholic Soda Revenue (USD Million) by Type (2021-2032)
12.1.2. South America Alcoholic Soda Revenue (USD Million) by Application (2021-2032)
12.1.3. South America Alcoholic Soda Revenue (USD Million) by Product (2021-2032)
By Type
Below 4% ABV
4 to 5% ABV
Above 5% ABV
By Application
Supermarkets/Hypermarkets
Convenience Stores
Online
Others
Chapter 13. Middle East and Africa Alcoholic Soda Analysis and Outlook
13.1. Middle East and Africa Alcoholic Soda Revenue (USD Million), by Segments (2021-2032)
13.1.1. Middle East and Africa Alcoholic Soda Revenue (USD Million) by Type (2021-2032)
13.1.2. Middle East and Africa Alcoholic Soda Revenue (USD Million) by Application (2021-2032)
13.1.3. Middle East and Africa Alcoholic Soda Revenue (USD Million) by Product (2021-2032)
By Type
Below 4% ABV
4 to 5% ABV
Above 5% ABV
By Application
Supermarkets/Hypermarkets
Convenience Stores
Online
Others
Chapter 14. Alcoholic Soda Company Profiles
14.1 Business Overview
14.2 Product Profiles
14.3 SWOT Profiles
14.5 Recent Developments
14.6 Financial Profile
List of Companies
Bon & Viv
Nauti
Nude
Nütrl
Polar
Smirnoff
SpikedSeltzer
Truly
Whiteclaw
15. Methodology and Data Sources
15.1 Customization Offerings
15.2 Subscription Services
15.3 Related Reports
15.4 Publisher Expertise
LIST OF TABLES
Table 1 Market Segmentation Analysis
Table 2 Global Alcoholic Soda Market Share of Leading Companies, 2023
Table 3 Product Offerings of Leading Companies
Table 4 Low Growth Scenario Forecasts
Table 5 Reference Case Growth Scenario
Table 6 High Growth Case Scenario
Table 7 Global Alcoholic Soda Revenue (USD Million) And CAGR (%) By Type (2021-2032)
Table 8 Global Alcoholic Soda Revenue (USD Million) And CAGR (%) By Application (2021-2032)
Table 9 Global Alcoholic Soda Revenue (USD Million) And CAGR (%) By Product (2021-2032)
Table 10 Global Alcoholic Soda Market Revenue (USD Million) By Regions (2021-2032)
Table 11 Global Alcoholic Soda Market Share (%) By Regions (2021-2032)
Table 12 North America Alcoholic Soda Revenue (USD Million) By Country (2021-2032)
Table 13 Europe Alcoholic Soda Revenue (USD Million) By Country (2021-2032)
Table 14 Asia Pacific Alcoholic Soda Revenue (USD Million) By Country (2021-2032)
Table 15 South America Alcoholic Soda Revenue (USD Million) By Country (2021-2032)
Table 16 Middle East and Africa Alcoholic Soda Revenue (USD Million) By Region (2021-2032)
Table 17 North America Alcoholic Soda Revenue (USD Million) By Type (2021-2032)
Table 18 North America Alcoholic Soda Revenue (USD Million) By Application (2021-2032)
Table 19 North America Alcoholic Soda Revenue (USD Million) By Product (2021-2032)
Table 20 Europe Alcoholic Soda Revenue (USD Million) By Type (2021-2032)
Table 21 Europe Alcoholic Soda Revenue (USD Million) By Application (2021-2032)
Table 22 Europe Alcoholic Soda Revenue (USD Million) By Product (2021-2032)
Table 23 Asia Pacific Alcoholic Soda Revenue (USD Million) By Type (2021-2032)
Table 24 Asia Pacific Alcoholic Soda Revenue (USD Million) By Application (2021-2032)
Table 25 Asia Pacific Alcoholic Soda Revenue (USD Million) By Product (2021-2032)
Table 26 South America Alcoholic Soda Revenue (USD Million) By Type (2021-2032)
Table 27 South America Alcoholic Soda Revenue (USD Million) By Application (2021-2032)
Table 28 South America Alcoholic Soda Revenue (USD Million) By Product (2021-2032)
Table 29 Middle East and Africa Alcoholic Soda Revenue (USD Million) By Type (2021-2032)
Table 30 Middle East and Africa Alcoholic Soda Revenue (USD Million) By Application (2021-2032)
Table 31 Middle East and Africa Alcoholic Soda Revenue (USD Million) By Product (2021-2032)
LIST OF FIGURES
Figure 1. Market Scope
Figure 2. Pricing Forecasts Per Unit, 2023- 2032
Figure 3. Porter’s Five Forces
Figure 4. Global Alcoholic Soda Market Revenue (USD Million) By Regions (2021-2032)
Figure 5. Global Alcoholic Soda Market Share (%) By Regions (2023)
Figure 6. North America Alcoholic Soda Revenue (USD Million) By Country (2021-2032)
Figure 7. United States Alcoholic Soda Revenue (USD Million) By Country (2021-2032)
Figure 8. Canada Alcoholic Soda Revenue (USD Million) By Country (2021-2032)
Figure 9. Mexico Alcoholic Soda Revenue (USD Million) By Country (2021-2032)
Figure 10. Europe Alcoholic Soda Revenue (USD Million) By Country (2021-2032)
Figure 11. Germany Alcoholic Soda Revenue (USD Million) By Country (2021-2032)
Figure 12. France Alcoholic Soda Revenue (USD Million) By Country (2021-2032)
Figure 13. United Kingdom Alcoholic Soda Revenue (USD Million) By Country (2021-2032)
Figure 14. Spain Alcoholic Soda Revenue (USD Million) By Country (2021-2032)
Figure 15. Italy Alcoholic Soda Revenue (USD Million) By Country (2021-2032)
Figure 16. Russia Alcoholic Soda Revenue (USD Million) By Country (2021-2032)
Figure 17. Rest of Europe Alcoholic Soda Revenue (USD Million) By Country (2021-2032)
Figure 11. Asia Pacific Alcoholic Soda Revenue (USD Million) By Country (2021-2032)
Figure 12. China Alcoholic Soda Revenue (USD Million) By Country (2021-2032)
Figure 13. Japan Alcoholic Soda Revenue (USD Million) By Country (2021-2032)
Figure 14. India Alcoholic Soda Revenue (USD Million) By Country (2021-2032)
Figure 15. South Korea Alcoholic Soda Revenue (USD Million) By Country (2021-2032)
Figure 16. Australia Alcoholic Soda Revenue (USD Million) By Country (2021-2032)
Figure 17. South East Asia Alcoholic Soda Revenue (USD Million) By Country (2021-2032)
Figure 18. South America Alcoholic Soda Revenue (USD Million) By Country (2021-2032)
Figure 19. Brazil Alcoholic Soda Revenue (USD Million) By Country (2021-2032)
Figure 20. Argentina Alcoholic Soda Revenue (USD Million) By Country (2021-2032)
Figure 21. Rest of Asia Pacific Alcoholic Soda Revenue (USD Million) By Country (2021-2032)
Figure 22. Middle East and Africa Alcoholic Soda Revenue (USD Million) By Region (2021-2032)
Figure 23. Saudi Arabia Alcoholic Soda Revenue (USD Million) By Region (2021-2032)
Figure 24. The UAE Alcoholic Soda Revenue (USD Million) By Region (2021-2032)
Figure 25. Rest of Middle East Alcoholic Soda Revenue (USD Million) By Region (2021-2032)
Figure 26. South Africa Alcoholic Soda Revenue (USD Million) By Region (2021-2032)
Figure 27. Africa Alcoholic Soda Revenue (USD Million) By Region (2021-2032)
Figure 28. North America Alcoholic Soda Revenue (USD Million) By Type (2021-2032)
Figure 29. North America Alcoholic Soda Revenue (USD Million) By Application (2021-2032)
Figure 30. North America Alcoholic Soda Revenue (USD Million) By Product (2021-2032)
Figure 31. Europe Alcoholic Soda Revenue (USD Million) By Type (2021-2032)
Figure 32. Europe Alcoholic Soda Revenue (USD Million) By Application (2021-2032)
Figure 33. Europe Alcoholic Soda Revenue (USD Million) By Product (2021-2032)
Figure 34. Asia Pacific Alcoholic Soda Revenue (USD Million) By Type (2021-2032)
Figure 35. Asia Pacific Alcoholic Soda Revenue (USD Million) By Application (2021-2032)
Figure 36. Asia Pacific Alcoholic Soda Revenue (USD Million) By Product (2021-2032)
Figure 37. South America Alcoholic Soda Revenue (USD Million) By Type (2021-2032)
Figure 38. South America Alcoholic Soda Revenue (USD Million) By Application (2021-2032)
Figure 39. South America Alcoholic Soda Revenue (USD Million) By Product (2021-2032)
Figure 40. Middle East and Africa Alcoholic Soda Revenue (USD Million) By Type (2021-2032)
Figure 41. Middle East and Africa Alcoholic Soda Revenue (USD Million) By Application (2021-2032)
Figure 42. Middle East and Africa Alcoholic Soda Revenue (USD Million) By Product (2021-2032)
By Type
Below 4% ABV
4 to 5% ABV
Above 5% ABV
By Application
Supermarkets/Hypermarkets
Convenience Stores
Online
Others
Countries Analyzed
North America (US, Canada, Mexico)
Europe (Germany, UK, France, Spain, Italy, Russia, Rest of Europe)
Asia Pacific (China, India, Japan, South Korea, Australia, South East Asia, Rest of Asia)
South America (Brazil, Argentina, Rest of South America)
Middle East and Africa (Saudi Arabia, UAE, Rest of Middle East, South Africa, Egypt, Rest of Africa)
