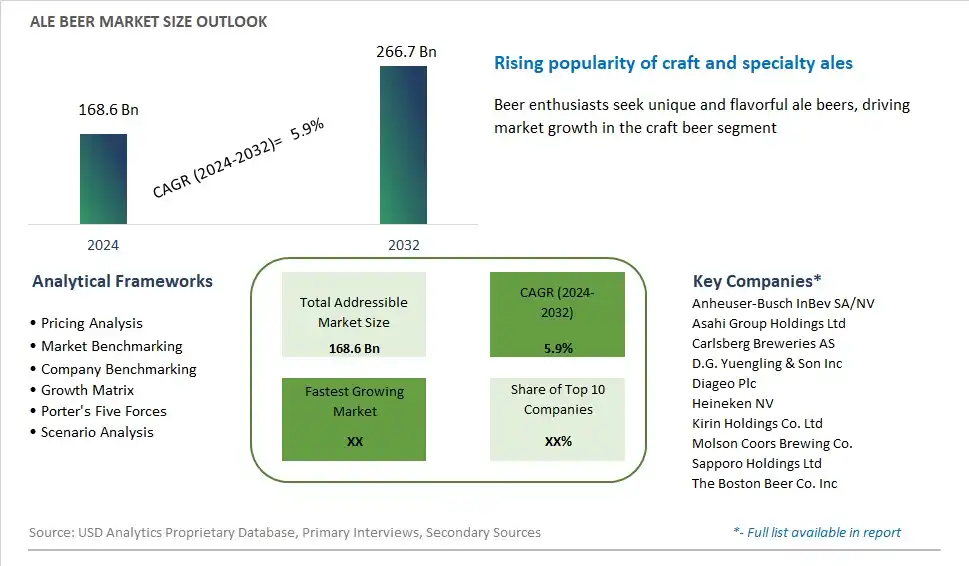
Global Ale Beer Market Size is valued at $168.6 Billion in 2024 and is forecast to register a growth rate (CAGR) of 5.9% to reach $266.7 Billion by 2032.
The global Ale Beer Market Comprehensive Study analyzes and forecasts the market size across 6 regions and 24 countries for diverse segments -By Type (Pasteurimd Beer, Draft Beer), By Distribution Channel (Offline, Online), By End-User (Hospitals, Clinical Diagnostic Laboratories, Others)
An Introduction to Ale Beer Market
In 2024, the ale beer market reflects a rich tapestry of tradition and innovation, offering a diverse range of styles and flavors to suit every palate. Ale, one of the oldest and most beloved beer varieties, continues to enjoy widespread popularity among consumers worldwide. From classic English bitters to bold American IPAs and experimental craft brews, ale beer embodies a spectrum of brewing traditions and cultural influences. Moreover, the resurgence of interest in artisanal and small-batch brewing has led to a renaissance of traditional ale styles and revived interest in historical recipes. Additionally, technological advancements in brewing equipment and quality control processes have enabled brewers to push the boundaries of creativity while maintaining consistency and quality. As consumer demand for authenticity and flavor diversity persists, the ale beer market remains a dynamic and vibrant segment of the global beer industry in 2024.
Ale Beer Competitive Landscape
The market report analyses the leading companies in the industry including Anheuser-Busch InBev SA/NV, Asahi Group Holdings Ltd, Carlsberg Breweries AS, D.G. Yuengling & Son Inc, Diageo Plc, Heineken NV, Kirin Holdings Co. Ltd, Molson Coors Brewing Co., Sapporo Holdings Ltd, The Boston Beer Co. Inc, and Others.
Ale Beer Market Dynamics
Ale Beer Market Trend: Resurgence of Traditional Brewing Techniques and Styles
A significant trend in the ale beer market is the resurgence of traditional brewing techniques and styles. As consumers seek authenticity and heritage in their beer choices, there is a growing interest in ales brewed using traditional methods and recipes. This trend is driven by a desire for more nuanced and complex flavors, as well as a renewed appreciation for the craftsmanship and history behind ale brewing. Breweries are responding by reviving old-world brewing practices, experimenting with historic ale styles, and incorporating locally sourced ingredients to create distinctive and flavorful ales that appeal to modern beer enthusiasts.
Market Driver: Craft Beer Culture and Consumer Preference for Flavor Diversity
A key driver shaping the ale beer market is the craft beer culture and consumer preference for flavor diversity. With the rise of craft breweries and the proliferation of beer styles, consumers are increasingly seeking out ales that offer unique and innovative flavor profiles. This driver is fueled by a desire for exploration, experimentation, and discovery, as craft beer enthusiasts seek new and exciting taste experiences. Breweries are capitalizing on this demand by brewing a wide range of ale styles, from traditional British bitters and porters to bold American IPAs and barrel-aged ales, catering to diverse palates and preferences in the market.
Market Opportunity: Positioning as Premium and Artisanal Beverage Option
An opportunity for growth in the ale beer market lies in positioning ales as a premium and artisanal beverage option. With increasing consumer interest in high-quality and locally sourced products, breweries can differentiate their ales by emphasizing their craftsmanship, authenticity, and premium ingredients. By highlighting the unique brewing process, quality of ingredients, and attention to detail, breweries can appeal to discerning consumers looking for a more elevated drinking experience. Additionally, there is potential for collaborations with local artisans, food producers, and cultural institutions to create unique ale offerings that showcase regional flavors, traditions, and craftsmanship, further enhancing the appeal and marketability of ale beers.
Ale Beer Market Share Analysis: Pasteurized Beer in the Ale Beer Market held the dominant market share in 2024
The Pasteurized Beer segment is the largest within the Ale Beer Market due to its widespread availability, longer shelf life, and consistent quality. Pasteurization, a process involving heating beer to eliminate harmful microorganisms, extends the beer's freshness and stability, making it suitable for distribution over longer distances and storage in various retail outlets. This preservation method ensures that Pasteurized Beer maintains its flavor profile and quality, attracting consumers seeking reliable and consistent brews. Additionally, Pasteurized Beer is favored by breweries for its versatility in packaging, allowing for bottling, canning, and kegging to meet diverse consumer preferences. As a result, Pasteurized Beer holds a dominant position in the Ale Beer Market, catering to the preferences of discerning beer enthusiasts worldwide.
Ale Beer Market Share Analysis: Online Distribution Channel in the Ale Beer market is poised to register the fastest growth rae over the forecast period to 2032
The Online Distribution Channel is the fastest-growing segment in the Ale Beer Market, driven by shifting consumer preferences, technological advancements, and the convenience of e-commerce platforms. With the increasing penetration of the internet and smartphones, consumers are increasingly turning to online channels to purchase their favorite craft and artisanal beers. Online retailers offer a vast selection of ale beers from various breweries, including niche and specialty options that may not be readily available in brick-and-mortar stores. Further, the COVID-19 pandemic has accelerated the adoption of online shopping as consumers prioritize safety and convenience. Additionally, the ability to browse, compare prices, and read reviews from the comfort of home appeals to consumers seeking personalized and hassle-free shopping experiences. As the digital landscape continues to evolve, the Online Distribution Channel is expected to maintain its momentum, reshaping the Ale Beer Market and offering new avenues for breweries to reach their target audience.
Ale Beer Market Share Analysis: Others in the Ale Beer Market held the dominant market share in 2024
Within the Ale Beer Market, the "Others" category is the largest segment, encompassing a diverse range of end-users such as bars, restaurants, breweries, and individual consumers. This broad classification captures the significant portion of ale beer consumption outside of specialized industries like hospitals and clinical diagnostic laboratories. The appeal of ale beer extends beyond medical and laboratory settings, making it a staple in social gatherings, dining experiences, and leisure activities. Bars and restaurants serve as key venues for enjoying ale beer, offering patrons a wide selection of brews to complement meals or socialize with friends. Additionally, the rise of craft breweries and microbreweries has contributed to the popularity of ale beer among beer enthusiasts seeking unique and artisanal brews. Further, individual consumers purchase ale beer for home consumption, whether for personal enjoyment or for hosting gatherings and events. As a result of its widespread consumption across various contexts, the "Others" segment maintains its status as the largest in the Ale Beer Market.
Ale Beer Market Segmentation
By Type
Pasteurimd Beer
Draft Beer
By Distribution Channel
Offline
Online
By End-User
Hospitals
Clinical Diagnostic Laboratories
Others
Countries Analyzed
North America (US, Canada, Mexico)
Europe (Germany, UK, France, Spain, Italy, Russia, Rest of Europe)
Asia Pacific (China, India, Japan, South Korea, Australia, South East Asia, Rest of Asia)
South America (Brazil, Argentina, Rest of South America)
Middle East and Africa (Saudi Arabia, UAE, Rest of Middle East, South Africa, Egypt, Rest of Africa)
Ale Beer Companies Profiled in the Study
Anheuser-Busch InBev SA/NV
Asahi Group Holdings Ltd
Carlsberg Breweries AS
D.G. Yuengling & Son Inc
Diageo Plc
Heineken NV
Kirin Holdings Co. Ltd
Molson Coors Brewing Co.
Sapporo Holdings Ltd
The Boston Beer Co. Inc
*- List Not Exhaustive
Chapter 1. TABLE OF CONTENTS
Chapter 2. Introduction to Ale Beer Market
2.1. Market Overview
2.2. Key Statistics and Report Highlights
2.3. Scope of the Comprehensive Study
2.3.1. Market Definition
2.3.2 Countries and Regions Covered
2.3.3 Research Objective
2.3.4 Units, Currency, and Conversions
2.3.5 Industry Value Chain
2.4. Key Market Segments
2.5. Key Companies
2.6. Study Period
Chapter 3. Strategic Analysis Review
3.1. Ale Beer Pricing Analysis and Forecast
3.2. Porter’s Five Forces
3.3. Market Ecosystem
3.4. SWOT Analysis
3.5. Regulatory Scenario
3.3. Effects of Inflation, Russia-Ukraine War, moderating economic growth, and other macroeconomic factors
Chapter 4. Competitive Landscape
4.1. Market Share Analysis
4.1.1. Global Ale Beer Market Share by Company, 2023
4.1.2. Product Offerings of Leading Ale Beer Companies
4.2. Market Entropy
4.2.1. New Product Launches in the Industry
4.2.2. Mergers, Acquisitions, Joint ventures, and Partnerships
4.3. Key Strategies and Best Practices
Chapter 5. Global Market Projections: Best, Reference, and Low Case Scenarios
5.1. Growth Analysis- Case Scenario Definitions
5.2. Low Growth Case Scenario Forecasts
5.3. Reference Growth Case Scenario Forecasts
5.4. High Growth Case Scenario Forecasts
Chapter 6. Market Dynamics
6.1. Ale Beer Market Drivers
6.2. Ale Beer Market Challenges
6.6. Ale Beer Market Opportunities
6.4. Ale Beer Market Trends
Chapter 7. Global Ale Beer Market Outlook Trends
7.1. Global Ale Beer Revenue (USD Million) and CAGR (%) by Type (2021-2032)
7.2. Global Ale Beer Revenue (USD Million) and CAGR (%) by Application (2021-2032)
7.3. Global Ale Beer Revenue (USD Million) and CAGR (%) by Product (2021-2032)
By Type
Pasteurimd Beer
Draft Beer
By Distribution Channel
Offline
Online
By End-User
Hospitals
Clinical Diagnostic Laboratories
Others
Chapter 8. Global Ale Beer Regional Analysis and Outlook
8.1. Global Ale Beer Revenue (USD Million) By Regions (2021- 2032)
8.2. North America Ale Beer Revenue (USD Million) by Country (2021-2032)
8.2.1. United States Ale Beer Regional Analysis and Outlook
8.2.2. Canada Ale Beer Regional Analysis and Outlook
8.2.3. Mexico Ale Beer Regional Analysis and Outlook
8.3. Europe Ale Beer Revenue (USD Million), by Country (2021-2032)
8.3.1. Germany Ale Beer Regional Analysis and Outlook
8.3.2. France Ale Beer Regional Analysis and Outlook
8.3.3. United Kingdom Ale Beer Regional Analysis and Outlook
8.3.4. Spain Ale Beer Regional Analysis and Outlook
8.3.5. Italy Ale Beer Regional Analysis and Outlook
8.3.6. Russia Ale Beer Regional Analysis and Outlook
8.3.7. Rest of Europe Ale Beer Regional Analysis and Outlook
8.4. Asia Pacific Ale Beer Revenue (USD Million) by Country (2021-2032)
8.4.1. China Ale Beer Regional Analysis and Outlook
8.4.2. Japan Ale Beer Regional Analysis and Outlook
8.4.3. India Ale Beer Regional Analysis and Outlook
8.4.4. South Korea Ale Beer Regional Analysis and Outlook
8.4.5. Australia Ale Beer Regional Analysis and Outlook
8.4.6. South East Asia Ale Beer Regional Analysis and Outlook
8.4.7. Rest of Asia Pacific Ale Beer Regional Analysis and Outlook
8.5. South America Ale Beer Revenue (USD Million), by Country (2021-2032)
8.5.1. Brazil Ale Beer Regional Analysis and Outlook
8.5.2. Argentina Ale Beer Regional Analysis and Outlook
8.5.3. Rest of South America Ale Beer Regional Analysis and Outlook
8.6. Middle East and Africa Ale Beer Revenue (USD Million) by Country (2021-2032)
8.6.1. Middle East Ale Beer Regional Analysis and Outlook
8.6.2. Africa Ale Beer Regional Analysis and Outlook
Chapter 9. North America Ale Beer Analysis and Outlook
9.1. North America Ale Beer Revenue (USD Million) by Segments (2021-2032)
9.1.1. North America Ale Beer Revenue (USD Million) by Type (2021-2032)
9.1.2. North America Ale Beer Revenue (USD Million) by Application (2021-2032)
9.1.3. North America Ale Beer Revenue (USD Million) by Product (2021-2032)
By Type
Pasteurimd Beer
Draft Beer
By Distribution Channel
Offline
Online
By End-User
Hospitals
Clinical Diagnostic Laboratories
Others
Chapter 10. Europe Ale Beer Analysis and Outlook
10.1. Europe Ale Beer Revenue (USD Million), by Segments (USD Million) (2021-2032)
10.1.1. Europe Ale Beer Revenue (USD Million) by Type (2021-2032)
10.1.2. Europe Ale Beer Revenue (USD Million) by Application (2021-2032)
10.1.3. Europe Ale Beer Revenue (USD Million) by Product (2021-2032)
By Type
Pasteurimd Beer
Draft Beer
By Distribution Channel
Offline
Online
By End-User
Hospitals
Clinical Diagnostic Laboratories
Others
Chapter 11. Asia Pacific Ale Beer Analysis and Outlook
11.1. Asia Pacific Ale Beer Revenue (USD Million), and Revenue (USD Million) by Segments (2021-2032)
11.1.1. Asia Pacific Ale Beer Revenue (USD Million) by Type (2021-2032)
11.1.2. Asia Pacific Ale Beer Revenue (USD Million) by Application (2021-2032)
11.1.3. Asia Pacific Ale Beer Revenue (USD Million) by Product (2021-2032)
By Type
Pasteurimd Beer
Draft Beer
By Distribution Channel
Offline
Online
By End-User
Hospitals
Clinical Diagnostic Laboratories
Others
Chapter 12. South America Ale Beer Analysis and Outlook
12.1. South America Ale Beer Revenue (USD Million), by Segments (2021-2032)
12.1.1. South America Ale Beer Revenue (USD Million) by Type (2021-2032)
12.1.2. South America Ale Beer Revenue (USD Million) by Application (2021-2032)
12.1.3. South America Ale Beer Revenue (USD Million) by Product (2021-2032)
By Type
Pasteurimd Beer
Draft Beer
By Distribution Channel
Offline
Online
By End-User
Hospitals
Clinical Diagnostic Laboratories
Others
Chapter 13. Middle East and Africa Ale Beer Analysis and Outlook
13.1. Middle East and Africa Ale Beer Revenue (USD Million), by Segments (2021-2032)
13.1.1. Middle East and Africa Ale Beer Revenue (USD Million) by Type (2021-2032)
13.1.2. Middle East and Africa Ale Beer Revenue (USD Million) by Application (2021-2032)
13.1.3. Middle East and Africa Ale Beer Revenue (USD Million) by Product (2021-2032)
By Type
Pasteurimd Beer
Draft Beer
By Distribution Channel
Offline
Online
By End-User
Hospitals
Clinical Diagnostic Laboratories
Others
Chapter 14. Ale Beer Company Profiles
14.1 Business Overview
14.2 Product Profiles
14.3 SWOT Profiles
14.5 Recent Developments
14.6 Financial Profile
List of Companies
Anheuser-Busch InBev SA/NV
Asahi Group Holdings Ltd
Carlsberg Breweries AS
D.G. Yuengling & Son Inc
Diageo Plc
Heineken NV
Kirin Holdings Co. Ltd
Molson Coors Brewing Co.
Sapporo Holdings Ltd
The Boston Beer Co. Inc
15. Methodology and Data Sources
15.1 Customization Offerings
15.2 Subscription Services
15.3 Related Reports
15.4 Publisher Expertise
LIST OF TABLES
Table 1 Market Segmentation Analysis
Table 2 Global Ale Beer Market Share of Leading Companies, 2023
Table 3 Product Offerings of Leading Companies
Table 4 Low Growth Scenario Forecasts
Table 5 Reference Case Growth Scenario
Table 6 High Growth Case Scenario
Table 7 Global Ale Beer Revenue (USD Million) And CAGR (%) By Type (2021-2032)
Table 8 Global Ale Beer Revenue (USD Million) And CAGR (%) By Application (2021-2032)
Table 9 Global Ale Beer Revenue (USD Million) And CAGR (%) By Product (2021-2032)
Table 10 Global Ale Beer Market Revenue (USD Million) By Regions (2021-2032)
Table 11 Global Ale Beer Market Share (%) By Regions (2021-2032)
Table 12 North America Ale Beer Revenue (USD Million) By Country (2021-2032)
Table 13 Europe Ale Beer Revenue (USD Million) By Country (2021-2032)
Table 14 Asia Pacific Ale Beer Revenue (USD Million) By Country (2021-2032)
Table 15 South America Ale Beer Revenue (USD Million) By Country (2021-2032)
Table 16 Middle East and Africa Ale Beer Revenue (USD Million) By Region (2021-2032)
Table 17 North America Ale Beer Revenue (USD Million) By Type (2021-2032)
Table 18 North America Ale Beer Revenue (USD Million) By Application (2021-2032)
Table 19 North America Ale Beer Revenue (USD Million) By Product (2021-2032)
Table 20 Europe Ale Beer Revenue (USD Million) By Type (2021-2032)
Table 21 Europe Ale Beer Revenue (USD Million) By Application (2021-2032)
Table 22 Europe Ale Beer Revenue (USD Million) By Product (2021-2032)
Table 23 Asia Pacific Ale Beer Revenue (USD Million) By Type (2021-2032)
Table 24 Asia Pacific Ale Beer Revenue (USD Million) By Application (2021-2032)
Table 25 Asia Pacific Ale Beer Revenue (USD Million) By Product (2021-2032)
Table 26 South America Ale Beer Revenue (USD Million) By Type (2021-2032)
Table 27 South America Ale Beer Revenue (USD Million) By Application (2021-2032)
Table 28 South America Ale Beer Revenue (USD Million) By Product (2021-2032)
Table 29 Middle East and Africa Ale Beer Revenue (USD Million) By Type (2021-2032)
Table 30 Middle East and Africa Ale Beer Revenue (USD Million) By Application (2021-2032)
Table 31 Middle East and Africa Ale Beer Revenue (USD Million) By Product (2021-2032)
LIST OF FIGURES
Figure 1. Market Scope
Figure 2. Pricing Forecasts Per Unit, 2023- 2032
Figure 3. Porter’s Five Forces
Figure 4. Global Ale Beer Market Revenue (USD Million) By Regions (2021-2032)
Figure 5. Global Ale Beer Market Share (%) By Regions (2023)
Figure 6. North America Ale Beer Revenue (USD Million) By Country (2021-2032)
Figure 7. United States Ale Beer Revenue (USD Million) By Country (2021-2032)
Figure 8. Canada Ale Beer Revenue (USD Million) By Country (2021-2032)
Figure 9. Mexico Ale Beer Revenue (USD Million) By Country (2021-2032)
Figure 10. Europe Ale Beer Revenue (USD Million) By Country (2021-2032)
Figure 11. Germany Ale Beer Revenue (USD Million) By Country (2021-2032)
Figure 12. France Ale Beer Revenue (USD Million) By Country (2021-2032)
Figure 13. United Kingdom Ale Beer Revenue (USD Million) By Country (2021-2032)
Figure 14. Spain Ale Beer Revenue (USD Million) By Country (2021-2032)
Figure 15. Italy Ale Beer Revenue (USD Million) By Country (2021-2032)
Figure 16. Russia Ale Beer Revenue (USD Million) By Country (2021-2032)
Figure 17. Rest of Europe Ale Beer Revenue (USD Million) By Country (2021-2032)
Figure 11. Asia Pacific Ale Beer Revenue (USD Million) By Country (2021-2032)
Figure 12. China Ale Beer Revenue (USD Million) By Country (2021-2032)
Figure 13. Japan Ale Beer Revenue (USD Million) By Country (2021-2032)
Figure 14. India Ale Beer Revenue (USD Million) By Country (2021-2032)
Figure 15. South Korea Ale Beer Revenue (USD Million) By Country (2021-2032)
Figure 16. Australia Ale Beer Revenue (USD Million) By Country (2021-2032)
Figure 17. South East Asia Ale Beer Revenue (USD Million) By Country (2021-2032)
Figure 18. South America Ale Beer Revenue (USD Million) By Country (2021-2032)
Figure 19. Brazil Ale Beer Revenue (USD Million) By Country (2021-2032)
Figure 20. Argentina Ale Beer Revenue (USD Million) By Country (2021-2032)
Figure 21. Rest of Asia Pacific Ale Beer Revenue (USD Million) By Country (2021-2032)
Figure 22. Middle East and Africa Ale Beer Revenue (USD Million) By Region (2021-2032)
Figure 23. Saudi Arabia Ale Beer Revenue (USD Million) By Region (2021-2032)
Figure 24. The UAE Ale Beer Revenue (USD Million) By Region (2021-2032)
Figure 25. Rest of Middle East Ale Beer Revenue (USD Million) By Region (2021-2032)
Figure 26. South Africa Ale Beer Revenue (USD Million) By Region (2021-2032)
Figure 27. Africa Ale Beer Revenue (USD Million) By Region (2021-2032)
Figure 28. North America Ale Beer Revenue (USD Million) By Type (2021-2032)
Figure 29. North America Ale Beer Revenue (USD Million) By Application (2021-2032)
Figure 30. North America Ale Beer Revenue (USD Million) By Product (2021-2032)
Figure 31. Europe Ale Beer Revenue (USD Million) By Type (2021-2032)
Figure 32. Europe Ale Beer Revenue (USD Million) By Application (2021-2032)
Figure 33. Europe Ale Beer Revenue (USD Million) By Product (2021-2032)
Figure 34. Asia Pacific Ale Beer Revenue (USD Million) By Type (2021-2032)
Figure 35. Asia Pacific Ale Beer Revenue (USD Million) By Application (2021-2032)
Figure 36. Asia Pacific Ale Beer Revenue (USD Million) By Product (2021-2032)
Figure 37. South America Ale Beer Revenue (USD Million) By Type (2021-2032)
Figure 38. South America Ale Beer Revenue (USD Million) By Application (2021-2032)
Figure 39. South America Ale Beer Revenue (USD Million) By Product (2021-2032)
Figure 40. Middle East and Africa Ale Beer Revenue (USD Million) By Type (2021-2032)
Figure 41. Middle East and Africa Ale Beer Revenue (USD Million) By Application (2021-2032)
Figure 42. Middle East and Africa Ale Beer Revenue (USD Million) By Product (2021-2032)
By Type
Pasteurimd Beer
Draft Beer
By Distribution Channel
Offline
Online
By End-User
Hospitals
Clinical Diagnostic Laboratories
Others
Countries Analyzed
North America (US, Canada, Mexico)
Europe (Germany, UK, France, Spain, Italy, Russia, Rest of Europe)
Asia Pacific (China, India, Japan, South Korea, Australia, South East Asia, Rest of Asia)
South America (Brazil, Argentina, Rest of South America)
Middle East and Africa (Saudi Arabia, UAE, Rest of Middle East, South Africa, Egypt, Rest of Africa)
