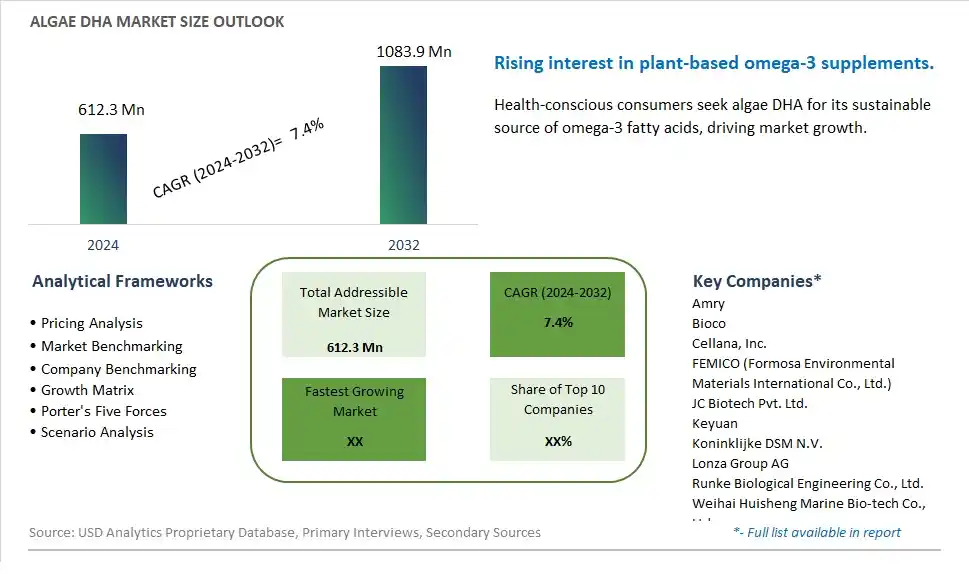
Global Algae DHA Market Size is valued at $612.3 Million in 2024 and is forecast to register a growth rate (CAGR) of 7.4% to reach $1083.9 Million by 2032.
The global Algae DHA Market Comprehensive Study analyzes and forecasts the market size across 6 regions and 24 countries for diverse segments -By Type (DHA powder, DHA oil), By Application (Infant Formula, Nutritional Supplements, Food & Beverage, Others)
An Introduction to Algae DHA Market
In 2024, the Algae DHA market is witnessing substantial growth, driven by the increasing demand for plant-based and sustainable sources of omega-3 fatty acids. DHA (Docosahexaenoic Acid) derived from algae is a vital nutrient for brain health, cardiovascular function, and overall wellness. The market is supported by rising consumer awareness of the health benefits of DHA, particularly among vegetarians and vegans seeking alternatives to fish oil. Innovations in algae cultivation and extraction techniques are enhancing the purity and potency of algae DHA. The market is also benefiting from the inclusion of DHA in infant formula, dietary supplements, and functional foods.
Algae DHA Competitive Landscape
The market report analyses the leading companies in the industry including Amry, Bioco, Cellana, Inc., FEMICO (Formosa Environmental Materials International Co., Ltd.), JC Biotech Pvt. Ltd., Keyuan, Koninklijke DSM N.V., Lonza Group AG, Runke Biological Engineering Co., Ltd., Weihai Huisheng Marine Bio-tech Co., Ltd., Wuhan Healthdream Biological Technology Co., Ltd. (CABIO), Yuexiang, Zhejiang Fuxing Biotechnology Co., Ltd., Zhejiang Kingdomway Group Co., Ltd., and Others.
Algae DHA Market Dynamics
Algae DHA Market Trend: Rising Demand for Plant-Based Omega-3 Supplements
The market trend for Algae DHA is experiencing a significant uptick in demand driven by the growing preference for plant-based omega-3 supplements. With increasing awareness of the health benefits of omega-3 fatty acids and concerns over sustainability and contamination in fish-derived supplements, consumers are turning to algae-based sources. This trend is fueled by health-conscious individuals seeking vegan-friendly and eco-friendly alternatives without compromising on nutritional benefits, driving the growth of the Algae DHA market.
Algae DHA Market Driver: Health and Wellness Trends
One of the primary market drivers for Algae DHA is the overarching health and wellness trend. Consumers are increasingly prioritizing preventive healthcare measures, including dietary supplements that support heart health, cognitive function, and overall well-being. Algae DHA, being a rich source of essential omega-3 fatty acids crucial for brain and cardiovascular health, is gaining traction as a preferred choice among health-conscious individuals, driving the demand for Algae DHA products.
Algae DHA Market Opportunity: Expansion in Functional Foods and Beverages
An enticing market opportunity for Algae DHA lies in its expansion into the functional foods and beverages segment. As consumers seek convenient ways to incorporate health-promoting ingredients into their daily diet, there is a growing demand for fortified products such as plant-based milk alternatives, juices, and snacks infused with Algae DHA. Collaborating with food and beverage manufacturers to develop innovative, DHA-fortified products can unlock new avenues for market penetration and cater to the evolving preferences of health-conscious consumers looking for convenient and nutritious options.
Algae DHA Market Share Analysis: DHA Oil segment generated the highest revenue share in the industry
The DHA Oil segment is the largest in the Algae DHA Market by type. DHA oil is highly sought after due to its versatility and high concentration of docosahexaenoic acid (DHA), an omega3 fatty acid essential for brain and eye development. This oil is extensively used in dietary supplements, fortified foods, and infant formula, where the purity and potency of DHA are critical. The liquid form of DHA oil allows for easy incorporation into various product formulations, making it a preferred choice for manufacturers. Additionally, the growing consumer awareness of the health benefits associated with omega3 fatty acids, such as improved cognitive function and cardiovascular health, drives the demand for DHA oil. As the trend towards healthier lifestyles continues, the DHA oil segment maintains its leading position in the market.
Algae DHA Market Share Analysis: Infant Formula is the fastest growing segment over the forecast period to 2032
The Infant Formula segment within the Algae DHA Market is projected to be the fastest growing segment by 2032. This growth is driven by the increasing recognition of the importance of DHA for the healthy development of infants, particularly for brain and eye health. Algaederived DHA is considered a superior source due to its purity and sustainability compared to fishderived DHA. As more parents become aware of the benefits of DHA in supporting cognitive and visual development, the demand for DHAfortified infant formulas is rising. Additionally, the expanding middle class in emerging economies and the increasing trend of breastfeeding supplementation are contributing to the growth of this segment. Manufacturers are continuously innovating and improving the nutritional profiles of their infant formulas, further boosting the demand for highquality DHA. As a result, the infant formula segment is expected to experience significant growth, making it the fastest growing application area for algae DHA through 2032.
Algae DHA Market Segmentation
By Type
DHA powder
DHA oil
By Application
Infant Formula
Nutritional Supplements
Food & Beverage
Others
Countries Analyzed
North America (US, Canada, Mexico)
Europe (Germany, UK, France, Spain, Italy, Russia, Rest of Europe)
Asia Pacific (China, India, Japan, South Korea, Australia, South East Asia, Rest of Asia)
South America (Brazil, Argentina, Rest of South America)
Middle East and Africa (Saudi Arabia, UAE, Rest of Middle East, South Africa, Egypt, Rest of Africa)
Algae DHA Companies Profiled in the Study
Amry
Bioco
Cellana, Inc.
FEMICO (Formosa Environmental Materials International Co., Ltd.)
JC Biotech Pvt. Ltd.
Keyuan
Koninklijke DSM N.V.
Lonza Group AG
Runke Biological Engineering Co., Ltd.
Weihai Huisheng Marine Bio-tech Co., Ltd.
Wuhan Healthdream Biological Technology Co., Ltd. (CABIO)
Yuexiang
Zhejiang Fuxing Biotechnology Co., Ltd.
Zhejiang Kingdomway Group Co., Ltd.
*- List Not Exhaustive
Chapter 1. TABLE OF CONTENTS
Chapter 2. Introduction to Algae DHA Market
2.1. Market Overview
2.2. Key Statistics and Report Highlights
2.3. Scope of the Comprehensive Study
2.3.1. Market Definition
2.3.2 Countries and Regions Covered
2.3.3 Research Objective
2.3.4 Units, Currency, and Conversions
2.3.5 Industry Value Chain
2.4. Key Market Segments
2.5. Key Companies
2.6. Study Period
Chapter 3. Strategic Analysis Review
3.1. Algae DHA Pricing Analysis and Forecast
3.2. Porter’s Five Forces
3.3. Market Ecosystem
3.4. SWOT Analysis
3.5. Regulatory Scenario
3.3. Effects of Inflation, Russia-Ukraine War, moderating economic growth, and other macroeconomic factors
Chapter 4. Competitive Landscape
4.1. Market Share Analysis
4.1.1. Global Algae DHA Market Share by Company, 2023
4.1.2. Product Offerings of Leading Algae DHA Companies
4.2. Market Entropy
4.2.1. New Product Launches in the Industry
4.2.2. Mergers, Acquisitions, Joint ventures, and Partnerships
4.3. Key Strategies and Best Practices
Chapter 5. Global Market Projections: Best, Reference, and Low Case Scenarios
5.1. Growth Analysis- Case Scenario Definitions
5.2. Low Growth Case Scenario Forecasts
5.3. Reference Growth Case Scenario Forecasts
5.4. High Growth Case Scenario Forecasts
Chapter 6. Market Dynamics
6.1. Algae DHA Market Drivers
6.2. Algae DHA Market Challenges
6.6. Algae DHA Market Opportunities
6.4. Algae DHA Market Trends
Chapter 7. Global Algae DHA Market Outlook Trends
7.1. Global Algae DHA Revenue (USD Million) and CAGR (%) by Type (2021-2032)
7.2. Global Algae DHA Revenue (USD Million) and CAGR (%) by Application (2021-2032)
7.3. Global Algae DHA Revenue (USD Million) and CAGR (%) by Product (2021-2032)
By Type
DHA powder
DHA oil
By Application
Infant Formula
Nutritional Supplements
Food & Beverage
Others
Chapter 8. Global Algae DHA Regional Analysis and Outlook
8.1. Global Algae DHA Revenue (USD Million) By Regions (2021- 2032)
8.2. North America Algae DHA Revenue (USD Million) by Country (2021-2032)
8.2.1. United States Algae DHA Regional Analysis and Outlook
8.2.2. Canada Algae DHA Regional Analysis and Outlook
8.2.3. Mexico Algae DHA Regional Analysis and Outlook
8.3. Europe Algae DHA Revenue (USD Million), by Country (2021-2032)
8.3.1. Germany Algae DHA Regional Analysis and Outlook
8.3.2. France Algae DHA Regional Analysis and Outlook
8.3.3. United Kingdom Algae DHA Regional Analysis and Outlook
8.3.4. Spain Algae DHA Regional Analysis and Outlook
8.3.5. Italy Algae DHA Regional Analysis and Outlook
8.3.6. Russia Algae DHA Regional Analysis and Outlook
8.3.7. Rest of Europe Algae DHA Regional Analysis and Outlook
8.4. Asia Pacific Algae DHA Revenue (USD Million) by Country (2021-2032)
8.4.1. China Algae DHA Regional Analysis and Outlook
8.4.2. Japan Algae DHA Regional Analysis and Outlook
8.4.3. India Algae DHA Regional Analysis and Outlook
8.4.4. South Korea Algae DHA Regional Analysis and Outlook
8.4.5. Australia Algae DHA Regional Analysis and Outlook
8.4.6. South East Asia Algae DHA Regional Analysis and Outlook
8.4.7. Rest of Asia Pacific Algae DHA Regional Analysis and Outlook
8.5. South America Algae DHA Revenue (USD Million), by Country (2021-2032)
8.5.1. Brazil Algae DHA Regional Analysis and Outlook
8.5.2. Argentina Algae DHA Regional Analysis and Outlook
8.5.3. Rest of South America Algae DHA Regional Analysis and Outlook
8.6. Middle East and Africa Algae DHA Revenue (USD Million) by Country (2021-2032)
8.6.1. Middle East Algae DHA Regional Analysis and Outlook
8.6.2. Africa Algae DHA Regional Analysis and Outlook
Chapter 9. North America Algae DHA Analysis and Outlook
9.1. North America Algae DHA Revenue (USD Million) by Segments (2021-2032)
9.1.1. North America Algae DHA Revenue (USD Million) by Type (2021-2032)
9.1.2. North America Algae DHA Revenue (USD Million) by Application (2021-2032)
9.1.3. North America Algae DHA Revenue (USD Million) by Product (2021-2032)
By Type
DHA powder
DHA oil
By Application
Infant Formula
Nutritional Supplements
Food & Beverage
Others
Chapter 10. Europe Algae DHA Analysis and Outlook
10.1. Europe Algae DHA Revenue (USD Million), by Segments (USD Million) (2021-2032)
10.1.1. Europe Algae DHA Revenue (USD Million) by Type (2021-2032)
10.1.2. Europe Algae DHA Revenue (USD Million) by Application (2021-2032)
10.1.3. Europe Algae DHA Revenue (USD Million) by Product (2021-2032)
By Type
DHA powder
DHA oil
By Application
Infant Formula
Nutritional Supplements
Food & Beverage
Others
Chapter 11. Asia Pacific Algae DHA Analysis and Outlook
11.1. Asia Pacific Algae DHA Revenue (USD Million), and Revenue (USD Million) by Segments (2021-2032)
11.1.1. Asia Pacific Algae DHA Revenue (USD Million) by Type (2021-2032)
11.1.2. Asia Pacific Algae DHA Revenue (USD Million) by Application (2021-2032)
11.1.3. Asia Pacific Algae DHA Revenue (USD Million) by Product (2021-2032)
By Type
DHA powder
DHA oil
By Application
Infant Formula
Nutritional Supplements
Food & Beverage
Others
Chapter 12. South America Algae DHA Analysis and Outlook
12.1. South America Algae DHA Revenue (USD Million), by Segments (2021-2032)
12.1.1. South America Algae DHA Revenue (USD Million) by Type (2021-2032)
12.1.2. South America Algae DHA Revenue (USD Million) by Application (2021-2032)
12.1.3. South America Algae DHA Revenue (USD Million) by Product (2021-2032)
By Type
DHA powder
DHA oil
By Application
Infant Formula
Nutritional Supplements
Food & Beverage
Others
Chapter 13. Middle East and Africa Algae DHA Analysis and Outlook
13.1. Middle East and Africa Algae DHA Revenue (USD Million), by Segments (2021-2032)
13.1.1. Middle East and Africa Algae DHA Revenue (USD Million) by Type (2021-2032)
13.1.2. Middle East and Africa Algae DHA Revenue (USD Million) by Application (2021-2032)
13.1.3. Middle East and Africa Algae DHA Revenue (USD Million) by Product (2021-2032)
By Type
DHA powder
DHA oil
By Application
Infant Formula
Nutritional Supplements
Food & Beverage
Others
Chapter 14. Algae DHA Company Profiles
14.1 Business Overview
14.2 Product Profiles
14.3 SWOT Profiles
14.5 Recent Developments
14.6 Financial Profile
List of Companies
Amry
Bioco
Cellana, Inc.
FEMICO (Formosa Environmental Materials International Co., Ltd.)
JC Biotech Pvt. Ltd.
Keyuan
Koninklijke DSM N.V.
Lonza Group AG
Runke Biological Engineering Co., Ltd.
Weihai Huisheng Marine Bio-tech Co., Ltd.
Wuhan Healthdream Biological Technology Co., Ltd. (CABIO)
Yuexiang
Zhejiang Fuxing Biotechnology Co., Ltd.
Zhejiang Kingdomway Group Co., Ltd.
15. Methodology and Data Sources
15.1 Customization Offerings
15.2 Subscription Services
15.3 Related Reports
15.4 Publisher Expertise
LIST OF TABLES
Table 1 Market Segmentation Analysis
Table 2 Global Algae DHA Market Share of Leading Companies, 2023
Table 3 Product Offerings of Leading Companies
Table 4 Low Growth Scenario Forecasts
Table 5 Reference Case Growth Scenario
Table 6 High Growth Case Scenario
Table 7 Global Algae DHA Revenue (USD Million) And CAGR (%) By Type (2021-2032)
Table 8 Global Algae DHA Revenue (USD Million) And CAGR (%) By Application (2021-2032)
Table 9 Global Algae DHA Revenue (USD Million) And CAGR (%) By Product (2021-2032)
Table 10 Global Algae DHA Market Revenue (USD Million) By Regions (2021-2032)
Table 11 Global Algae DHA Market Share (%) By Regions (2021-2032)
Table 12 North America Algae DHA Revenue (USD Million) By Country (2021-2032)
Table 13 Europe Algae DHA Revenue (USD Million) By Country (2021-2032)
Table 14 Asia Pacific Algae DHA Revenue (USD Million) By Country (2021-2032)
Table 15 South America Algae DHA Revenue (USD Million) By Country (2021-2032)
Table 16 Middle East and Africa Algae DHA Revenue (USD Million) By Region (2021-2032)
Table 17 North America Algae DHA Revenue (USD Million) By Type (2021-2032)
Table 18 North America Algae DHA Revenue (USD Million) By Application (2021-2032)
Table 19 North America Algae DHA Revenue (USD Million) By Product (2021-2032)
Table 20 Europe Algae DHA Revenue (USD Million) By Type (2021-2032)
Table 21 Europe Algae DHA Revenue (USD Million) By Application (2021-2032)
Table 22 Europe Algae DHA Revenue (USD Million) By Product (2021-2032)
Table 23 Asia Pacific Algae DHA Revenue (USD Million) By Type (2021-2032)
Table 24 Asia Pacific Algae DHA Revenue (USD Million) By Application (2021-2032)
Table 25 Asia Pacific Algae DHA Revenue (USD Million) By Product (2021-2032)
Table 26 South America Algae DHA Revenue (USD Million) By Type (2021-2032)
Table 27 South America Algae DHA Revenue (USD Million) By Application (2021-2032)
Table 28 South America Algae DHA Revenue (USD Million) By Product (2021-2032)
Table 29 Middle East and Africa Algae DHA Revenue (USD Million) By Type (2021-2032)
Table 30 Middle East and Africa Algae DHA Revenue (USD Million) By Application (2021-2032)
Table 31 Middle East and Africa Algae DHA Revenue (USD Million) By Product (2021-2032)
LIST OF FIGURES
Figure 1. Market Scope
Figure 2. Pricing Forecasts Per Unit, 2023- 2032
Figure 3. Porter’s Five Forces
Figure 4. Global Algae DHA Market Revenue (USD Million) By Regions (2021-2032)
Figure 5. Global Algae DHA Market Share (%) By Regions (2023)
Figure 6. North America Algae DHA Revenue (USD Million) By Country (2021-2032)
Figure 7. United States Algae DHA Revenue (USD Million) By Country (2021-2032)
Figure 8. Canada Algae DHA Revenue (USD Million) By Country (2021-2032)
Figure 9. Mexico Algae DHA Revenue (USD Million) By Country (2021-2032)
Figure 10. Europe Algae DHA Revenue (USD Million) By Country (2021-2032)
Figure 11. Germany Algae DHA Revenue (USD Million) By Country (2021-2032)
Figure 12. France Algae DHA Revenue (USD Million) By Country (2021-2032)
Figure 13. United Kingdom Algae DHA Revenue (USD Million) By Country (2021-2032)
Figure 14. Spain Algae DHA Revenue (USD Million) By Country (2021-2032)
Figure 15. Italy Algae DHA Revenue (USD Million) By Country (2021-2032)
Figure 16. Russia Algae DHA Revenue (USD Million) By Country (2021-2032)
Figure 17. Rest of Europe Algae DHA Revenue (USD Million) By Country (2021-2032)
Figure 11. Asia Pacific Algae DHA Revenue (USD Million) By Country (2021-2032)
Figure 12. China Algae DHA Revenue (USD Million) By Country (2021-2032)
Figure 13. Japan Algae DHA Revenue (USD Million) By Country (2021-2032)
Figure 14. India Algae DHA Revenue (USD Million) By Country (2021-2032)
Figure 15. South Korea Algae DHA Revenue (USD Million) By Country (2021-2032)
Figure 16. Australia Algae DHA Revenue (USD Million) By Country (2021-2032)
Figure 17. South East Asia Algae DHA Revenue (USD Million) By Country (2021-2032)
Figure 18. South America Algae DHA Revenue (USD Million) By Country (2021-2032)
Figure 19. Brazil Algae DHA Revenue (USD Million) By Country (2021-2032)
Figure 20. Argentina Algae DHA Revenue (USD Million) By Country (2021-2032)
Figure 21. Rest of Asia Pacific Algae DHA Revenue (USD Million) By Country (2021-2032)
Figure 22. Middle East and Africa Algae DHA Revenue (USD Million) By Region (2021-2032)
Figure 23. Saudi Arabia Algae DHA Revenue (USD Million) By Region (2021-2032)
Figure 24. The UAE Algae DHA Revenue (USD Million) By Region (2021-2032)
Figure 25. Rest of Middle East Algae DHA Revenue (USD Million) By Region (2021-2032)
Figure 26. South Africa Algae DHA Revenue (USD Million) By Region (2021-2032)
Figure 27. Africa Algae DHA Revenue (USD Million) By Region (2021-2032)
Figure 28. North America Algae DHA Revenue (USD Million) By Type (2021-2032)
Figure 29. North America Algae DHA Revenue (USD Million) By Application (2021-2032)
Figure 30. North America Algae DHA Revenue (USD Million) By Product (2021-2032)
Figure 31. Europe Algae DHA Revenue (USD Million) By Type (2021-2032)
Figure 32. Europe Algae DHA Revenue (USD Million) By Application (2021-2032)
Figure 33. Europe Algae DHA Revenue (USD Million) By Product (2021-2032)
Figure 34. Asia Pacific Algae DHA Revenue (USD Million) By Type (2021-2032)
Figure 35. Asia Pacific Algae DHA Revenue (USD Million) By Application (2021-2032)
Figure 36. Asia Pacific Algae DHA Revenue (USD Million) By Product (2021-2032)
Figure 37. South America Algae DHA Revenue (USD Million) By Type (2021-2032)
Figure 38. South America Algae DHA Revenue (USD Million) By Application (2021-2032)
Figure 39. South America Algae DHA Revenue (USD Million) By Product (2021-2032)
Figure 40. Middle East and Africa Algae DHA Revenue (USD Million) By Type (2021-2032)
Figure 41. Middle East and Africa Algae DHA Revenue (USD Million) By Application (2021-2032)
Figure 42. Middle East and Africa Algae DHA Revenue (USD Million) By Product (2021-2032)
By Type
DHA powder
DHA oil
By Application
Infant Formula
Nutritional Supplements
Food & Beverage
Others
Countries Analyzed
North America (US, Canada, Mexico)
Europe (Germany, UK, France, Spain, Italy, Russia, Rest of Europe)
Asia Pacific (China, India, Japan, South Korea, Australia, South East Asia, Rest of Asia)
South America (Brazil, Argentina, Rest of South America)
Middle East and Africa (Saudi Arabia, UAE, Rest of Middle East, South Africa, Egypt, Rest of Africa)
