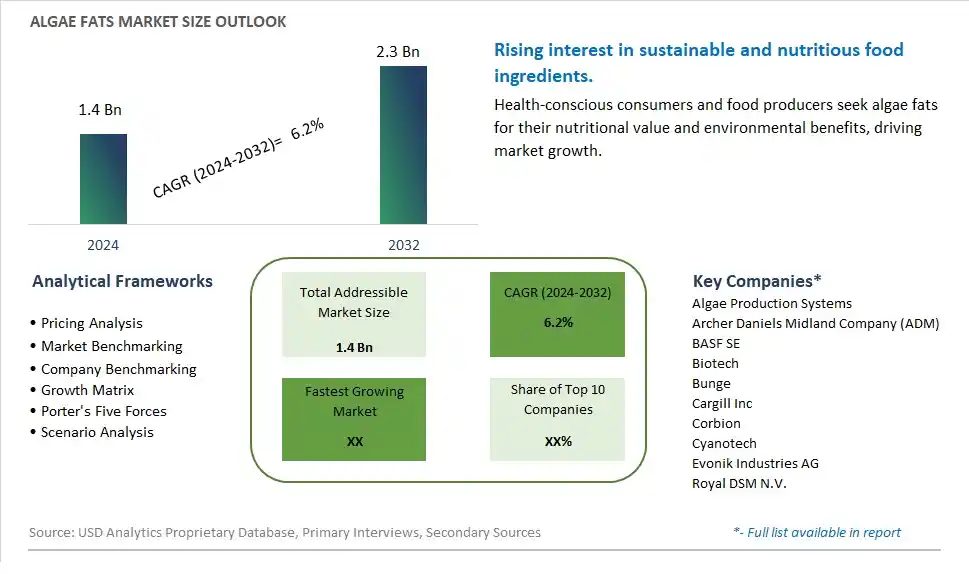
Global Algae Fats Market Size is valued at $1.4 Billion in 2024 and is forecast to register a growth rate (CAGR) of 6.2% to reach $2.3 Billion by 2032.
The global Algae Fats Market Comprehensive Study analyzes and forecasts the market size across 6 regions and 24 countries for diverse segments -By Type (Food Grade, Feed Grade), By End-User (Biofuel, Dietary Supplement, Animal Feed, Others)
An Introduction to Algae Fats Market
In 2024, the algae fats market is experiencing rapid growth, fueled by the increasing demand for sustainable and plant-based alternatives to conventional fats and oils. Algae, rich in omega-3 fatty acids, offer a nutritious and environmentally friendly source of fats, making them a preferred choice among health-conscious consumers and environmentally conscious companies. The food and beverage industry is integrating algae fats into a wide range of products, including plant-based spreads, dairy alternatives, baked goods, and snacks, capitalizing on their nutritional benefits and functional properties. Moreover, the pharmaceutical and nutraceutical sectors are exploring the therapeutic potential of algae fats in managing cardiovascular health and inflammatory conditions, further driving market expansion. With ongoing research and technological advancements, the algae fats market is poised for continued growth and innovation in the coming years.
Algae Fats Competitive Landscape
The market report analyses the leading companies in the industry including Algae Production Systems, Archer Daniels Midland Company (ADM), BASF SE, Biotech, Bunge, Cargill Inc, Corbion, Cyanotech, Evonik Industries AG, Royal DSM N.V., and Others.
Algae Fats Market Dynamics
Algae Fats Market Trend: Growing Demand for Plant-Based and Sustainable Fat Alternatives
One prominent trend in the algae fats market is the growing demand for plant-based and sustainable fat alternatives. As consumers increasingly seek healthier and more environmentally friendly options, there's a rising interest in plant-derived fats that offer nutritional benefits while minimizing environmental impact. Algae fats, derived from microalgae, are gaining popularity as a sustainable source of healthy fats rich in omega-3 fatty acids and other essential nutrients. This trend is driving the adoption of algae fats in various food and beverage applications, including plant-based dairy alternatives, spreads, dressings, and baked goods, as manufacturers respond to consumer demand for plant-based and sustainable alternatives to conventional fats.
Market Driver: Shift Towards Health-Conscious Eating and Functional Foods
A key driver in the algae fats market is the shift towards health-conscious eating and functional foods. With increasing awareness of the role of dietary fats in overall health and well-being, consumers are seeking functional fats that offer specific health benefits beyond basic nutrition. Algae fats are valued for their high content of omega-3 fatty acids, particularly EPA (eicosapentaenoic acid) and DHA (docosahexaenoic acid), which are known for their cardiovascular, cognitive, and anti-inflammatory benefits. This driver fuels market growth as consumers prioritize foods and beverages enriched with functional ingredients like algae fats to support their health goals and address specific health concerns, such as heart health, brain health, and inflammation management.
Market Opportunity: Expansion into Nutritional Supplements and Wellness Products
An emerging opportunity in the algae fats market is the expansion into nutritional supplements and wellness products. Beyond their use in food and beverage formulations, algae fats offer potential opportunities in the nutritional supplements and wellness products markets, where there's a growing demand for omega-3 supplements and functional ingredients that promote overall health and vitality. Algae fats can be incorporated into dietary supplements such as omega-3 capsules, softgels, and powders, targeting consumers seeking convenient and concentrated sources of essential fatty acids for cardiovascular and cognitive health. Additionally, algae fats can be used in wellness products such as beauty supplements, skincare products, and pet supplements, offering potential benefits for skin health, inflammation reduction, and overall wellness. By exploring new product categories and market segments, algae fats manufacturers can diversify their product portfolios and capitalize on the expanding market for functional and health-enhancing products.
Algae Fats Market Share Analysis: Food Grade held the dominant market share in 2024
The Food Grade Algae Fats Market is the largest segment within the Algae Fats Market due to its extensive applications across various food and beverage industries. Food grade algae fats, derived from microalgae, offer a sustainable and nutritious alternative to traditional sources of fats and oils. They are rich in essential fatty acids such as omega-3 and omega-6, making them highly sought after by health-conscious consumers and food manufacturers alike. Additionally, food grade algae fats are free from cholesterol and trans fats, making them ideal for use in a wide range of products, including dairy alternatives, baked goods, confectionery, and nutritional supplements. With the growing consumer demand for plant-based and sustainable ingredients, coupled with increasing awareness of the health benefits associated with algae fats, the Food Grade Algae Fats Market continues to expand, solidifying its position as the largest segment in the Algae Fats Market.
Algae Fats Market Share Analysis: Dietary Supplement market is poised to register the fastest growth rae over the forecast period to 2032
The Dietary Supplement segment is the fastest-growing within the Algae Fats Market, driven by increasing consumer awareness of the health benefits associated with algae-derived omega-3 fatty acids. As people become more health-conscious, there is a growing demand for dietary supplements rich in essential nutrients like omega-3s, which are vital for heart health, cognitive function, and overall well-being. Algae fats offer a sustainable and vegan-friendly source of omega-3s, appealing to consumers seeking plant-based alternatives to traditional fish oil supplements. Further, algae-based supplements are free from contaminants commonly found in fish-derived omega-3 products, further boosting their popularity among health-conscious consumers. With the rising prevalence of lifestyle-related health conditions and the growing trend towards preventive healthcare, the Dietary Supplement segment of the Algae Fats Market is poised for rapid growth, offering consumers a convenient and sustainable way to support their health and wellness goals.
Algae Fats Market Segmentation
By Type
Food Grade
Feed Grade
By End-User
Biofuel
Dietary Supplement
Animal Feed
Others
Countries Analyzed
North America (US, Canada, Mexico)
Europe (Germany, UK, France, Spain, Italy, Russia, Rest of Europe)
Asia Pacific (China, India, Japan, South Korea, Australia, South East Asia, Rest of Asia)
South America (Brazil, Argentina, Rest of South America)
Middle East and Africa (Saudi Arabia, UAE, Rest of Middle East, South Africa, Egypt, Rest of Africa)
Algae Fats Companies Profiled in the Study
Algae Production Systems
Archer Daniels Midland Company (ADM)
BASF SE
Biotech
Bunge
Cargill Inc
Corbion
Cyanotech
Evonik Industries AG
Royal DSM N.V.
*- List Not Exhaustive
Chapter 1. TABLE OF CONTENTS
Chapter 2. Introduction to Algae Fats Market
2.1. Market Overview
2.2. Key Statistics and Report Highlights
2.3. Scope of the Comprehensive Study
2.3.1. Market Definition
2.3.2 Countries and Regions Covered
2.3.3 Research Objective
2.3.4 Units, Currency, and Conversions
2.3.5 Industry Value Chain
2.4. Key Market Segments
2.5. Key Companies
2.6. Study Period
Chapter 3. Strategic Analysis Review
3.1. Algae Fats Pricing Analysis and Forecast
3.2. Porter’s Five Forces
3.3. Market Ecosystem
3.4. SWOT Analysis
3.5. Regulatory Scenario
3.3. Effects of Inflation, Russia-Ukraine War, moderating economic growth, and other macroeconomic factors
Chapter 4. Competitive Landscape
4.1. Market Share Analysis
4.1.1. Global Algae Fats Market Share by Company, 2023
4.1.2. Product Offerings of Leading Algae Fats Companies
4.2. Market Entropy
4.2.1. New Product Launches in the Industry
4.2.2. Mergers, Acquisitions, Joint ventures, and Partnerships
4.3. Key Strategies and Best Practices
Chapter 5. Global Market Projections: Best, Reference, and Low Case Scenarios
5.1. Growth Analysis- Case Scenario Definitions
5.2. Low Growth Case Scenario Forecasts
5.3. Reference Growth Case Scenario Forecasts
5.4. High Growth Case Scenario Forecasts
Chapter 6. Market Dynamics
6.1. Algae Fats Market Drivers
6.2. Algae Fats Market Challenges
6.6. Algae Fats Market Opportunities
6.4. Algae Fats Market Trends
Chapter 7. Global Algae Fats Market Outlook Trends
7.1. Global Algae Fats Revenue (USD Million) and CAGR (%) by Type (2021-2032)
7.2. Global Algae Fats Revenue (USD Million) and CAGR (%) by Application (2021-2032)
7.3. Global Algae Fats Revenue (USD Million) and CAGR (%) by Product (2021-2032)
By Type
Food Grade
Feed Grade
By End-User
Biofuel
Dietary Supplement
Animal Feed
Others
Chapter 8. Global Algae Fats Regional Analysis and Outlook
8.1. Global Algae Fats Revenue (USD Million) By Regions (2021- 2032)
8.2. North America Algae Fats Revenue (USD Million) by Country (2021-2032)
8.2.1. United States Algae Fats Regional Analysis and Outlook
8.2.2. Canada Algae Fats Regional Analysis and Outlook
8.2.3. Mexico Algae Fats Regional Analysis and Outlook
8.3. Europe Algae Fats Revenue (USD Million), by Country (2021-2032)
8.3.1. Germany Algae Fats Regional Analysis and Outlook
8.3.2. France Algae Fats Regional Analysis and Outlook
8.3.3. United Kingdom Algae Fats Regional Analysis and Outlook
8.3.4. Spain Algae Fats Regional Analysis and Outlook
8.3.5. Italy Algae Fats Regional Analysis and Outlook
8.3.6. Russia Algae Fats Regional Analysis and Outlook
8.3.7. Rest of Europe Algae Fats Regional Analysis and Outlook
8.4. Asia Pacific Algae Fats Revenue (USD Million) by Country (2021-2032)
8.4.1. China Algae Fats Regional Analysis and Outlook
8.4.2. Japan Algae Fats Regional Analysis and Outlook
8.4.3. India Algae Fats Regional Analysis and Outlook
8.4.4. South Korea Algae Fats Regional Analysis and Outlook
8.4.5. Australia Algae Fats Regional Analysis and Outlook
8.4.6. South East Asia Algae Fats Regional Analysis and Outlook
8.4.7. Rest of Asia Pacific Algae Fats Regional Analysis and Outlook
8.5. South America Algae Fats Revenue (USD Million), by Country (2021-2032)
8.5.1. Brazil Algae Fats Regional Analysis and Outlook
8.5.2. Argentina Algae Fats Regional Analysis and Outlook
8.5.3. Rest of South America Algae Fats Regional Analysis and Outlook
8.6. Middle East and Africa Algae Fats Revenue (USD Million) by Country (2021-2032)
8.6.1. Middle East Algae Fats Regional Analysis and Outlook
8.6.2. Africa Algae Fats Regional Analysis and Outlook
Chapter 9. North America Algae Fats Analysis and Outlook
9.1. North America Algae Fats Revenue (USD Million) by Segments (2021-2032)
9.1.1. North America Algae Fats Revenue (USD Million) by Type (2021-2032)
9.1.2. North America Algae Fats Revenue (USD Million) by Application (2021-2032)
9.1.3. North America Algae Fats Revenue (USD Million) by Product (2021-2032)
By Type
Food Grade
Feed Grade
By End-User
Biofuel
Dietary Supplement
Animal Feed
Others
Chapter 10. Europe Algae Fats Analysis and Outlook
10.1. Europe Algae Fats Revenue (USD Million), by Segments (USD Million) (2021-2032)
10.1.1. Europe Algae Fats Revenue (USD Million) by Type (2021-2032)
10.1.2. Europe Algae Fats Revenue (USD Million) by Application (2021-2032)
10.1.3. Europe Algae Fats Revenue (USD Million) by Product (2021-2032)
By Type
Food Grade
Feed Grade
By End-User
Biofuel
Dietary Supplement
Animal Feed
Others
Chapter 11. Asia Pacific Algae Fats Analysis and Outlook
11.1. Asia Pacific Algae Fats Revenue (USD Million), and Revenue (USD Million) by Segments (2021-2032)
11.1.1. Asia Pacific Algae Fats Revenue (USD Million) by Type (2021-2032)
11.1.2. Asia Pacific Algae Fats Revenue (USD Million) by Application (2021-2032)
11.1.3. Asia Pacific Algae Fats Revenue (USD Million) by Product (2021-2032)
By Type
Food Grade
Feed Grade
By End-User
Biofuel
Dietary Supplement
Animal Feed
Others
Chapter 12. South America Algae Fats Analysis and Outlook
12.1. South America Algae Fats Revenue (USD Million), by Segments (2021-2032)
12.1.1. South America Algae Fats Revenue (USD Million) by Type (2021-2032)
12.1.2. South America Algae Fats Revenue (USD Million) by Application (2021-2032)
12.1.3. South America Algae Fats Revenue (USD Million) by Product (2021-2032)
By Type
Food Grade
Feed Grade
By End-User
Biofuel
Dietary Supplement
Animal Feed
Others
Chapter 13. Middle East and Africa Algae Fats Analysis and Outlook
13.1. Middle East and Africa Algae Fats Revenue (USD Million), by Segments (2021-2032)
13.1.1. Middle East and Africa Algae Fats Revenue (USD Million) by Type (2021-2032)
13.1.2. Middle East and Africa Algae Fats Revenue (USD Million) by Application (2021-2032)
13.1.3. Middle East and Africa Algae Fats Revenue (USD Million) by Product (2021-2032)
By Type
Food Grade
Feed Grade
By End-User
Biofuel
Dietary Supplement
Animal Feed
Others
Chapter 14. Algae Fats Company Profiles
14.1 Business Overview
14.2 Product Profiles
14.3 SWOT Profiles
14.5 Recent Developments
14.6 Financial Profile
List of Companies
Algae Production Systems
Archer Daniels Midland Company (ADM)
BASF SE
Biotech
Bunge
Cargill Inc
Corbion
Cyanotech
Evonik Industries AG
Royal DSM N.V.
15. Methodology and Data Sources
15.1 Customization Offerings
15.2 Subscription Services
15.3 Related Reports
15.4 Publisher Expertise
LIST OF TABLES
Table 1 Market Segmentation Analysis
Table 2 Global Algae Fats Market Share of Leading Companies, 2023
Table 3 Product Offerings of Leading Companies
Table 4 Low Growth Scenario Forecasts
Table 5 Reference Case Growth Scenario
Table 6 High Growth Case Scenario
Table 7 Global Algae Fats Revenue (USD Million) And CAGR (%) By Type (2021-2032)
Table 8 Global Algae Fats Revenue (USD Million) And CAGR (%) By Application (2021-2032)
Table 9 Global Algae Fats Revenue (USD Million) And CAGR (%) By Product (2021-2032)
Table 10 Global Algae Fats Market Revenue (USD Million) By Regions (2021-2032)
Table 11 Global Algae Fats Market Share (%) By Regions (2021-2032)
Table 12 North America Algae Fats Revenue (USD Million) By Country (2021-2032)
Table 13 Europe Algae Fats Revenue (USD Million) By Country (2021-2032)
Table 14 Asia Pacific Algae Fats Revenue (USD Million) By Country (2021-2032)
Table 15 South America Algae Fats Revenue (USD Million) By Country (2021-2032)
Table 16 Middle East and Africa Algae Fats Revenue (USD Million) By Region (2021-2032)
Table 17 North America Algae Fats Revenue (USD Million) By Type (2021-2032)
Table 18 North America Algae Fats Revenue (USD Million) By Application (2021-2032)
Table 19 North America Algae Fats Revenue (USD Million) By Product (2021-2032)
Table 20 Europe Algae Fats Revenue (USD Million) By Type (2021-2032)
Table 21 Europe Algae Fats Revenue (USD Million) By Application (2021-2032)
Table 22 Europe Algae Fats Revenue (USD Million) By Product (2021-2032)
Table 23 Asia Pacific Algae Fats Revenue (USD Million) By Type (2021-2032)
Table 24 Asia Pacific Algae Fats Revenue (USD Million) By Application (2021-2032)
Table 25 Asia Pacific Algae Fats Revenue (USD Million) By Product (2021-2032)
Table 26 South America Algae Fats Revenue (USD Million) By Type (2021-2032)
Table 27 South America Algae Fats Revenue (USD Million) By Application (2021-2032)
Table 28 South America Algae Fats Revenue (USD Million) By Product (2021-2032)
Table 29 Middle East and Africa Algae Fats Revenue (USD Million) By Type (2021-2032)
Table 30 Middle East and Africa Algae Fats Revenue (USD Million) By Application (2021-2032)
Table 31 Middle East and Africa Algae Fats Revenue (USD Million) By Product (2021-2032)
LIST OF FIGURES
Figure 1. Market Scope
Figure 2. Pricing Forecasts Per Unit, 2023- 2032
Figure 3. Porter’s Five Forces
Figure 4. Global Algae Fats Market Revenue (USD Million) By Regions (2021-2032)
Figure 5. Global Algae Fats Market Share (%) By Regions (2023)
Figure 6. North America Algae Fats Revenue (USD Million) By Country (2021-2032)
Figure 7. United States Algae Fats Revenue (USD Million) By Country (2021-2032)
Figure 8. Canada Algae Fats Revenue (USD Million) By Country (2021-2032)
Figure 9. Mexico Algae Fats Revenue (USD Million) By Country (2021-2032)
Figure 10. Europe Algae Fats Revenue (USD Million) By Country (2021-2032)
Figure 11. Germany Algae Fats Revenue (USD Million) By Country (2021-2032)
Figure 12. France Algae Fats Revenue (USD Million) By Country (2021-2032)
Figure 13. United Kingdom Algae Fats Revenue (USD Million) By Country (2021-2032)
Figure 14. Spain Algae Fats Revenue (USD Million) By Country (2021-2032)
Figure 15. Italy Algae Fats Revenue (USD Million) By Country (2021-2032)
Figure 16. Russia Algae Fats Revenue (USD Million) By Country (2021-2032)
Figure 17. Rest of Europe Algae Fats Revenue (USD Million) By Country (2021-2032)
Figure 11. Asia Pacific Algae Fats Revenue (USD Million) By Country (2021-2032)
Figure 12. China Algae Fats Revenue (USD Million) By Country (2021-2032)
Figure 13. Japan Algae Fats Revenue (USD Million) By Country (2021-2032)
Figure 14. India Algae Fats Revenue (USD Million) By Country (2021-2032)
Figure 15. South Korea Algae Fats Revenue (USD Million) By Country (2021-2032)
Figure 16. Australia Algae Fats Revenue (USD Million) By Country (2021-2032)
Figure 17. South East Asia Algae Fats Revenue (USD Million) By Country (2021-2032)
Figure 18. South America Algae Fats Revenue (USD Million) By Country (2021-2032)
Figure 19. Brazil Algae Fats Revenue (USD Million) By Country (2021-2032)
Figure 20. Argentina Algae Fats Revenue (USD Million) By Country (2021-2032)
Figure 21. Rest of Asia Pacific Algae Fats Revenue (USD Million) By Country (2021-2032)
Figure 22. Middle East and Africa Algae Fats Revenue (USD Million) By Region (2021-2032)
Figure 23. Saudi Arabia Algae Fats Revenue (USD Million) By Region (2021-2032)
Figure 24. The UAE Algae Fats Revenue (USD Million) By Region (2021-2032)
Figure 25. Rest of Middle East Algae Fats Revenue (USD Million) By Region (2021-2032)
Figure 26. South Africa Algae Fats Revenue (USD Million) By Region (2021-2032)
Figure 27. Africa Algae Fats Revenue (USD Million) By Region (2021-2032)
Figure 28. North America Algae Fats Revenue (USD Million) By Type (2021-2032)
Figure 29. North America Algae Fats Revenue (USD Million) By Application (2021-2032)
Figure 30. North America Algae Fats Revenue (USD Million) By Product (2021-2032)
Figure 31. Europe Algae Fats Revenue (USD Million) By Type (2021-2032)
Figure 32. Europe Algae Fats Revenue (USD Million) By Application (2021-2032)
Figure 33. Europe Algae Fats Revenue (USD Million) By Product (2021-2032)
Figure 34. Asia Pacific Algae Fats Revenue (USD Million) By Type (2021-2032)
Figure 35. Asia Pacific Algae Fats Revenue (USD Million) By Application (2021-2032)
Figure 36. Asia Pacific Algae Fats Revenue (USD Million) By Product (2021-2032)
Figure 37. South America Algae Fats Revenue (USD Million) By Type (2021-2032)
Figure 38. South America Algae Fats Revenue (USD Million) By Application (2021-2032)
Figure 39. South America Algae Fats Revenue (USD Million) By Product (2021-2032)
Figure 40. Middle East and Africa Algae Fats Revenue (USD Million) By Type (2021-2032)
Figure 41. Middle East and Africa Algae Fats Revenue (USD Million) By Application (2021-2032)
Figure 42. Middle East and Africa Algae Fats Revenue (USD Million) By Product (2021-2032)
By Type
Food Grade
Feed Grade
By End-User
Biofuel
Dietary Supplement
Animal Feed
Others
Countries Analyzed
North America (US, Canada, Mexico)
Europe (Germany, UK, France, Spain, Italy, Russia, Rest of Europe)
Asia Pacific (China, India, Japan, South Korea, Australia, South East Asia, Rest of Asia)
South America (Brazil, Argentina, Rest of South America)
Middle East and Africa (Saudi Arabia, UAE, Rest of Middle East, South Africa, Egypt, Rest of Africa)
