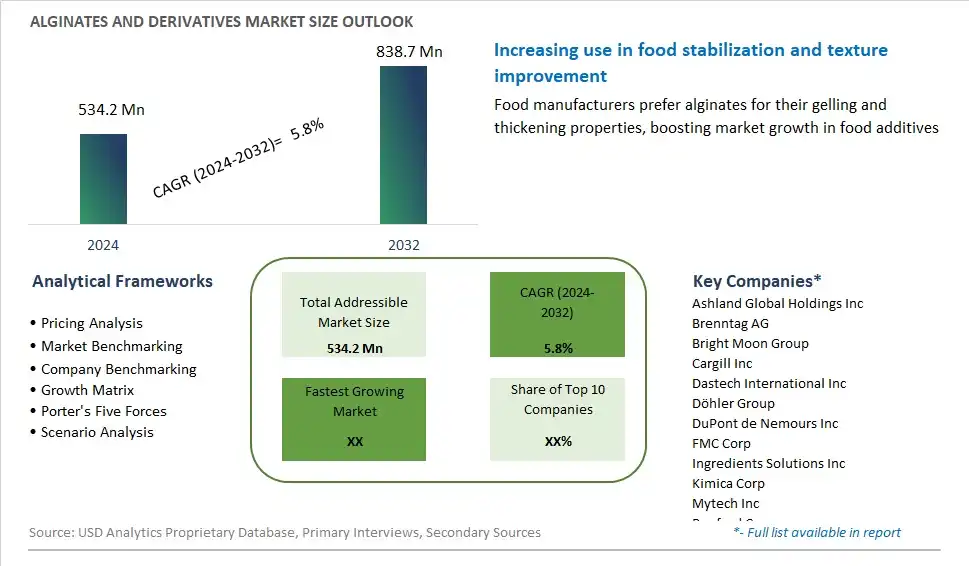
Global Alginates and Derivatives Market Size is valued at $534.2 Million in 2024 and is forecast to register a growth rate (CAGR) of 5.8% to reach $838.7 Million by 2032.
The global Alginates and Derivatives Market Comprehensive Study analyzes and forecasts the market size across 6 regions and 24 countries for diverse segments -By Type (Sodium Alginate, Calcium Alginate, Potassium Alginate, PGA, Others), By Application (Food & Beverages, Industrial, Pharmaceuticals, Others), By Form (Powder, Liquid, Gel form)
An Introduction to Alginates and Derivatives Market
Alginates and their derivatives are versatile ingredients widely used in the food, pharmaceutical, and cosmetic industries for their gelling, thickening, and stabilizing properties. In 2024, alginates derived from seaweed species such as brown algae are valued for their natural origin, safety, and functionality in a variety of applications. From improving texture and mouthfeel in food products to enhancing drug delivery and wound healing in pharmaceuticals and medical devices, alginates offer unique benefits across multiple sectors. With growing interest in clean-label ingredients and sustainable sourcing, alginates are gaining popularity as natural alternatives to synthetic additives and stabilizers. As research continues to uncover the potential health benefits of alginates, including their role in gut health and weight management, the market for alginates and derivatives is expected to expand, driven by demand from food manufacturers, healthcare providers, and consumers seeking safe, effective, and environmentally friendly solutions.
Alginates and Derivatives Competitive Landscape
The market report analyses the leading companies in the industry including Ashland Global Holdings Inc, Brenntag AG, Bright Moon Group, Cargill Inc, Dastech International Inc, Döhler Group, DuPont de Nemours Inc, FMC Corp, Ingredients Solutions Inc, Kimica Corp, Mytech Inc, Penford Corp, Qingdao Gfuri, Shandong Jiejing Group Corp, Snap Natural & Alginate Products Pvt. Ltd, SNP Inc, The Dow Chemical Company, and Others.
Alginates and Derivatives Market Dynamics
Alginates and Derivatives Market Trend: Growing Demand for Natural and Sustainable Ingredients
A significant trend in the alginates and derivatives market is the growing demand for natural and sustainable ingredients across various industries. Alginates, derived from brown seaweeds, are valued for their unique properties such as gelling, thickening, and stabilizing, making them versatile additives in food, pharmaceuticals, cosmetics, and other industrial applications. This trend is driven by increasing consumer awareness of environmental sustainability and health consciousness, prompting manufacturers to seek natural alternatives to synthetic additives and chemicals. Alginates and their derivatives are perceived as environmentally friendly and renewable ingredients, aligning with the growing preference for clean label products and sustainable sourcing practices. Additionally, the multifunctional properties of alginates make them attractive ingredients for product formulations aimed at meeting consumer demand for natural, plant-based, and minimally processed products.
Market Driver: Expansion of Food and Beverage Industry Applications
A significant driver propelling the growth of the alginates and derivatives market is the expansion of applications within the food and beverage industry. Alginates are widely used as thickening agents, stabilizers, and gelling agents in a variety of food and beverage products, including dairy, bakery, confectionery, sauces, dressings, and meat products. The versatility and functionality of alginates make them essential ingredients for improving texture, viscosity, mouthfeel, and shelf stability in processed foods. Additionally, alginates are valued for their ability to enhance product quality, extend shelf life, and facilitate the production of innovative food formulations such as vegan alternatives, reduced-fat products, and clean label formulations. As consumer demand for convenience, quality, and sensory experiences continues to drive innovation in the food and beverage industry, the demand for alginates and derivatives is expected to grow, creating opportunities for market expansion and product development.
Market Opportunity: Innovation in Pharmaceutical and Biomedical Applications
An opportunity within the alginates and derivatives market lies in innovation in pharmaceutical and biomedical applications to leverage the unique properties of alginates for medical and healthcare purposes. Alginates have been recognized for their biocompatibility, biodegradability, and mucoadhesive properties, making them valuable materials for drug delivery systems, wound care products, tissue engineering scaffolds, and regenerative medicine applications. By further exploring the potential of alginates in pharmaceutical formulations and biomedical technologies, manufacturers can develop novel drug delivery platforms, wound dressings, and tissue scaffolds that offer enhanced therapeutic efficacy, improved patient outcomes, and reduced side effects. Additionally, there's potential for collaboration with research institutions, healthcare providers, and biomedical companies to explore new applications and technologies leveraging alginates and their derivatives for addressing unmet medical needs and advancing healthcare innovation. By expanding into pharmaceutical and biomedical sectors, alginates and derivatives manufacturers can diversify their product portfolios, tap into new market opportunities, and contribute to advancements in medical science and healthcare delivery.
Alginates and Derivatives Market Share Analysis: Sodium Alginate held the dominant market share in 2024
Sodium alginate is the largest segment in the alginates and derivatives market, driven by its extensive applications across various industries and its superior properties. As a versatile and highly functional ingredient, sodium alginate is widely used in the food and beverage industry as a thickening, gelling, and stabilizing agent. Its ability to improve texture, enhance mouthfeel, and maintain product consistency makes it invaluable in products such as ice creams, sauces, and dressings. Beyond food applications, sodium alginate plays a critical role in the pharmaceutical industry, where it is utilized for controlled-release drug formulations and wound dressings due to its biocompatibility and non-toxic nature. Additionally, the textile industry leverages sodium alginate as a reactive dye thickener, contributing to high-quality fabric finishes. The growing demand for natural and clean-label ingredients has further propelled its use, as sodium alginate is derived from seaweed and aligns with consumer preferences for sustainable and natural additives. Its multifunctionality, coupled with increasing applications in emerging sectors such as bioprinting and encapsulation technology, ensures that sodium alginate will continue to dominate the alginates and derivatives market, fostering innovation and growth.
Alginates and Derivatives Market Share Analysis: Pharmaceuticals market is poised to register the fastest growth rae over the forecast period to 2032
The pharmaceuticals segment is the fastest growing in the alginates and derivatives market, fueled by the increasing demand for natural and effective excipients in drug formulation and delivery systems. Alginates, particularly sodium alginate, are extensively utilized in the pharmaceutical industry due to their biocompatibility, non-toxic nature, and versatile functional properties. These polysaccharides are crucial in controlled-release formulations, where they help modulate the release rate of active pharmaceutical ingredients (APIs), enhancing drug efficacy and patient compliance. Additionally, alginates are used in wound care products for their excellent moisture retention and hemostatic properties, promoting faster healing and reducing infection risks. The growing focus on developing bio-based and sustainable pharmaceutical products further drives the adoption of alginates, as they are derived from renewable seaweed sources. Innovations in drug delivery technologies, such as alginate-based hydrogels and microspheres, are expanding their application scope, providing targeted and efficient drug delivery solutions. As the pharmaceutical industry continues to prioritize natural and effective ingredients, the demand for alginates is set to rise, making the pharmaceuticals segment a key driver of growth in the alginates and derivatives market.
Alginates and Derivatives Market Share Analysis: Powder Form held the dominant market share in 2024
The powder form is the largest segment in the alginates and derivatives market, driven by its versatility, ease of handling, and broad range of applications across various industries. Powdered alginates are highly favored in the food and beverage sector for their superior thickening, gelling, and stabilizing properties, making them essential ingredients in products like ice creams, jellies, and sauces. Their ability to dissolve quickly and uniformly enhances product texture and consistency, crucial for maintaining quality in food production. In the pharmaceutical industry, powdered alginates are integral to creating controlled-release formulations and wound care products, offering precise dosing and effective therapeutic benefits. The industrial sector also benefits from powdered alginates, utilizing them in textile printing, paper manufacturing, and water treatment processes due to their excellent binding and viscosifying capabilities. The powdered form's stability and extended shelf life further contribute to its dominance, ensuring long-term storage and consistent performance. As industries continue to seek reliable, efficient, and versatile ingredients, the demand for powdered alginates is expected to remain robust, cementing its position as the largest segment in the alginates and derivatives market.
Alginates and Derivatives Market Segmentation
By Type
Sodium Alginate
Calcium Alginate
Potassium Alginate
PGA
Others
By Application
Food & Beverages
Industrial
Pharmaceuticals
Others
By Form
Powder
Liquid
Gel form
Countries Analyzed
North America (US, Canada, Mexico)
Europe (Germany, UK, France, Spain, Italy, Russia, Rest of Europe)
Asia Pacific (China, India, Japan, South Korea, Australia, South East Asia, Rest of Asia)
South America (Brazil, Argentina, Rest of South America)
Middle East and Africa (Saudi Arabia, UAE, Rest of Middle East, South Africa, Egypt, Rest of Africa)
Alginates and Derivatives Companies Profiled in the Study
Ashland Global Holdings Inc
Brenntag AG
Bright Moon Group
Cargill Inc
Dastech International Inc
Döhler Group
DuPont de Nemours Inc
FMC Corp
Ingredients Solutions Inc
Kimica Corp
Mytech Inc
Penford Corp
Qingdao Gfuri
Shandong Jiejing Group Corp
Snap Natural & Alginate Products Pvt. Ltd
SNP Inc
The Dow Chemical Company
*- List Not Exhaustive
Chapter 1. TABLE OF CONTENTS
Chapter 2. Introduction to Alginates and Derivatives Market
2.1. Market Overview
2.2. Key Statistics and Report Highlights
2.3. Scope of the Comprehensive Study
2.3.1. Market Definition
2.3.2 Countries and Regions Covered
2.3.3 Research Objective
2.3.4 Units, Currency, and Conversions
2.3.5 Industry Value Chain
2.4. Key Market Segments
2.5. Key Companies
2.6. Study Period
Chapter 3. Strategic Analysis Review
3.1. Alginates and Derivatives Pricing Analysis and Forecast
3.2. Porter’s Five Forces
3.3. Market Ecosystem
3.4. SWOT Analysis
3.5. Regulatory Scenario
3.3. Effects of Inflation, Russia-Ukraine War, moderating economic growth, and other macroeconomic factors
Chapter 4. Competitive Landscape
4.1. Market Share Analysis
4.1.1. Global Alginates and Derivatives Market Share by Company, 2023
4.1.2. Product Offerings of Leading Alginates and Derivatives Companies
4.2. Market Entropy
4.2.1. New Product Launches in the Industry
4.2.2. Mergers, Acquisitions, Joint ventures, and Partnerships
4.3. Key Strategies and Best Practices
Chapter 5. Global Market Projections: Best, Reference, and Low Case Scenarios
5.1. Growth Analysis- Case Scenario Definitions
5.2. Low Growth Case Scenario Forecasts
5.3. Reference Growth Case Scenario Forecasts
5.4. High Growth Case Scenario Forecasts
Chapter 6. Market Dynamics
6.1. Alginates and Derivatives Market Drivers
6.2. Alginates and Derivatives Market Challenges
6.6. Alginates and Derivatives Market Opportunities
6.4. Alginates and Derivatives Market Trends
Chapter 7. Global Alginates and Derivatives Market Outlook Trends
7.1. Global Alginates and Derivatives Revenue (USD Million) and CAGR (%) by Type (2021-2032)
7.2. Global Alginates and Derivatives Revenue (USD Million) and CAGR (%) by Application (2021-2032)
7.3. Global Alginates and Derivatives Revenue (USD Million) and CAGR (%) by Product (2021-2032)
By Type
Sodium Alginate
Calcium Alginate
Potassium Alginate
PGA
Others
By Application
Food & Beverages
Industrial
Pharmaceuticals
Others
By Form
Powder
Liquid
Gel form
Chapter 8. Global Alginates and Derivatives Regional Analysis and Outlook
8.1. Global Alginates and Derivatives Revenue (USD Million) By Regions (2021- 2032)
8.2. North America Alginates and Derivatives Revenue (USD Million) by Country (2021-2032)
8.2.1. United States Alginates and Derivatives Regional Analysis and Outlook
8.2.2. Canada Alginates and Derivatives Regional Analysis and Outlook
8.2.3. Mexico Alginates and Derivatives Regional Analysis and Outlook
8.3. Europe Alginates and Derivatives Revenue (USD Million), by Country (2021-2032)
8.3.1. Germany Alginates and Derivatives Regional Analysis and Outlook
8.3.2. France Alginates and Derivatives Regional Analysis and Outlook
8.3.3. United Kingdom Alginates and Derivatives Regional Analysis and Outlook
8.3.4. Spain Alginates and Derivatives Regional Analysis and Outlook
8.3.5. Italy Alginates and Derivatives Regional Analysis and Outlook
8.3.6. Russia Alginates and Derivatives Regional Analysis and Outlook
8.3.7. Rest of Europe Alginates and Derivatives Regional Analysis and Outlook
8.4. Asia Pacific Alginates and Derivatives Revenue (USD Million) by Country (2021-2032)
8.4.1. China Alginates and Derivatives Regional Analysis and Outlook
8.4.2. Japan Alginates and Derivatives Regional Analysis and Outlook
8.4.3. India Alginates and Derivatives Regional Analysis and Outlook
8.4.4. South Korea Alginates and Derivatives Regional Analysis and Outlook
8.4.5. Australia Alginates and Derivatives Regional Analysis and Outlook
8.4.6. South East Asia Alginates and Derivatives Regional Analysis and Outlook
8.4.7. Rest of Asia Pacific Alginates and Derivatives Regional Analysis and Outlook
8.5. South America Alginates and Derivatives Revenue (USD Million), by Country (2021-2032)
8.5.1. Brazil Alginates and Derivatives Regional Analysis and Outlook
8.5.2. Argentina Alginates and Derivatives Regional Analysis and Outlook
8.5.3. Rest of South America Alginates and Derivatives Regional Analysis and Outlook
8.6. Middle East and Africa Alginates and Derivatives Revenue (USD Million) by Country (2021-2032)
8.6.1. Middle East Alginates and Derivatives Regional Analysis and Outlook
8.6.2. Africa Alginates and Derivatives Regional Analysis and Outlook
Chapter 9. North America Alginates and Derivatives Analysis and Outlook
9.1. North America Alginates and Derivatives Revenue (USD Million) by Segments (2021-2032)
9.1.1. North America Alginates and Derivatives Revenue (USD Million) by Type (2021-2032)
9.1.2. North America Alginates and Derivatives Revenue (USD Million) by Application (2021-2032)
9.1.3. North America Alginates and Derivatives Revenue (USD Million) by Product (2021-2032)
By Type
Sodium Alginate
Calcium Alginate
Potassium Alginate
PGA
Others
By Application
Food & Beverages
Industrial
Pharmaceuticals
Others
By Form
Powder
Liquid
Gel form
Chapter 10. Europe Alginates and Derivatives Analysis and Outlook
10.1. Europe Alginates and Derivatives Revenue (USD Million), by Segments (USD Million) (2021-2032)
10.1.1. Europe Alginates and Derivatives Revenue (USD Million) by Type (2021-2032)
10.1.2. Europe Alginates and Derivatives Revenue (USD Million) by Application (2021-2032)
10.1.3. Europe Alginates and Derivatives Revenue (USD Million) by Product (2021-2032)
By Type
Sodium Alginate
Calcium Alginate
Potassium Alginate
PGA
Others
By Application
Food & Beverages
Industrial
Pharmaceuticals
Others
By Form
Powder
Liquid
Gel form
Chapter 11. Asia Pacific Alginates and Derivatives Analysis and Outlook
11.1. Asia Pacific Alginates and Derivatives Revenue (USD Million), and Revenue (USD Million) by Segments (2021-2032)
11.1.1. Asia Pacific Alginates and Derivatives Revenue (USD Million) by Type (2021-2032)
11.1.2. Asia Pacific Alginates and Derivatives Revenue (USD Million) by Application (2021-2032)
11.1.3. Asia Pacific Alginates and Derivatives Revenue (USD Million) by Product (2021-2032)
By Type
Sodium Alginate
Calcium Alginate
Potassium Alginate
PGA
Others
By Application
Food & Beverages
Industrial
Pharmaceuticals
Others
By Form
Powder
Liquid
Gel form
Chapter 12. South America Alginates and Derivatives Analysis and Outlook
12.1. South America Alginates and Derivatives Revenue (USD Million), by Segments (2021-2032)
12.1.1. South America Alginates and Derivatives Revenue (USD Million) by Type (2021-2032)
12.1.2. South America Alginates and Derivatives Revenue (USD Million) by Application (2021-2032)
12.1.3. South America Alginates and Derivatives Revenue (USD Million) by Product (2021-2032)
By Type
Sodium Alginate
Calcium Alginate
Potassium Alginate
PGA
Others
By Application
Food & Beverages
Industrial
Pharmaceuticals
Others
By Form
Powder
Liquid
Gel form
Chapter 13. Middle East and Africa Alginates and Derivatives Analysis and Outlook
13.1. Middle East and Africa Alginates and Derivatives Revenue (USD Million), by Segments (2021-2032)
13.1.1. Middle East and Africa Alginates and Derivatives Revenue (USD Million) by Type (2021-2032)
13.1.2. Middle East and Africa Alginates and Derivatives Revenue (USD Million) by Application (2021-2032)
13.1.3. Middle East and Africa Alginates and Derivatives Revenue (USD Million) by Product (2021-2032)
By Type
Sodium Alginate
Calcium Alginate
Potassium Alginate
PGA
Others
By Application
Food & Beverages
Industrial
Pharmaceuticals
Others
By Form
Powder
Liquid
Gel form
Chapter 14. Alginates and Derivatives Company Profiles
14.1 Business Overview
14.2 Product Profiles
14.3 SWOT Profiles
14.5 Recent Developments
14.6 Financial Profile
List of Companies
Ashland Global Holdings Inc
Brenntag AG
Bright Moon Group
Cargill Inc
Dastech International Inc
Döhler Group
DuPont de Nemours Inc
FMC Corp
Ingredients Solutions Inc
Kimica Corp
Mytech Inc
Penford Corp
Qingdao Gfuri
Shandong Jiejing Group Corp
Snap Natural & Alginate Products Pvt. Ltd
SNP Inc
The Dow Chemical Company
15. Methodology and Data Sources
15.1 Customization Offerings
15.2 Subscription Services
15.3 Related Reports
15.4 Publisher Expertise
LIST OF TABLES
Table 1 Market Segmentation Analysis
Table 2 Global Alginates and Derivatives Market Share of Leading Companies, 2023
Table 3 Product Offerings of Leading Companies
Table 4 Low Growth Scenario Forecasts
Table 5 Reference Case Growth Scenario
Table 6 High Growth Case Scenario
Table 7 Global Alginates and Derivatives Revenue (USD Million) And CAGR (%) By Type (2021-2032)
Table 8 Global Alginates and Derivatives Revenue (USD Million) And CAGR (%) By Application (2021-2032)
Table 9 Global Alginates and Derivatives Revenue (USD Million) And CAGR (%) By Product (2021-2032)
Table 10 Global Alginates and Derivatives Market Revenue (USD Million) By Regions (2021-2032)
Table 11 Global Alginates and Derivatives Market Share (%) By Regions (2021-2032)
Table 12 North America Alginates and Derivatives Revenue (USD Million) By Country (2021-2032)
Table 13 Europe Alginates and Derivatives Revenue (USD Million) By Country (2021-2032)
Table 14 Asia Pacific Alginates and Derivatives Revenue (USD Million) By Country (2021-2032)
Table 15 South America Alginates and Derivatives Revenue (USD Million) By Country (2021-2032)
Table 16 Middle East and Africa Alginates and Derivatives Revenue (USD Million) By Region (2021-2032)
Table 17 North America Alginates and Derivatives Revenue (USD Million) By Type (2021-2032)
Table 18 North America Alginates and Derivatives Revenue (USD Million) By Application (2021-2032)
Table 19 North America Alginates and Derivatives Revenue (USD Million) By Product (2021-2032)
Table 20 Europe Alginates and Derivatives Revenue (USD Million) By Type (2021-2032)
Table 21 Europe Alginates and Derivatives Revenue (USD Million) By Application (2021-2032)
Table 22 Europe Alginates and Derivatives Revenue (USD Million) By Product (2021-2032)
Table 23 Asia Pacific Alginates and Derivatives Revenue (USD Million) By Type (2021-2032)
Table 24 Asia Pacific Alginates and Derivatives Revenue (USD Million) By Application (2021-2032)
Table 25 Asia Pacific Alginates and Derivatives Revenue (USD Million) By Product (2021-2032)
Table 26 South America Alginates and Derivatives Revenue (USD Million) By Type (2021-2032)
Table 27 South America Alginates and Derivatives Revenue (USD Million) By Application (2021-2032)
Table 28 South America Alginates and Derivatives Revenue (USD Million) By Product (2021-2032)
Table 29 Middle East and Africa Alginates and Derivatives Revenue (USD Million) By Type (2021-2032)
Table 30 Middle East and Africa Alginates and Derivatives Revenue (USD Million) By Application (2021-2032)
Table 31 Middle East and Africa Alginates and Derivatives Revenue (USD Million) By Product (2021-2032)
LIST OF FIGURES
Figure 1. Market Scope
Figure 2. Pricing Forecasts Per Unit, 2023- 2032
Figure 3. Porter’s Five Forces
Figure 4. Global Alginates and Derivatives Market Revenue (USD Million) By Regions (2021-2032)
Figure 5. Global Alginates and Derivatives Market Share (%) By Regions (2023)
Figure 6. North America Alginates and Derivatives Revenue (USD Million) By Country (2021-2032)
Figure 7. United States Alginates and Derivatives Revenue (USD Million) By Country (2021-2032)
Figure 8. Canada Alginates and Derivatives Revenue (USD Million) By Country (2021-2032)
Figure 9. Mexico Alginates and Derivatives Revenue (USD Million) By Country (2021-2032)
Figure 10. Europe Alginates and Derivatives Revenue (USD Million) By Country (2021-2032)
Figure 11. Germany Alginates and Derivatives Revenue (USD Million) By Country (2021-2032)
Figure 12. France Alginates and Derivatives Revenue (USD Million) By Country (2021-2032)
Figure 13. United Kingdom Alginates and Derivatives Revenue (USD Million) By Country (2021-2032)
Figure 14. Spain Alginates and Derivatives Revenue (USD Million) By Country (2021-2032)
Figure 15. Italy Alginates and Derivatives Revenue (USD Million) By Country (2021-2032)
Figure 16. Russia Alginates and Derivatives Revenue (USD Million) By Country (2021-2032)
Figure 17. Rest of Europe Alginates and Derivatives Revenue (USD Million) By Country (2021-2032)
Figure 11. Asia Pacific Alginates and Derivatives Revenue (USD Million) By Country (2021-2032)
Figure 12. China Alginates and Derivatives Revenue (USD Million) By Country (2021-2032)
Figure 13. Japan Alginates and Derivatives Revenue (USD Million) By Country (2021-2032)
Figure 14. India Alginates and Derivatives Revenue (USD Million) By Country (2021-2032)
Figure 15. South Korea Alginates and Derivatives Revenue (USD Million) By Country (2021-2032)
Figure 16. Australia Alginates and Derivatives Revenue (USD Million) By Country (2021-2032)
Figure 17. South East Asia Alginates and Derivatives Revenue (USD Million) By Country (2021-2032)
Figure 18. South America Alginates and Derivatives Revenue (USD Million) By Country (2021-2032)
Figure 19. Brazil Alginates and Derivatives Revenue (USD Million) By Country (2021-2032)
Figure 20. Argentina Alginates and Derivatives Revenue (USD Million) By Country (2021-2032)
Figure 21. Rest of Asia Pacific Alginates and Derivatives Revenue (USD Million) By Country (2021-2032)
Figure 22. Middle East and Africa Alginates and Derivatives Revenue (USD Million) By Region (2021-2032)
Figure 23. Saudi Arabia Alginates and Derivatives Revenue (USD Million) By Region (2021-2032)
Figure 24. The UAE Alginates and Derivatives Revenue (USD Million) By Region (2021-2032)
Figure 25. Rest of Middle East Alginates and Derivatives Revenue (USD Million) By Region (2021-2032)
Figure 26. South Africa Alginates and Derivatives Revenue (USD Million) By Region (2021-2032)
Figure 27. Africa Alginates and Derivatives Revenue (USD Million) By Region (2021-2032)
Figure 28. North America Alginates and Derivatives Revenue (USD Million) By Type (2021-2032)
Figure 29. North America Alginates and Derivatives Revenue (USD Million) By Application (2021-2032)
Figure 30. North America Alginates and Derivatives Revenue (USD Million) By Product (2021-2032)
Figure 31. Europe Alginates and Derivatives Revenue (USD Million) By Type (2021-2032)
Figure 32. Europe Alginates and Derivatives Revenue (USD Million) By Application (2021-2032)
Figure 33. Europe Alginates and Derivatives Revenue (USD Million) By Product (2021-2032)
Figure 34. Asia Pacific Alginates and Derivatives Revenue (USD Million) By Type (2021-2032)
Figure 35. Asia Pacific Alginates and Derivatives Revenue (USD Million) By Application (2021-2032)
Figure 36. Asia Pacific Alginates and Derivatives Revenue (USD Million) By Product (2021-2032)
Figure 37. South America Alginates and Derivatives Revenue (USD Million) By Type (2021-2032)
Figure 38. South America Alginates and Derivatives Revenue (USD Million) By Application (2021-2032)
Figure 39. South America Alginates and Derivatives Revenue (USD Million) By Product (2021-2032)
Figure 40. Middle East and Africa Alginates and Derivatives Revenue (USD Million) By Type (2021-2032)
Figure 41. Middle East and Africa Alginates and Derivatives Revenue (USD Million) By Application (2021-2032)
Figure 42. Middle East and Africa Alginates and Derivatives Revenue (USD Million) By Product (2021-2032)
By Type
Sodium Alginate
Calcium Alginate
Potassium Alginate
PGA
Others
By Application
Food & Beverages
Industrial
Pharmaceuticals
Others
By Form
Powder
Liquid
Gel form
Countries Analyzed
North America (US, Canada, Mexico)
Europe (Germany, UK, France, Spain, Italy, Russia, Rest of Europe)
Asia Pacific (China, India, Japan, South Korea, Australia, South East Asia, Rest of Asia)
South America (Brazil, Argentina, Rest of South America)
Middle East and Africa (Saudi Arabia, UAE, Rest of Middle East, South Africa, Egypt, Rest of Africa)
