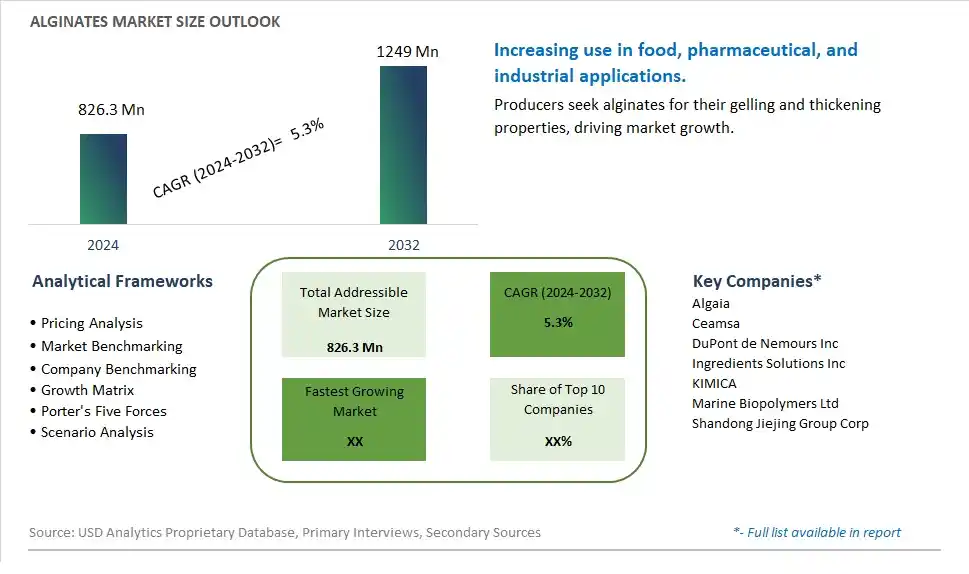
Global Alginates Market Size is valued at $826.3 Million in 2024 and is forecast to register a growth rate (CAGR) of 5.3% to reach $1249 Million by 2032.
The global Alginates Market Comprehensive Study analyzes and forecasts the market size across 6 regions and 24 countries for diverse segments -By Type (High M, High G), By Product (Sodium, Calcium, Potassium, Propylene Glycol, Others), By Application (Food and Beverages, -Bakery, -Confectionery, -Meat Products, -Dairy Products, -Sauces & Dressings, -Beverages, -Others, Pharmaceutical, Industrial, Others)
An Introduction to Alginates Market
In 2024, the Alginates market is thriving, fueled by its extensive applications in the food, pharmaceutical, and biotechnology industries. Alginates, derived from brown seaweed, are valued for their gelling, thickening, and stabilizing properties. They are widely used in food products such as ice cream, sauces, and dairy items, as well as in wound care dressings and drug delivery systems. The market is supported by the growing demand for natural and plant-based ingredients. Advances in extraction and refinement processes are enhancing the functionality and purity of alginates, driving their adoption across various sectors.
Alginates Competitive Landscape
The market report analyses the leading companies in the industry including Algaia, Ceamsa, DuPont de Nemours Inc, Ingredients Solutions Inc, KIMICA, Marine Biopolymers Ltd, Shandong Jiejing Group Corp, and Others.
Alginates Market Dynamics
Alginates Market Trend: Increased Demand for Natural and Biodegradable Materials in Packaging
The most prominent market trend for Alginates is the rising demand for natural and biodegradable materials in packaging solutions. With growing environmental concerns and regulations aimed at reducing plastic waste, there's a notable shift towards eco-friendly alternatives. Alginates, derived from seaweed, are biodegradable, renewable, and have excellent barrier properties, making them a preferred choice for sustainable packaging in industries such as food, pharmaceuticals, and cosmetics.
Alginates Market Driver: Sustainable Packaging Initiatives and Regulations
A significant market driver for Alginates is the increasing emphasis on sustainable packaging initiatives and regulatory mandates. Governments, businesses, and consumers are pushing for environmentally responsible packaging solutions to minimize plastic pollution and carbon footprint. Alginates, being natural polymers with biodegradability and low environmental impact, are gaining traction as a viable alternative to conventional plastic packaging, thus driving the demand for Alginates in the packaging industry.
Alginates Market Opportunity: Expansion into Biomedical and Pharmaceutical Applications
An exciting market opportunity for Alginates lies in their expansion into biomedical and pharmaceutical applications. Beyond packaging, alginates possess unique properties such as biocompatibility, gel-forming ability, and controlled-release characteristics, making them suitable for use in wound dressings, drug delivery systems, and tissue engineering. Collaborating with healthcare institutions and pharmaceutical companies to develop innovative biomedical products leveraging alginates' properties can unlock new avenues for market growth and diversification, catering to the evolving needs of the healthcare sector for advanced biomaterials.
Alginates Market Share Analysis: High G segment generated the highest revenue share in the industry
The High G (guluronic acid) segment is the largest in the Alginates Market by type. High G alginates are preferred for their excellent gelforming properties, which are highly valued in various industrial and food applications. These alginates create stronger and more heatstable gels compared to High M (mannuronic acid) alginates, making them ideal for use in products that require a firm structure, such as gels and films. The demand for high G alginates is particularly strong in the food and beverage industry, where they are used to improve texture, stabilize emulsions, and enhance the mouthfeel of products. Their widespread use in pharmaceuticals and industrial applications further contributes to their dominance in the market.
Alginates Market Share Analysis: Sodium is the fastest growing segment over the forecast period to 2032
The Sodium segment within the Alginates Market is projected to be the fastest growing segment by 2032. This rapid growth is driven by the versatile applications of sodium alginate in various industries, including food and beverages, pharmaceuticals, and textiles. Sodium alginate is widely used as a thickening agent, gelling agent, and stabilizer in food products, such as ice cream, yogurt, and dressings. In pharmaceuticals, it is used in wound dressings, dental impressions, and controlledrelease medications. The textile industry employs sodium alginate for reactive dye printing, owing to its excellent filmforming and viscosity properties. As the demand for natural and multifunctional ingredients continues to rise across these industries, the sodium alginate segment is expected to experience significant growth, making it the fastest growing product category through 2032.
Alginates Market Share Analysis: Food and Beverages segment generated the highest revenue share in the industry
The Food and Beverages segment is the largest in the Alginates Market by application. Within this segment, alginates are extensively used in various subapplications, including bakery, confectionery, meat products, dairy products, sauces & dressings, and beverages. Alginates serve as thickeners, stabilizers, and gelling agents, enhancing the texture, consistency, and shelflife of food products. In the bakery industry, alginates are used to improve dough elasticity and moisture retention. In confectionery, they provide a desirable chewiness and stability to gummy candies and marshmallows. The dairy industry utilizes alginates to prevent whey separation and improve the mouthfeel of products like yogurt and cheese. Their application in sauces and dressings ensures uniform consistency and prevents phase separation, while in beverages, alginates stabilize suspensions and add viscosity. The widespread use and multifunctionality of alginates in the food and beverage industry solidify this segment's leading position in the market.
Alginates Market Segmentation
By Type
High M
High G
By Product
Sodium
Calcium
Potassium
Propylene Glycol
Others
By Application
Food and Beverages
-Bakery
-Confectionery
-Meat Products
-Dairy Products
-Sauces & Dressings
-Beverages
-Others
Pharmaceutical
Industrial
Others
Countries Analyzed
North America (US, Canada, Mexico)
Europe (Germany, UK, France, Spain, Italy, Russia, Rest of Europe)
Asia Pacific (China, India, Japan, South Korea, Australia, South East Asia, Rest of Asia)
South America (Brazil, Argentina, Rest of South America)
Middle East and Africa (Saudi Arabia, UAE, Rest of Middle East, South Africa, Egypt, Rest of Africa)
Alginates Companies Profiled in the Study
Algaia
Ceamsa
DuPont de Nemours Inc
Ingredients Solutions Inc
KIMICA
Marine Biopolymers Ltd
Shandong Jiejing Group Corp
*- List Not Exhaustive
Chapter 1. TABLE OF CONTENTS
Chapter 2. Introduction to Alginates Market
2.1. Market Overview
2.2. Key Statistics and Report Highlights
2.3. Scope of the Comprehensive Study
2.3.1. Market Definition
2.3.2 Countries and Regions Covered
2.3.3 Research Objective
2.3.4 Units, Currency, and Conversions
2.3.5 Industry Value Chain
2.4. Key Market Segments
2.5. Key Companies
2.6. Study Period
Chapter 3. Strategic Analysis Review
3.1. Alginates Pricing Analysis and Forecast
3.2. Porter’s Five Forces
3.3. Market Ecosystem
3.4. SWOT Analysis
3.5. Regulatory Scenario
3.3. Effects of Inflation, Russia-Ukraine War, moderating economic growth, and other macroeconomic factors
Chapter 4. Competitive Landscape
4.1. Market Share Analysis
4.1.1. Global Alginates Market Share by Company, 2023
4.1.2. Product Offerings of Leading Alginates Companies
4.2. Market Entropy
4.2.1. New Product Launches in the Industry
4.2.2. Mergers, Acquisitions, Joint ventures, and Partnerships
4.3. Key Strategies and Best Practices
Chapter 5. Global Market Projections: Best, Reference, and Low Case Scenarios
5.1. Growth Analysis- Case Scenario Definitions
5.2. Low Growth Case Scenario Forecasts
5.3. Reference Growth Case Scenario Forecasts
5.4. High Growth Case Scenario Forecasts
Chapter 6. Market Dynamics
6.1. Alginates Market Drivers
6.2. Alginates Market Challenges
6.6. Alginates Market Opportunities
6.4. Alginates Market Trends
Chapter 7. Global Alginates Market Outlook Trends
7.1. Global Alginates Revenue (USD Million) and CAGR (%) by Type (2021-2032)
7.2. Global Alginates Revenue (USD Million) and CAGR (%) by Application (2021-2032)
7.3. Global Alginates Revenue (USD Million) and CAGR (%) by Product (2021-2032)
By Type
High M
High G
By Product
Sodium
Calcium
Potassium
Propylene Glycol
Others
By Application
Food and Beverages
-Bakery
-Confectionery
-Meat Products
-Dairy Products
-Sauces & Dressings
-Beverages
-Others
Pharmaceutical
Industrial
Others
Chapter 8. Global Alginates Regional Analysis and Outlook
8.1. Global Alginates Revenue (USD Million) By Regions (2021- 2032)
8.2. North America Alginates Revenue (USD Million) by Country (2021-2032)
8.2.1. United States Alginates Regional Analysis and Outlook
8.2.2. Canada Alginates Regional Analysis and Outlook
8.2.3. Mexico Alginates Regional Analysis and Outlook
8.3. Europe Alginates Revenue (USD Million), by Country (2021-2032)
8.3.1. Germany Alginates Regional Analysis and Outlook
8.3.2. France Alginates Regional Analysis and Outlook
8.3.3. United Kingdom Alginates Regional Analysis and Outlook
8.3.4. Spain Alginates Regional Analysis and Outlook
8.3.5. Italy Alginates Regional Analysis and Outlook
8.3.6. Russia Alginates Regional Analysis and Outlook
8.3.7. Rest of Europe Alginates Regional Analysis and Outlook
8.4. Asia Pacific Alginates Revenue (USD Million) by Country (2021-2032)
8.4.1. China Alginates Regional Analysis and Outlook
8.4.2. Japan Alginates Regional Analysis and Outlook
8.4.3. India Alginates Regional Analysis and Outlook
8.4.4. South Korea Alginates Regional Analysis and Outlook
8.4.5. Australia Alginates Regional Analysis and Outlook
8.4.6. South East Asia Alginates Regional Analysis and Outlook
8.4.7. Rest of Asia Pacific Alginates Regional Analysis and Outlook
8.5. South America Alginates Revenue (USD Million), by Country (2021-2032)
8.5.1. Brazil Alginates Regional Analysis and Outlook
8.5.2. Argentina Alginates Regional Analysis and Outlook
8.5.3. Rest of South America Alginates Regional Analysis and Outlook
8.6. Middle East and Africa Alginates Revenue (USD Million) by Country (2021-2032)
8.6.1. Middle East Alginates Regional Analysis and Outlook
8.6.2. Africa Alginates Regional Analysis and Outlook
Chapter 9. North America Alginates Analysis and Outlook
9.1. North America Alginates Revenue (USD Million) by Segments (2021-2032)
9.1.1. North America Alginates Revenue (USD Million) by Type (2021-2032)
9.1.2. North America Alginates Revenue (USD Million) by Application (2021-2032)
9.1.3. North America Alginates Revenue (USD Million) by Product (2021-2032)
By Type
High M
High G
By Product
Sodium
Calcium
Potassium
Propylene Glycol
Others
By Application
Food and Beverages
-Bakery
-Confectionery
-Meat Products
-Dairy Products
-Sauces & Dressings
-Beverages
-Others
Pharmaceutical
Industrial
Others
Chapter 10. Europe Alginates Analysis and Outlook
10.1. Europe Alginates Revenue (USD Million), by Segments (USD Million) (2021-2032)
10.1.1. Europe Alginates Revenue (USD Million) by Type (2021-2032)
10.1.2. Europe Alginates Revenue (USD Million) by Application (2021-2032)
10.1.3. Europe Alginates Revenue (USD Million) by Product (2021-2032)
By Type
High M
High G
By Product
Sodium
Calcium
Potassium
Propylene Glycol
Others
By Application
Food and Beverages
-Bakery
-Confectionery
-Meat Products
-Dairy Products
-Sauces & Dressings
-Beverages
-Others
Pharmaceutical
Industrial
Others
Chapter 11. Asia Pacific Alginates Analysis and Outlook
11.1. Asia Pacific Alginates Revenue (USD Million), and Revenue (USD Million) by Segments (2021-2032)
11.1.1. Asia Pacific Alginates Revenue (USD Million) by Type (2021-2032)
11.1.2. Asia Pacific Alginates Revenue (USD Million) by Application (2021-2032)
11.1.3. Asia Pacific Alginates Revenue (USD Million) by Product (2021-2032)
By Type
High M
High G
By Product
Sodium
Calcium
Potassium
Propylene Glycol
Others
By Application
Food and Beverages
-Bakery
-Confectionery
-Meat Products
-Dairy Products
-Sauces & Dressings
-Beverages
-Others
Pharmaceutical
Industrial
Others
Chapter 12. South America Alginates Analysis and Outlook
12.1. South America Alginates Revenue (USD Million), by Segments (2021-2032)
12.1.1. South America Alginates Revenue (USD Million) by Type (2021-2032)
12.1.2. South America Alginates Revenue (USD Million) by Application (2021-2032)
12.1.3. South America Alginates Revenue (USD Million) by Product (2021-2032)
By Type
High M
High G
By Product
Sodium
Calcium
Potassium
Propylene Glycol
Others
By Application
Food and Beverages
-Bakery
-Confectionery
-Meat Products
-Dairy Products
-Sauces & Dressings
-Beverages
-Others
Pharmaceutical
Industrial
Others
Chapter 13. Middle East and Africa Alginates Analysis and Outlook
13.1. Middle East and Africa Alginates Revenue (USD Million), by Segments (2021-2032)
13.1.1. Middle East and Africa Alginates Revenue (USD Million) by Type (2021-2032)
13.1.2. Middle East and Africa Alginates Revenue (USD Million) by Application (2021-2032)
13.1.3. Middle East and Africa Alginates Revenue (USD Million) by Product (2021-2032)
By Type
High M
High G
By Product
Sodium
Calcium
Potassium
Propylene Glycol
Others
By Application
Food and Beverages
-Bakery
-Confectionery
-Meat Products
-Dairy Products
-Sauces & Dressings
-Beverages
-Others
Pharmaceutical
Industrial
Others
Chapter 14. Alginates Company Profiles
14.1 Business Overview
14.2 Product Profiles
14.3 SWOT Profiles
14.5 Recent Developments
14.6 Financial Profile
List of Companies
Algaia
Ceamsa
DuPont de Nemours Inc
Ingredients Solutions Inc
KIMICA
Marine Biopolymers Ltd
Shandong Jiejing Group Corp
15. Methodology and Data Sources
15.1 Customization Offerings
15.2 Subscription Services
15.3 Related Reports
15.4 Publisher Expertise
LIST OF TABLES
Table 1 Market Segmentation Analysis
Table 2 Global Alginates Market Share of Leading Companies, 2023
Table 3 Product Offerings of Leading Companies
Table 4 Low Growth Scenario Forecasts
Table 5 Reference Case Growth Scenario
Table 6 High Growth Case Scenario
Table 7 Global Alginates Revenue (USD Million) And CAGR (%) By Type (2021-2032)
Table 8 Global Alginates Revenue (USD Million) And CAGR (%) By Application (2021-2032)
Table 9 Global Alginates Revenue (USD Million) And CAGR (%) By Product (2021-2032)
Table 10 Global Alginates Market Revenue (USD Million) By Regions (2021-2032)
Table 11 Global Alginates Market Share (%) By Regions (2021-2032)
Table 12 North America Alginates Revenue (USD Million) By Country (2021-2032)
Table 13 Europe Alginates Revenue (USD Million) By Country (2021-2032)
Table 14 Asia Pacific Alginates Revenue (USD Million) By Country (2021-2032)
Table 15 South America Alginates Revenue (USD Million) By Country (2021-2032)
Table 16 Middle East and Africa Alginates Revenue (USD Million) By Region (2021-2032)
Table 17 North America Alginates Revenue (USD Million) By Type (2021-2032)
Table 18 North America Alginates Revenue (USD Million) By Application (2021-2032)
Table 19 North America Alginates Revenue (USD Million) By Product (2021-2032)
Table 20 Europe Alginates Revenue (USD Million) By Type (2021-2032)
Table 21 Europe Alginates Revenue (USD Million) By Application (2021-2032)
Table 22 Europe Alginates Revenue (USD Million) By Product (2021-2032)
Table 23 Asia Pacific Alginates Revenue (USD Million) By Type (2021-2032)
Table 24 Asia Pacific Alginates Revenue (USD Million) By Application (2021-2032)
Table 25 Asia Pacific Alginates Revenue (USD Million) By Product (2021-2032)
Table 26 South America Alginates Revenue (USD Million) By Type (2021-2032)
Table 27 South America Alginates Revenue (USD Million) By Application (2021-2032)
Table 28 South America Alginates Revenue (USD Million) By Product (2021-2032)
Table 29 Middle East and Africa Alginates Revenue (USD Million) By Type (2021-2032)
Table 30 Middle East and Africa Alginates Revenue (USD Million) By Application (2021-2032)
Table 31 Middle East and Africa Alginates Revenue (USD Million) By Product (2021-2032)
LIST OF FIGURES
Figure 1. Market Scope
Figure 2. Pricing Forecasts Per Unit, 2023- 2032
Figure 3. Porter’s Five Forces
Figure 4. Global Alginates Market Revenue (USD Million) By Regions (2021-2032)
Figure 5. Global Alginates Market Share (%) By Regions (2023)
Figure 6. North America Alginates Revenue (USD Million) By Country (2021-2032)
Figure 7. United States Alginates Revenue (USD Million) By Country (2021-2032)
Figure 8. Canada Alginates Revenue (USD Million) By Country (2021-2032)
Figure 9. Mexico Alginates Revenue (USD Million) By Country (2021-2032)
Figure 10. Europe Alginates Revenue (USD Million) By Country (2021-2032)
Figure 11. Germany Alginates Revenue (USD Million) By Country (2021-2032)
Figure 12. France Alginates Revenue (USD Million) By Country (2021-2032)
Figure 13. United Kingdom Alginates Revenue (USD Million) By Country (2021-2032)
Figure 14. Spain Alginates Revenue (USD Million) By Country (2021-2032)
Figure 15. Italy Alginates Revenue (USD Million) By Country (2021-2032)
Figure 16. Russia Alginates Revenue (USD Million) By Country (2021-2032)
Figure 17. Rest of Europe Alginates Revenue (USD Million) By Country (2021-2032)
Figure 11. Asia Pacific Alginates Revenue (USD Million) By Country (2021-2032)
Figure 12. China Alginates Revenue (USD Million) By Country (2021-2032)
Figure 13. Japan Alginates Revenue (USD Million) By Country (2021-2032)
Figure 14. India Alginates Revenue (USD Million) By Country (2021-2032)
Figure 15. South Korea Alginates Revenue (USD Million) By Country (2021-2032)
Figure 16. Australia Alginates Revenue (USD Million) By Country (2021-2032)
Figure 17. South East Asia Alginates Revenue (USD Million) By Country (2021-2032)
Figure 18. South America Alginates Revenue (USD Million) By Country (2021-2032)
Figure 19. Brazil Alginates Revenue (USD Million) By Country (2021-2032)
Figure 20. Argentina Alginates Revenue (USD Million) By Country (2021-2032)
Figure 21. Rest of Asia Pacific Alginates Revenue (USD Million) By Country (2021-2032)
Figure 22. Middle East and Africa Alginates Revenue (USD Million) By Region (2021-2032)
Figure 23. Saudi Arabia Alginates Revenue (USD Million) By Region (2021-2032)
Figure 24. The UAE Alginates Revenue (USD Million) By Region (2021-2032)
Figure 25. Rest of Middle East Alginates Revenue (USD Million) By Region (2021-2032)
Figure 26. South Africa Alginates Revenue (USD Million) By Region (2021-2032)
Figure 27. Africa Alginates Revenue (USD Million) By Region (2021-2032)
Figure 28. North America Alginates Revenue (USD Million) By Type (2021-2032)
Figure 29. North America Alginates Revenue (USD Million) By Application (2021-2032)
Figure 30. North America Alginates Revenue (USD Million) By Product (2021-2032)
Figure 31. Europe Alginates Revenue (USD Million) By Type (2021-2032)
Figure 32. Europe Alginates Revenue (USD Million) By Application (2021-2032)
Figure 33. Europe Alginates Revenue (USD Million) By Product (2021-2032)
Figure 34. Asia Pacific Alginates Revenue (USD Million) By Type (2021-2032)
Figure 35. Asia Pacific Alginates Revenue (USD Million) By Application (2021-2032)
Figure 36. Asia Pacific Alginates Revenue (USD Million) By Product (2021-2032)
Figure 37. South America Alginates Revenue (USD Million) By Type (2021-2032)
Figure 38. South America Alginates Revenue (USD Million) By Application (2021-2032)
Figure 39. South America Alginates Revenue (USD Million) By Product (2021-2032)
Figure 40. Middle East and Africa Alginates Revenue (USD Million) By Type (2021-2032)
Figure 41. Middle East and Africa Alginates Revenue (USD Million) By Application (2021-2032)
Figure 42. Middle East and Africa Alginates Revenue (USD Million) By Product (2021-2032)
By Type
High M
High G
By Product
Sodium
Calcium
Potassium
Propylene Glycol
Others
By Application
Food and Beverages
-Bakery
-Confectionery
-Meat Products
-Dairy Products
-Sauces & Dressings
-Beverages
-Others
Pharmaceutical
Industrial
Others
Countries Analyzed
North America (US, Canada, Mexico)
Europe (Germany, UK, France, Spain, Italy, Russia, Rest of Europe)
Asia Pacific (China, India, Japan, South Korea, Australia, South East Asia, Rest of Asia)
South America (Brazil, Argentina, Rest of South America)
Middle East and Africa (Saudi Arabia, UAE, Rest of Middle East, South Africa, Egypt, Rest of Africa)
