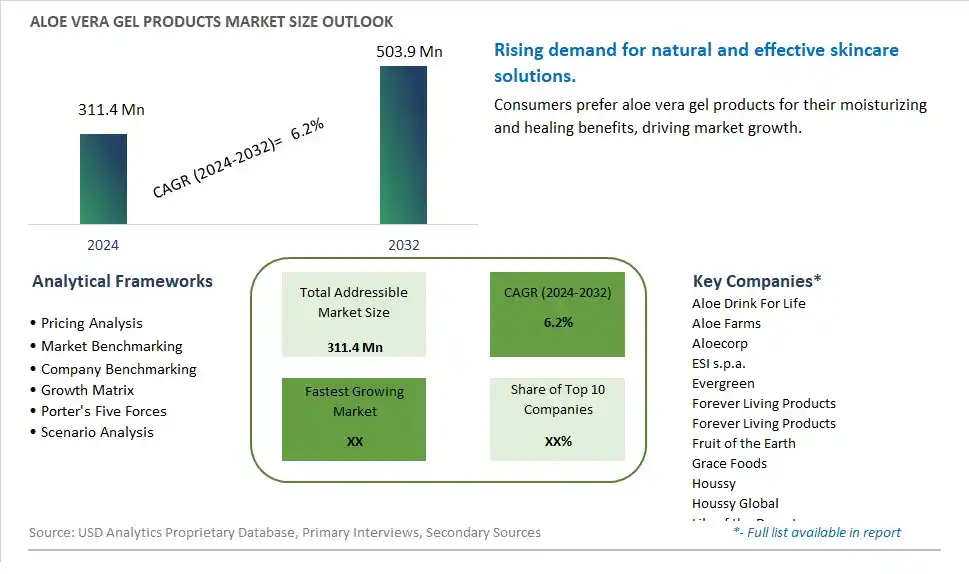
Global Aloe Vera Gel Products Market Size is valued at $311.4 Million in 2024 and is forecast to register a growth rate (CAGR) of 6.2% to reach $503.9 Million by 2032.
The global Aloe Vera Gel Products Market Comprehensive Study analyzes and forecasts the market size across 6 regions and 24 countries for diverse segments -By Type (Conventional, Diet), By End-User (Pharmaceuticals, Food and Beverages, Cosmetics, Others)
An Introduction to Aloe Vera Gel Products Market
The Aloe Vera Gel Products market in 2024 is growing robustly, driven by the widespread use of aloe vera gel in skincare, hair care, and therapeutic products. Aloe vera gel is known for its moisturizing, anti-inflammatory, and healing properties, making it a staple in personal care formulations. The market is supported by the increasing consumer preference for natural and organic skincare solutions. Innovations in formulation and packaging are enhancing the usability and shelf life of aloe vera gel products. The market is also benefiting from the rising demand for multifunctional and clean-label personal care products, catering to diverse consumer needs.
Aloe Vera Gel Products Competitive Landscape
The market report analyses the leading companies in the industry including Aloe Drink For Life, Aloe Farms, Aloecorp, ESI s.p.a., Evergreen, Forever Living Products, Forever Living Products, Fruit of the Earth, Grace Foods, Houssy, Houssy Global, Lily of the Desert, NOBE, OKF, Okyalo, RITA, Savia, Simplee Aloe, Suja Life, Take Tory, Terry Lab, and Others.
Aloe Vera Gel Products Market Dynamics
Aloe Vera Gel Products Market Trend: Growing Demand for Clean Beauty Products
The most prominent trend in the Aloe Vera gel products market is the growing demand for clean beauty products. Consumers are increasingly seeking skincare and personal care products that are free from harmful chemicals, synthetic fragrances, and artificial additives. Aloe Vera gel, known for its natural soothing, moisturizing, and healing properties, fits well within the clean beauty movement. This trend is driven by the desire for transparency in product ingredients and a preference for natural formulations that promise safety and efficacy. As a result, Aloe Vera gel is becoming a staple ingredient in a wide range of clean beauty products, from moisturizers to sunscreens.
Aloe Vera Gel Products Market Driver: Increasing Awareness of Aloe Vera's Therapeutic Benefits
The primary driver for the Aloe Vera gel products market is the increasing awareness of Aloe Vera's therapeutic benefits. Aloe Vera gel is renowned for its ability to treat sunburns, reduce inflammation, and promote skin hydration and healing. The gel's rich content of vitamins, minerals, and antioxidants makes it a valuable addition to skincare routines, particularly for those with sensitive or acne-prone skin. This heightened awareness, bolstered by endorsements from dermatologists and beauty influencers, drives consumer demand for Aloe Vera gel products as a natural solution for various skin concerns.
Aloe Vera Gel Products Market Opportunity: Innovation in Multi-Functional Aloe Vera Gel Products
A significant opportunity in the Aloe Vera gel products market lies in the innovation of multi-functional products. Consumers are looking for versatile products that offer multiple benefits in one formulation, providing convenience and value. Manufacturers can capitalize on this opportunity by developing Aloe Vera gel products that combine the plant's soothing and hydrating properties with other active ingredients to address a range of skincare needs, such as anti-aging, brightening, and acne treatment. Additionally, there is potential for expanding Aloe Vera gel applications beyond skincare to include hair care, wound care, and therapeutic uses, tapping into the broad spectrum of Aloe Vera's benefits.
Aloe Vera Gel Products Market Share Analysis: Conventional Aloe Vera Gel Products segment generated the highest revenue share in the industry
The Conventional Aloe Vera Gel Products segment emerges as the largest in the Aloe Vera Gel Products market, showcasing robust growth and widespread consumer acceptance. Conventional Aloe Vera gel products refer to those made from Aloe Vera extracts without specific modifications or alterations in formulation. These products have a broad appeal due to their natural origin and the well-established reputation of Aloe Vera for skincare and health benefits. Conventional Aloe Vera gel products are widely used in various industries, including pharmaceuticals, cosmetics, and food and beverages, highlighting their versatility and market demand. Further, the familiarity and trust associated with conventional Aloe Vera gel products contribute to their dominance in the market. With continuous innovation in product formulations, packaging, and marketing strategies emphasizing the purity and efficacy of conventional Aloe Vera gel products, this segment is poised to maintain its market leadership and drive significant growth in the Aloe Vera Gel Products market.
Aloe Vera Gel Products Market Share Analysis: Cosmetics is the fastest growing segment over the forecast period to 2032
The Cosmetics segment within the Aloe Vera Gel Products market is poised for rapid growth leading up to 2032. This segment's accelerated expansion is driven by several key factors. Firstly, there's a global trend towards natural and organic skincare products, with consumers increasingly prioritizing ingredients like Aloe Vera known for their soothing, hydrating, and rejuvenating properties. Aloe Vera gel products are highly versatile and can be incorporated into various cosmetic formulations such as creams, lotions, serums, and masks, catering to diverse skincare needs. Further, the growing awareness of Aloe Vera's antioxidant, anti-inflammatory, and anti-aging benefits further boosts its popularity in cosmetics. The Cosmetics segment also benefits from continuous innovations in Aloe Vera gel product formulations, packaging designs, and marketing strategies, enhancing their appeal and driving consumer demand. With the rise of clean beauty trends and increasing consumer preference for natural alternatives, the Cosmetics segment is positioned to experience exponential growth and emerge as a dominant force within the Aloe Vera Gel Products market by 2032.
Aloe Vera Gel Products Market Segmentation
By Type
Conventional
Diet
By End-User
Pharmaceuticals
Food and Beverages
Cosmetics
Others
Countries Analyzed
North America (US, Canada, Mexico)
Europe (Germany, UK, France, Spain, Italy, Russia, Rest of Europe)
Asia Pacific (China, India, Japan, South Korea, Australia, South East Asia, Rest of Asia)
South America (Brazil, Argentina, Rest of South America)
Middle East and Africa (Saudi Arabia, UAE, Rest of Middle East, South Africa, Egypt, Rest of Africa)
Aloe Vera Gel Products Companies Profiled in the Study
Aloe Drink For Life
Aloe Farms
Aloecorp
ESI s.p.a.
Evergreen
Forever Living Products
Forever Living Products
Fruit of the Earth
Grace Foods
Houssy
Houssy Global
Lily of the Desert
NOBE
OKF
Okyalo
RITA
Savia
Simplee Aloe
Suja Life
Take Tory
Terry Lab
*- List Not Exhaustive
Chapter 1. TABLE OF CONTENTS
Chapter 2. Introduction to Aloe Vera Gel Products Market
2.1. Market Overview
2.2. Key Statistics and Report Highlights
2.3. Scope of the Comprehensive Study
2.3.1. Market Definition
2.3.2 Countries and Regions Covered
2.3.3 Research Objective
2.3.4 Units, Currency, and Conversions
2.3.5 Industry Value Chain
2.4. Key Market Segments
2.5. Key Companies
2.6. Study Period
Chapter 3. Strategic Analysis Review
3.1. Aloe Vera Gel Products Pricing Analysis and Forecast
3.2. Porter’s Five Forces
3.3. Market Ecosystem
3.4. SWOT Analysis
3.5. Regulatory Scenario
3.3. Effects of Inflation, Russia-Ukraine War, moderating economic growth, and other macroeconomic factors
Chapter 4. Competitive Landscape
4.1. Market Share Analysis
4.1.1. Global Aloe Vera Gel Products Market Share by Company, 2023
4.1.2. Product Offerings of Leading Aloe Vera Gel Products Companies
4.2. Market Entropy
4.2.1. New Product Launches in the Industry
4.2.2. Mergers, Acquisitions, Joint ventures, and Partnerships
4.3. Key Strategies and Best Practices
Chapter 5. Global Market Projections: Best, Reference, and Low Case Scenarios
5.1. Growth Analysis- Case Scenario Definitions
5.2. Low Growth Case Scenario Forecasts
5.3. Reference Growth Case Scenario Forecasts
5.4. High Growth Case Scenario Forecasts
Chapter 6. Market Dynamics
6.1. Aloe Vera Gel Products Market Drivers
6.2. Aloe Vera Gel Products Market Challenges
6.6. Aloe Vera Gel Products Market Opportunities
6.4. Aloe Vera Gel Products Market Trends
Chapter 7. Global Aloe Vera Gel Products Market Outlook Trends
7.1. Global Aloe Vera Gel Products Revenue (USD Million) and CAGR (%) by Type (2021-2032)
7.2. Global Aloe Vera Gel Products Revenue (USD Million) and CAGR (%) by Application (2021-2032)
7.3. Global Aloe Vera Gel Products Revenue (USD Million) and CAGR (%) by Product (2021-2032)
By Type
Conventional
Diet
By End-User
Pharmaceuticals
Food and Beverages
Cosmetics
Others
Chapter 8. Global Aloe Vera Gel Products Regional Analysis and Outlook
8.1. Global Aloe Vera Gel Products Revenue (USD Million) By Regions (2021- 2032)
8.2. North America Aloe Vera Gel Products Revenue (USD Million) by Country (2021-2032)
8.2.1. United States Aloe Vera Gel Products Regional Analysis and Outlook
8.2.2. Canada Aloe Vera Gel Products Regional Analysis and Outlook
8.2.3. Mexico Aloe Vera Gel Products Regional Analysis and Outlook
8.3. Europe Aloe Vera Gel Products Revenue (USD Million), by Country (2021-2032)
8.3.1. Germany Aloe Vera Gel Products Regional Analysis and Outlook
8.3.2. France Aloe Vera Gel Products Regional Analysis and Outlook
8.3.3. United Kingdom Aloe Vera Gel Products Regional Analysis and Outlook
8.3.4. Spain Aloe Vera Gel Products Regional Analysis and Outlook
8.3.5. Italy Aloe Vera Gel Products Regional Analysis and Outlook
8.3.6. Russia Aloe Vera Gel Products Regional Analysis and Outlook
8.3.7. Rest of Europe Aloe Vera Gel Products Regional Analysis and Outlook
8.4. Asia Pacific Aloe Vera Gel Products Revenue (USD Million) by Country (2021-2032)
8.4.1. China Aloe Vera Gel Products Regional Analysis and Outlook
8.4.2. Japan Aloe Vera Gel Products Regional Analysis and Outlook
8.4.3. India Aloe Vera Gel Products Regional Analysis and Outlook
8.4.4. South Korea Aloe Vera Gel Products Regional Analysis and Outlook
8.4.5. Australia Aloe Vera Gel Products Regional Analysis and Outlook
8.4.6. South East Asia Aloe Vera Gel Products Regional Analysis and Outlook
8.4.7. Rest of Asia Pacific Aloe Vera Gel Products Regional Analysis and Outlook
8.5. South America Aloe Vera Gel Products Revenue (USD Million), by Country (2021-2032)
8.5.1. Brazil Aloe Vera Gel Products Regional Analysis and Outlook
8.5.2. Argentina Aloe Vera Gel Products Regional Analysis and Outlook
8.5.3. Rest of South America Aloe Vera Gel Products Regional Analysis and Outlook
8.6. Middle East and Africa Aloe Vera Gel Products Revenue (USD Million) by Country (2021-2032)
8.6.1. Middle East Aloe Vera Gel Products Regional Analysis and Outlook
8.6.2. Africa Aloe Vera Gel Products Regional Analysis and Outlook
Chapter 9. North America Aloe Vera Gel Products Analysis and Outlook
9.1. North America Aloe Vera Gel Products Revenue (USD Million) by Segments (2021-2032)
9.1.1. North America Aloe Vera Gel Products Revenue (USD Million) by Type (2021-2032)
9.1.2. North America Aloe Vera Gel Products Revenue (USD Million) by Application (2021-2032)
9.1.3. North America Aloe Vera Gel Products Revenue (USD Million) by Product (2021-2032)
By Type
Conventional
Diet
By End-User
Pharmaceuticals
Food and Beverages
Cosmetics
Others
Chapter 10. Europe Aloe Vera Gel Products Analysis and Outlook
10.1. Europe Aloe Vera Gel Products Revenue (USD Million), by Segments (USD Million) (2021-2032)
10.1.1. Europe Aloe Vera Gel Products Revenue (USD Million) by Type (2021-2032)
10.1.2. Europe Aloe Vera Gel Products Revenue (USD Million) by Application (2021-2032)
10.1.3. Europe Aloe Vera Gel Products Revenue (USD Million) by Product (2021-2032)
By Type
Conventional
Diet
By End-User
Pharmaceuticals
Food and Beverages
Cosmetics
Others
Chapter 11. Asia Pacific Aloe Vera Gel Products Analysis and Outlook
11.1. Asia Pacific Aloe Vera Gel Products Revenue (USD Million), and Revenue (USD Million) by Segments (2021-2032)
11.1.1. Asia Pacific Aloe Vera Gel Products Revenue (USD Million) by Type (2021-2032)
11.1.2. Asia Pacific Aloe Vera Gel Products Revenue (USD Million) by Application (2021-2032)
11.1.3. Asia Pacific Aloe Vera Gel Products Revenue (USD Million) by Product (2021-2032)
By Type
Conventional
Diet
By End-User
Pharmaceuticals
Food and Beverages
Cosmetics
Others
Chapter 12. South America Aloe Vera Gel Products Analysis and Outlook
12.1. South America Aloe Vera Gel Products Revenue (USD Million), by Segments (2021-2032)
12.1.1. South America Aloe Vera Gel Products Revenue (USD Million) by Type (2021-2032)
12.1.2. South America Aloe Vera Gel Products Revenue (USD Million) by Application (2021-2032)
12.1.3. South America Aloe Vera Gel Products Revenue (USD Million) by Product (2021-2032)
By Type
Conventional
Diet
By End-User
Pharmaceuticals
Food and Beverages
Cosmetics
Others
Chapter 13. Middle East and Africa Aloe Vera Gel Products Analysis and Outlook
13.1. Middle East and Africa Aloe Vera Gel Products Revenue (USD Million), by Segments (2021-2032)
13.1.1. Middle East and Africa Aloe Vera Gel Products Revenue (USD Million) by Type (2021-2032)
13.1.2. Middle East and Africa Aloe Vera Gel Products Revenue (USD Million) by Application (2021-2032)
13.1.3. Middle East and Africa Aloe Vera Gel Products Revenue (USD Million) by Product (2021-2032)
By Type
Conventional
Diet
By End-User
Pharmaceuticals
Food and Beverages
Cosmetics
Others
Chapter 14. Aloe Vera Gel Products Company Profiles
14.1 Business Overview
14.2 Product Profiles
14.3 SWOT Profiles
14.5 Recent Developments
14.6 Financial Profile
List of Companies
Aloe Drink For Life
Aloe Farms
Aloecorp
ESI s.p.a.
Evergreen
Forever Living Products
Forever Living Products
Fruit of the Earth
Grace Foods
Houssy
Houssy Global
Lily of the Desert
NOBE
OKF
Okyalo
RITA
Savia
Simplee Aloe
Suja Life
Take Tory
Terry Lab
15. Methodology and Data Sources
15.1 Customization Offerings
15.2 Subscription Services
15.3 Related Reports
15.4 Publisher Expertise
LIST OF TABLES
Table 1 Market Segmentation Analysis
Table 2 Global Aloe Vera Gel Products Market Share of Leading Companies, 2023
Table 3 Product Offerings of Leading Companies
Table 4 Low Growth Scenario Forecasts
Table 5 Reference Case Growth Scenario
Table 6 High Growth Case Scenario
Table 7 Global Aloe Vera Gel Products Revenue (USD Million) And CAGR (%) By Type (2021-2032)
Table 8 Global Aloe Vera Gel Products Revenue (USD Million) And CAGR (%) By Application (2021-2032)
Table 9 Global Aloe Vera Gel Products Revenue (USD Million) And CAGR (%) By Product (2021-2032)
Table 10 Global Aloe Vera Gel Products Market Revenue (USD Million) By Regions (2021-2032)
Table 11 Global Aloe Vera Gel Products Market Share (%) By Regions (2021-2032)
Table 12 North America Aloe Vera Gel Products Revenue (USD Million) By Country (2021-2032)
Table 13 Europe Aloe Vera Gel Products Revenue (USD Million) By Country (2021-2032)
Table 14 Asia Pacific Aloe Vera Gel Products Revenue (USD Million) By Country (2021-2032)
Table 15 South America Aloe Vera Gel Products Revenue (USD Million) By Country (2021-2032)
Table 16 Middle East and Africa Aloe Vera Gel Products Revenue (USD Million) By Region (2021-2032)
Table 17 North America Aloe Vera Gel Products Revenue (USD Million) By Type (2021-2032)
Table 18 North America Aloe Vera Gel Products Revenue (USD Million) By Application (2021-2032)
Table 19 North America Aloe Vera Gel Products Revenue (USD Million) By Product (2021-2032)
Table 20 Europe Aloe Vera Gel Products Revenue (USD Million) By Type (2021-2032)
Table 21 Europe Aloe Vera Gel Products Revenue (USD Million) By Application (2021-2032)
Table 22 Europe Aloe Vera Gel Products Revenue (USD Million) By Product (2021-2032)
Table 23 Asia Pacific Aloe Vera Gel Products Revenue (USD Million) By Type (2021-2032)
Table 24 Asia Pacific Aloe Vera Gel Products Revenue (USD Million) By Application (2021-2032)
Table 25 Asia Pacific Aloe Vera Gel Products Revenue (USD Million) By Product (2021-2032)
Table 26 South America Aloe Vera Gel Products Revenue (USD Million) By Type (2021-2032)
Table 27 South America Aloe Vera Gel Products Revenue (USD Million) By Application (2021-2032)
Table 28 South America Aloe Vera Gel Products Revenue (USD Million) By Product (2021-2032)
Table 29 Middle East and Africa Aloe Vera Gel Products Revenue (USD Million) By Type (2021-2032)
Table 30 Middle East and Africa Aloe Vera Gel Products Revenue (USD Million) By Application (2021-2032)
Table 31 Middle East and Africa Aloe Vera Gel Products Revenue (USD Million) By Product (2021-2032)
LIST OF FIGURES
Figure 1. Market Scope
Figure 2. Pricing Forecasts Per Unit, 2023- 2032
Figure 3. Porter’s Five Forces
Figure 4. Global Aloe Vera Gel Products Market Revenue (USD Million) By Regions (2021-2032)
Figure 5. Global Aloe Vera Gel Products Market Share (%) By Regions (2023)
Figure 6. North America Aloe Vera Gel Products Revenue (USD Million) By Country (2021-2032)
Figure 7. United States Aloe Vera Gel Products Revenue (USD Million) By Country (2021-2032)
Figure 8. Canada Aloe Vera Gel Products Revenue (USD Million) By Country (2021-2032)
Figure 9. Mexico Aloe Vera Gel Products Revenue (USD Million) By Country (2021-2032)
Figure 10. Europe Aloe Vera Gel Products Revenue (USD Million) By Country (2021-2032)
Figure 11. Germany Aloe Vera Gel Products Revenue (USD Million) By Country (2021-2032)
Figure 12. France Aloe Vera Gel Products Revenue (USD Million) By Country (2021-2032)
Figure 13. United Kingdom Aloe Vera Gel Products Revenue (USD Million) By Country (2021-2032)
Figure 14. Spain Aloe Vera Gel Products Revenue (USD Million) By Country (2021-2032)
Figure 15. Italy Aloe Vera Gel Products Revenue (USD Million) By Country (2021-2032)
Figure 16. Russia Aloe Vera Gel Products Revenue (USD Million) By Country (2021-2032)
Figure 17. Rest of Europe Aloe Vera Gel Products Revenue (USD Million) By Country (2021-2032)
Figure 11. Asia Pacific Aloe Vera Gel Products Revenue (USD Million) By Country (2021-2032)
Figure 12. China Aloe Vera Gel Products Revenue (USD Million) By Country (2021-2032)
Figure 13. Japan Aloe Vera Gel Products Revenue (USD Million) By Country (2021-2032)
Figure 14. India Aloe Vera Gel Products Revenue (USD Million) By Country (2021-2032)
Figure 15. South Korea Aloe Vera Gel Products Revenue (USD Million) By Country (2021-2032)
Figure 16. Australia Aloe Vera Gel Products Revenue (USD Million) By Country (2021-2032)
Figure 17. South East Asia Aloe Vera Gel Products Revenue (USD Million) By Country (2021-2032)
Figure 18. South America Aloe Vera Gel Products Revenue (USD Million) By Country (2021-2032)
Figure 19. Brazil Aloe Vera Gel Products Revenue (USD Million) By Country (2021-2032)
Figure 20. Argentina Aloe Vera Gel Products Revenue (USD Million) By Country (2021-2032)
Figure 21. Rest of Asia Pacific Aloe Vera Gel Products Revenue (USD Million) By Country (2021-2032)
Figure 22. Middle East and Africa Aloe Vera Gel Products Revenue (USD Million) By Region (2021-2032)
Figure 23. Saudi Arabia Aloe Vera Gel Products Revenue (USD Million) By Region (2021-2032)
Figure 24. The UAE Aloe Vera Gel Products Revenue (USD Million) By Region (2021-2032)
Figure 25. Rest of Middle East Aloe Vera Gel Products Revenue (USD Million) By Region (2021-2032)
Figure 26. South Africa Aloe Vera Gel Products Revenue (USD Million) By Region (2021-2032)
Figure 27. Africa Aloe Vera Gel Products Revenue (USD Million) By Region (2021-2032)
Figure 28. North America Aloe Vera Gel Products Revenue (USD Million) By Type (2021-2032)
Figure 29. North America Aloe Vera Gel Products Revenue (USD Million) By Application (2021-2032)
Figure 30. North America Aloe Vera Gel Products Revenue (USD Million) By Product (2021-2032)
Figure 31. Europe Aloe Vera Gel Products Revenue (USD Million) By Type (2021-2032)
Figure 32. Europe Aloe Vera Gel Products Revenue (USD Million) By Application (2021-2032)
Figure 33. Europe Aloe Vera Gel Products Revenue (USD Million) By Product (2021-2032)
Figure 34. Asia Pacific Aloe Vera Gel Products Revenue (USD Million) By Type (2021-2032)
Figure 35. Asia Pacific Aloe Vera Gel Products Revenue (USD Million) By Application (2021-2032)
Figure 36. Asia Pacific Aloe Vera Gel Products Revenue (USD Million) By Product (2021-2032)
Figure 37. South America Aloe Vera Gel Products Revenue (USD Million) By Type (2021-2032)
Figure 38. South America Aloe Vera Gel Products Revenue (USD Million) By Application (2021-2032)
Figure 39. South America Aloe Vera Gel Products Revenue (USD Million) By Product (2021-2032)
Figure 40. Middle East and Africa Aloe Vera Gel Products Revenue (USD Million) By Type (2021-2032)
Figure 41. Middle East and Africa Aloe Vera Gel Products Revenue (USD Million) By Application (2021-2032)
Figure 42. Middle East and Africa Aloe Vera Gel Products Revenue (USD Million) By Product (2021-2032)
By Type
Conventional
Diet
By End-User
Pharmaceuticals
Food and Beverages
Cosmetics
Others
Countries Analyzed
North America (US, Canada, Mexico)
Europe (Germany, UK, France, Spain, Italy, Russia, Rest of Europe)
Asia Pacific (China, India, Japan, South Korea, Australia, South East Asia, Rest of Asia)
South America (Brazil, Argentina, Rest of South America)
Middle East and Africa (Saudi Arabia, UAE, Rest of Middle East, South Africa, Egypt, Rest of Africa)
