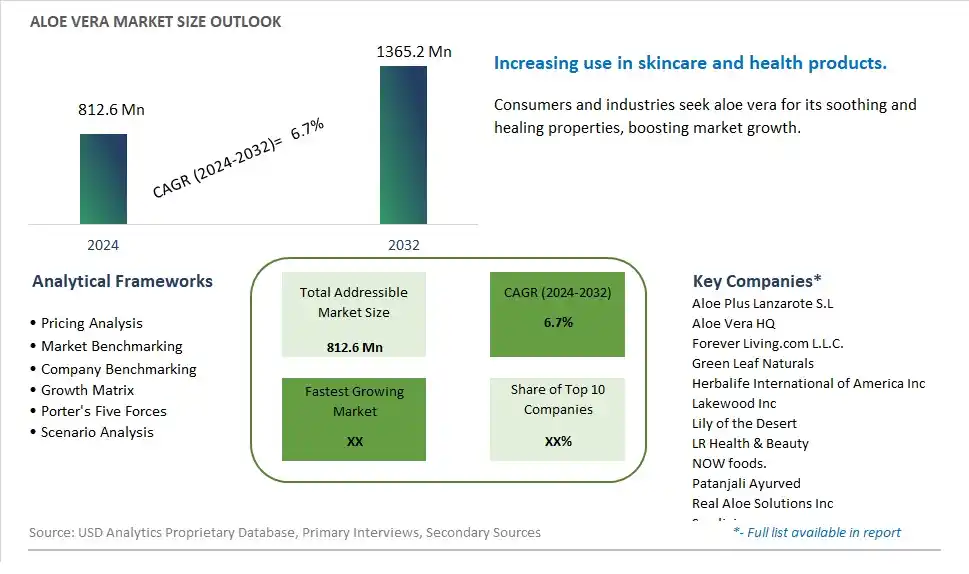
Global Aloe Vera Market Size is valued at $812.6 Million in 2024 and is forecast to register a growth rate (CAGR) of 6.7% to reach $1365.2 Million by 2032.
The global Aloe Vera Market Comprehensive Study analyzes and forecasts the market size across 6 regions and 24 countries for diverse segments -By Type (Aloe Vera Gel Extracts, Aloe Vera Whole Leaf Extracts, Decolorized Whole Leaf Extracts, Dried aloe latex, Others), By Form (Gel, Powder, Capsule, Drink, Concentrates, Others), By End-User (Pharmaceuticals, Food and Beverages, Cosmetics, Others)
An Introduction to Aloe Vera Market
In 2024, the Aloe Vera market is expanding, driven by its extensive use in the health, beauty, and wellness industries. Aloe vera is valued for its soothing, hydrating, and healing properties, making it a popular ingredient in skincare products, dietary supplements, and health beverages. The market is supported by the increasing consumer demand for natural and organic ingredients. Advances in cultivation and extraction techniques are enhancing the quality and potency of aloe vera products. The market is also benefiting from the rising trend towards holistic and plant-based wellness solutions, appealing to health-conscious consumers worldwide.
Aloe Vera Competitive Landscape
The market report analyses the leading companies in the industry including Aloe Plus Lanzarote S.L, Aloe Vera HQ, Forever Living.com L.L.C., Green Leaf Naturals, Herbalife International of America Inc, Lakewood Inc , Lily of the Desert, LR Health & Beauty, NOW foods., Patanjali Ayurved, Real Aloe Solutions Inc, Sarvliving, The Bountiful Company, Warren Laboratories LLC, and Others.
Aloe Vera Market Dynamics
Aloe Vera Market Trend: Increasing Popularity of Natural and Organic Products
The most prominent trend in the Aloe Vera market is the increasing popularity of natural and organic products. Consumers are becoming more conscious about the ingredients in their personal care and wellness products, leading to a preference for natural and organic options. Aloe Vera, known for its soothing, hydrating, and healing properties, is widely used in a variety of products, from skincare and haircare to dietary supplements and beverages. This trend is fueled by the growing awareness of the benefits of using chemical-free, plant-based products, driving demand for Aloe Vera-infused goods across multiple sectors.
Aloe Vera Market Driver: Health and Wellness Benefits of Aloe Vera
The primary driver for the Aloe Vera market is the recognized health and wellness benefits of the plant. Aloe Vera is rich in vitamins, minerals, enzymes, and amino acids, making it a popular ingredient for promoting skin health, digestive health, and immune support. Its anti-inflammatory and antimicrobial properties also make it a go-to remedy for various skin conditions and minor wounds. As consumers continue to prioritize their health and wellness, the demand for Aloe Vera-based products remains strong, supported by its long-standing reputation as a versatile and effective natural remedy.
Aloe Vera Market Opportunity: Expansion in Functional Foods and Beverages
A significant opportunity in the Aloe Vera market lies in the expansion within the functional foods and beverages sector. As the trend towards functional and health-promoting foods grows, there is potential for Aloe Vera to be incorporated into a variety of consumable products, such as juices, smoothies, yogurts, and health shots. The increasing consumer interest in products that offer additional health benefits beyond basic nutrition provides a lucrative opportunity for manufacturers to innovate and introduce Aloe Vera-infused functional foods and beverages. These products can be marketed to health-conscious consumers looking for convenient and effective ways to boost their overall well-being.
Aloe Vera Market Share Analysis: Aloe Vera Gel Extracts segment generated the highest revenue share in the industry
The Aloe Vera Gel Extracts segment emerges as the largest in the Aloe Vera market, showcasing robust growth and widespread consumer acceptance. Aloe Vera Gel Extracts are highly sought after for their versatile applications in various industries such as pharmaceuticals, cosmetics, and food and beverages. The gel extracted from Aloe Vera leaves is renowned for its soothing, hydrating, and healing properties, making it a key ingredient in skincare products, herbal remedies, and functional beverages. Additionally, Aloe Vera Gel Extracts are rich in vitamins, minerals, and antioxidants, further enhancing their appeal among health-conscious consumers. With continuous innovations in extraction techniques, product formulations, and marketing strategies highlighting the numerous health benefits of Aloe Vera Gel Extracts, this segment is poised to maintain its market leadership and drive significant growth in the Aloe Vera market.
Aloe Vera Market Share Analysis: Aloe Vera Drink is the fastest growing segment over the forecast period to 2032
The Aloe Vera Drink segment is poised for rapid growth in the Aloe Vera market leading up to 2032. This segment's accelerated expansion is attributed to several key factors driving consumer demand. Firstly, there's a growing awareness of the health benefits associated with Aloe Vera consumption, including its potential to support digestive health, boost immunity, and provide hydration. Aloe Vera drinks offer a convenient and refreshing way for consumers to incorporate the benefits of Aloe Vera into their daily routines. Further, the popularity of natural and functional beverages is on the rise, with consumers seeking alternatives to sugary drinks and artificial ingredients. Aloe Vera drinks often come in various flavors and formulations, catering to diverse taste preferences and enhancing their appeal among a broad demographic. With ongoing innovations in Aloe Vera drink formulations, packaging, and marketing strategies emphasizing their health-promoting properties, the Aloe Vera Drink segment is expected to experience exponential growth and emerge as a dominant category within the Aloe Vera market by 2032.
Aloe Vera Market Share Analysis: Cosmetics segment generated the highest revenue share in the industry
The Cosmetics segment stands out as the largest in the Aloe Vera market, showcasing robust growth and widespread utilization. Aloe Vera has long been recognized for its beneficial properties in skincare, making it a highly sought-after ingredient in cosmetic formulations. The soothing, moisturizing, and healing properties of Aloe Vera make it suitable for various cosmetic products such as lotions, creams, serums, and masks. Additionally, Aloe Vera's natural anti-inflammatory and antibacterial properties appeal to consumers looking for gentle and effective skincare solutions. The increasing consumer preference for natural and organic cosmetics further boosts the demand for Aloe Vera-based products, driving the growth of this segment. With continuous research and development focusing on harnessing the full potential of Aloe Vera in cosmetics, coupled with rising consumer awareness of its benefits, the Cosmetics segment is poised to maintain its market leadership and drive significant growth in the Aloe Vera market.
Aloe Vera Market Segmentation
By Type
Aloe Vera Gel Extracts
Aloe Vera Whole Leaf Extracts
Decolorized Whole Leaf Extracts
Dried aloe latex
Others
By Form
Gel
Powder
Capsule
Drink
Concentrates
Others
By End-User
Pharmaceuticals
Food and Beverages
Cosmetics
Others
Countries Analyzed
North America (US, Canada, Mexico)
Europe (Germany, UK, France, Spain, Italy, Russia, Rest of Europe)
Asia Pacific (China, India, Japan, South Korea, Australia, South East Asia, Rest of Asia)
South America (Brazil, Argentina, Rest of South America)
Middle East and Africa (Saudi Arabia, UAE, Rest of Middle East, South Africa, Egypt, Rest of Africa)
Aloe Vera Companies Profiled in the Study
Aloe Plus Lanzarote S.L
Aloe Vera HQ
Forever Living.com L.L.C.
Green Leaf Naturals
Herbalife International of America Inc
Lakewood Inc
Lily of the Desert
LR Health & Beauty
NOW foods.
Patanjali Ayurved
Real Aloe Solutions Inc
Sarvliving
The Bountiful Company
Warren Laboratories LLC
*- List Not Exhaustive
Chapter 1. TABLE OF CONTENTS
Chapter 2. Introduction to Aloe Vera Market
2.1. Market Overview
2.2. Key Statistics and Report Highlights
2.3. Scope of the Comprehensive Study
2.3.1. Market Definition
2.3.2 Countries and Regions Covered
2.3.3 Research Objective
2.3.4 Units, Currency, and Conversions
2.3.5 Industry Value Chain
2.4. Key Market Segments
2.5. Key Companies
2.6. Study Period
Chapter 3. Strategic Analysis Review
3.1. Aloe Vera Pricing Analysis and Forecast
3.2. Porter’s Five Forces
3.3. Market Ecosystem
3.4. SWOT Analysis
3.5. Regulatory Scenario
3.3. Effects of Inflation, Russia-Ukraine War, moderating economic growth, and other macroeconomic factors
Chapter 4. Competitive Landscape
4.1. Market Share Analysis
4.1.1. Global Aloe Vera Market Share by Company, 2023
4.1.2. Product Offerings of Leading Aloe Vera Companies
4.2. Market Entropy
4.2.1. New Product Launches in the Industry
4.2.2. Mergers, Acquisitions, Joint ventures, and Partnerships
4.3. Key Strategies and Best Practices
Chapter 5. Global Market Projections: Best, Reference, and Low Case Scenarios
5.1. Growth Analysis- Case Scenario Definitions
5.2. Low Growth Case Scenario Forecasts
5.3. Reference Growth Case Scenario Forecasts
5.4. High Growth Case Scenario Forecasts
Chapter 6. Market Dynamics
6.1. Aloe Vera Market Drivers
6.2. Aloe Vera Market Challenges
6.6. Aloe Vera Market Opportunities
6.4. Aloe Vera Market Trends
Chapter 7. Global Aloe Vera Market Outlook Trends
7.1. Global Aloe Vera Revenue (USD Million) and CAGR (%) by Type (2021-2032)
7.2. Global Aloe Vera Revenue (USD Million) and CAGR (%) by Application (2021-2032)
7.3. Global Aloe Vera Revenue (USD Million) and CAGR (%) by Product (2021-2032)
By Type
Aloe Vera Gel Extracts
Aloe Vera Whole Leaf Extracts
Decolorized Whole Leaf Extracts
Dried aloe latex
Others
By Form
Gel
Powder
Capsule
Drink
Concentrates
Others
By End-User
Pharmaceuticals
Food and Beverages
Cosmetics
Others
Chapter 8. Global Aloe Vera Regional Analysis and Outlook
8.1. Global Aloe Vera Revenue (USD Million) By Regions (2021- 2032)
8.2. North America Aloe Vera Revenue (USD Million) by Country (2021-2032)
8.2.1. United States Aloe Vera Regional Analysis and Outlook
8.2.2. Canada Aloe Vera Regional Analysis and Outlook
8.2.3. Mexico Aloe Vera Regional Analysis and Outlook
8.3. Europe Aloe Vera Revenue (USD Million), by Country (2021-2032)
8.3.1. Germany Aloe Vera Regional Analysis and Outlook
8.3.2. France Aloe Vera Regional Analysis and Outlook
8.3.3. United Kingdom Aloe Vera Regional Analysis and Outlook
8.3.4. Spain Aloe Vera Regional Analysis and Outlook
8.3.5. Italy Aloe Vera Regional Analysis and Outlook
8.3.6. Russia Aloe Vera Regional Analysis and Outlook
8.3.7. Rest of Europe Aloe Vera Regional Analysis and Outlook
8.4. Asia Pacific Aloe Vera Revenue (USD Million) by Country (2021-2032)
8.4.1. China Aloe Vera Regional Analysis and Outlook
8.4.2. Japan Aloe Vera Regional Analysis and Outlook
8.4.3. India Aloe Vera Regional Analysis and Outlook
8.4.4. South Korea Aloe Vera Regional Analysis and Outlook
8.4.5. Australia Aloe Vera Regional Analysis and Outlook
8.4.6. South East Asia Aloe Vera Regional Analysis and Outlook
8.4.7. Rest of Asia Pacific Aloe Vera Regional Analysis and Outlook
8.5. South America Aloe Vera Revenue (USD Million), by Country (2021-2032)
8.5.1. Brazil Aloe Vera Regional Analysis and Outlook
8.5.2. Argentina Aloe Vera Regional Analysis and Outlook
8.5.3. Rest of South America Aloe Vera Regional Analysis and Outlook
8.6. Middle East and Africa Aloe Vera Revenue (USD Million) by Country (2021-2032)
8.6.1. Middle East Aloe Vera Regional Analysis and Outlook
8.6.2. Africa Aloe Vera Regional Analysis and Outlook
Chapter 9. North America Aloe Vera Analysis and Outlook
9.1. North America Aloe Vera Revenue (USD Million) by Segments (2021-2032)
9.1.1. North America Aloe Vera Revenue (USD Million) by Type (2021-2032)
9.1.2. North America Aloe Vera Revenue (USD Million) by Application (2021-2032)
9.1.3. North America Aloe Vera Revenue (USD Million) by Product (2021-2032)
By Type
Aloe Vera Gel Extracts
Aloe Vera Whole Leaf Extracts
Decolorized Whole Leaf Extracts
Dried aloe latex
Others
By Form
Gel
Powder
Capsule
Drink
Concentrates
Others
By End-User
Pharmaceuticals
Food and Beverages
Cosmetics
Others
Chapter 10. Europe Aloe Vera Analysis and Outlook
10.1. Europe Aloe Vera Revenue (USD Million), by Segments (USD Million) (2021-2032)
10.1.1. Europe Aloe Vera Revenue (USD Million) by Type (2021-2032)
10.1.2. Europe Aloe Vera Revenue (USD Million) by Application (2021-2032)
10.1.3. Europe Aloe Vera Revenue (USD Million) by Product (2021-2032)
By Type
Aloe Vera Gel Extracts
Aloe Vera Whole Leaf Extracts
Decolorized Whole Leaf Extracts
Dried aloe latex
Others
By Form
Gel
Powder
Capsule
Drink
Concentrates
Others
By End-User
Pharmaceuticals
Food and Beverages
Cosmetics
Others
Chapter 11. Asia Pacific Aloe Vera Analysis and Outlook
11.1. Asia Pacific Aloe Vera Revenue (USD Million), and Revenue (USD Million) by Segments (2021-2032)
11.1.1. Asia Pacific Aloe Vera Revenue (USD Million) by Type (2021-2032)
11.1.2. Asia Pacific Aloe Vera Revenue (USD Million) by Application (2021-2032)
11.1.3. Asia Pacific Aloe Vera Revenue (USD Million) by Product (2021-2032)
By Type
Aloe Vera Gel Extracts
Aloe Vera Whole Leaf Extracts
Decolorized Whole Leaf Extracts
Dried aloe latex
Others
By Form
Gel
Powder
Capsule
Drink
Concentrates
Others
By End-User
Pharmaceuticals
Food and Beverages
Cosmetics
Others
Chapter 12. South America Aloe Vera Analysis and Outlook
12.1. South America Aloe Vera Revenue (USD Million), by Segments (2021-2032)
12.1.1. South America Aloe Vera Revenue (USD Million) by Type (2021-2032)
12.1.2. South America Aloe Vera Revenue (USD Million) by Application (2021-2032)
12.1.3. South America Aloe Vera Revenue (USD Million) by Product (2021-2032)
By Type
Aloe Vera Gel Extracts
Aloe Vera Whole Leaf Extracts
Decolorized Whole Leaf Extracts
Dried aloe latex
Others
By Form
Gel
Powder
Capsule
Drink
Concentrates
Others
By End-User
Pharmaceuticals
Food and Beverages
Cosmetics
Others
Chapter 13. Middle East and Africa Aloe Vera Analysis and Outlook
13.1. Middle East and Africa Aloe Vera Revenue (USD Million), by Segments (2021-2032)
13.1.1. Middle East and Africa Aloe Vera Revenue (USD Million) by Type (2021-2032)
13.1.2. Middle East and Africa Aloe Vera Revenue (USD Million) by Application (2021-2032)
13.1.3. Middle East and Africa Aloe Vera Revenue (USD Million) by Product (2021-2032)
By Type
Aloe Vera Gel Extracts
Aloe Vera Whole Leaf Extracts
Decolorized Whole Leaf Extracts
Dried aloe latex
Others
By Form
Gel
Powder
Capsule
Drink
Concentrates
Others
By End-User
Pharmaceuticals
Food and Beverages
Cosmetics
Others
Chapter 14. Aloe Vera Company Profiles
14.1 Business Overview
14.2 Product Profiles
14.3 SWOT Profiles
14.5 Recent Developments
14.6 Financial Profile
List of Companies
Aloe Plus Lanzarote S.L
Aloe Vera HQ
Forever Living.com L.L.C.
Green Leaf Naturals
Herbalife International of America Inc
Lakewood Inc
Lily of the Desert
LR Health & Beauty
NOW foods.
Patanjali Ayurved
Real Aloe Solutions Inc
Sarvliving
The Bountiful Company
Warren Laboratories LLC
15. Methodology and Data Sources
15.1 Customization Offerings
15.2 Subscription Services
15.3 Related Reports
15.4 Publisher Expertise
LIST OF TABLES
Table 1 Market Segmentation Analysis
Table 2 Global Aloe Vera Market Share of Leading Companies, 2023
Table 3 Product Offerings of Leading Companies
Table 4 Low Growth Scenario Forecasts
Table 5 Reference Case Growth Scenario
Table 6 High Growth Case Scenario
Table 7 Global Aloe Vera Revenue (USD Million) And CAGR (%) By Type (2021-2032)
Table 8 Global Aloe Vera Revenue (USD Million) And CAGR (%) By Application (2021-2032)
Table 9 Global Aloe Vera Revenue (USD Million) And CAGR (%) By Product (2021-2032)
Table 10 Global Aloe Vera Market Revenue (USD Million) By Regions (2021-2032)
Table 11 Global Aloe Vera Market Share (%) By Regions (2021-2032)
Table 12 North America Aloe Vera Revenue (USD Million) By Country (2021-2032)
Table 13 Europe Aloe Vera Revenue (USD Million) By Country (2021-2032)
Table 14 Asia Pacific Aloe Vera Revenue (USD Million) By Country (2021-2032)
Table 15 South America Aloe Vera Revenue (USD Million) By Country (2021-2032)
Table 16 Middle East and Africa Aloe Vera Revenue (USD Million) By Region (2021-2032)
Table 17 North America Aloe Vera Revenue (USD Million) By Type (2021-2032)
Table 18 North America Aloe Vera Revenue (USD Million) By Application (2021-2032)
Table 19 North America Aloe Vera Revenue (USD Million) By Product (2021-2032)
Table 20 Europe Aloe Vera Revenue (USD Million) By Type (2021-2032)
Table 21 Europe Aloe Vera Revenue (USD Million) By Application (2021-2032)
Table 22 Europe Aloe Vera Revenue (USD Million) By Product (2021-2032)
Table 23 Asia Pacific Aloe Vera Revenue (USD Million) By Type (2021-2032)
Table 24 Asia Pacific Aloe Vera Revenue (USD Million) By Application (2021-2032)
Table 25 Asia Pacific Aloe Vera Revenue (USD Million) By Product (2021-2032)
Table 26 South America Aloe Vera Revenue (USD Million) By Type (2021-2032)
Table 27 South America Aloe Vera Revenue (USD Million) By Application (2021-2032)
Table 28 South America Aloe Vera Revenue (USD Million) By Product (2021-2032)
Table 29 Middle East and Africa Aloe Vera Revenue (USD Million) By Type (2021-2032)
Table 30 Middle East and Africa Aloe Vera Revenue (USD Million) By Application (2021-2032)
Table 31 Middle East and Africa Aloe Vera Revenue (USD Million) By Product (2021-2032)
LIST OF FIGURES
Figure 1. Market Scope
Figure 2. Pricing Forecasts Per Unit, 2023- 2032
Figure 3. Porter’s Five Forces
Figure 4. Global Aloe Vera Market Revenue (USD Million) By Regions (2021-2032)
Figure 5. Global Aloe Vera Market Share (%) By Regions (2023)
Figure 6. North America Aloe Vera Revenue (USD Million) By Country (2021-2032)
Figure 7. United States Aloe Vera Revenue (USD Million) By Country (2021-2032)
Figure 8. Canada Aloe Vera Revenue (USD Million) By Country (2021-2032)
Figure 9. Mexico Aloe Vera Revenue (USD Million) By Country (2021-2032)
Figure 10. Europe Aloe Vera Revenue (USD Million) By Country (2021-2032)
Figure 11. Germany Aloe Vera Revenue (USD Million) By Country (2021-2032)
Figure 12. France Aloe Vera Revenue (USD Million) By Country (2021-2032)
Figure 13. United Kingdom Aloe Vera Revenue (USD Million) By Country (2021-2032)
Figure 14. Spain Aloe Vera Revenue (USD Million) By Country (2021-2032)
Figure 15. Italy Aloe Vera Revenue (USD Million) By Country (2021-2032)
Figure 16. Russia Aloe Vera Revenue (USD Million) By Country (2021-2032)
Figure 17. Rest of Europe Aloe Vera Revenue (USD Million) By Country (2021-2032)
Figure 11. Asia Pacific Aloe Vera Revenue (USD Million) By Country (2021-2032)
Figure 12. China Aloe Vera Revenue (USD Million) By Country (2021-2032)
Figure 13. Japan Aloe Vera Revenue (USD Million) By Country (2021-2032)
Figure 14. India Aloe Vera Revenue (USD Million) By Country (2021-2032)
Figure 15. South Korea Aloe Vera Revenue (USD Million) By Country (2021-2032)
Figure 16. Australia Aloe Vera Revenue (USD Million) By Country (2021-2032)
Figure 17. South East Asia Aloe Vera Revenue (USD Million) By Country (2021-2032)
Figure 18. South America Aloe Vera Revenue (USD Million) By Country (2021-2032)
Figure 19. Brazil Aloe Vera Revenue (USD Million) By Country (2021-2032)
Figure 20. Argentina Aloe Vera Revenue (USD Million) By Country (2021-2032)
Figure 21. Rest of Asia Pacific Aloe Vera Revenue (USD Million) By Country (2021-2032)
Figure 22. Middle East and Africa Aloe Vera Revenue (USD Million) By Region (2021-2032)
Figure 23. Saudi Arabia Aloe Vera Revenue (USD Million) By Region (2021-2032)
Figure 24. The UAE Aloe Vera Revenue (USD Million) By Region (2021-2032)
Figure 25. Rest of Middle East Aloe Vera Revenue (USD Million) By Region (2021-2032)
Figure 26. South Africa Aloe Vera Revenue (USD Million) By Region (2021-2032)
Figure 27. Africa Aloe Vera Revenue (USD Million) By Region (2021-2032)
Figure 28. North America Aloe Vera Revenue (USD Million) By Type (2021-2032)
Figure 29. North America Aloe Vera Revenue (USD Million) By Application (2021-2032)
Figure 30. North America Aloe Vera Revenue (USD Million) By Product (2021-2032)
Figure 31. Europe Aloe Vera Revenue (USD Million) By Type (2021-2032)
Figure 32. Europe Aloe Vera Revenue (USD Million) By Application (2021-2032)
Figure 33. Europe Aloe Vera Revenue (USD Million) By Product (2021-2032)
Figure 34. Asia Pacific Aloe Vera Revenue (USD Million) By Type (2021-2032)
Figure 35. Asia Pacific Aloe Vera Revenue (USD Million) By Application (2021-2032)
Figure 36. Asia Pacific Aloe Vera Revenue (USD Million) By Product (2021-2032)
Figure 37. South America Aloe Vera Revenue (USD Million) By Type (2021-2032)
Figure 38. South America Aloe Vera Revenue (USD Million) By Application (2021-2032)
Figure 39. South America Aloe Vera Revenue (USD Million) By Product (2021-2032)
Figure 40. Middle East and Africa Aloe Vera Revenue (USD Million) By Type (2021-2032)
Figure 41. Middle East and Africa Aloe Vera Revenue (USD Million) By Application (2021-2032)
Figure 42. Middle East and Africa Aloe Vera Revenue (USD Million) By Product (2021-2032)
By Type
Aloe Vera Gel Extracts
Aloe Vera Whole Leaf Extracts
Decolorized Whole Leaf Extracts
Dried aloe latex
Others
By Form
Gel
Powder
Capsule
Drink
Concentrates
Others
By End-User
Pharmaceuticals
Food and Beverages
Cosmetics
Others
Countries Analyzed
North America (US, Canada, Mexico)
Europe (Germany, UK, France, Spain, Italy, Russia, Rest of Europe)
Asia Pacific (China, India, Japan, South Korea, Australia, South East Asia, Rest of Asia)
South America (Brazil, Argentina, Rest of South America)
Middle East and Africa (Saudi Arabia, UAE, Rest of Middle East, South Africa, Egypt, Rest of Africa)
