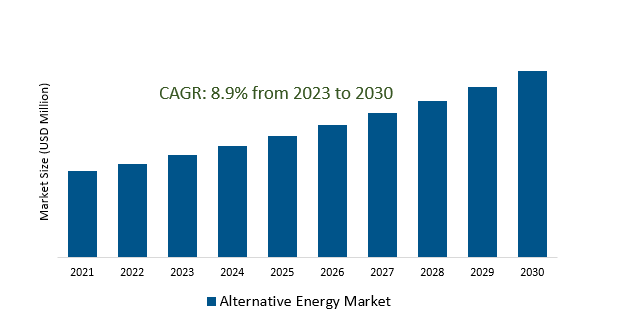
The Alternative Energy Market Size is estimated to register 8.9% growth over the forecast period from 2023 to 2030.
Alternative Energy Market Overview
Increasing awareness of climate change and its environmental impacts has been a significant driver for the adoption of alternative energy sources. Governments, organizations, and individuals are seeking cleaner and renewable energy options to reduce greenhouse gas emissions and combat climate change. Companies are adopting renewable energy to meet sustainability goals and reduce their carbon footprint. Increasing consumer awareness of environmental issues is leading to greater demand for products and services powered by renewable energy. Further, rise in decentralized energy systems and microgrids, allowing communities and smaller regions to produce and manage their own energy using renewable sources, promoting energy resilience and independence. Growing interest in green hydrogen as an energy carrier due to its potential for storing and transporting renewable energy, especially in industries where direct electrification is challenging is fueling the demand.
Alternative Energy Market Dynamics
Market Trends- Decentralization and microgrids empower local energy autonomy within the alternative energy market.
A departure from traditional centralized energy systems, enabling communities and smaller entities to generate, store, and manage their energy autonomously are the prime factors.
Microgrids, being independent or linked to the main grid, enhance resilience and reliability by utilizing various renewable sources like solar, wind, and occasionally hydro or biomass to fulfill local energy requirements are increasing the market demand.
Further, growing desire for energy independence, reduced reliance on centralized infrastructure, and increased flexibility in energy production and distribution are fueling the demand.
Market Driver- Surge in Clean Energy Demand within the Alternative Energy Market drives thew market growth.
Heightened environmental consciousness and concerns regarding climate change are serving as primary motivators, urging a shift towards cleaner energy sources.
Additionally, technological advancements and declining costs in renewable energy technologies, particularly solar and wind power are significantly increasing their competitiveness, attracting businesses and consumers seeking sustainable energy solutions.
Further, Enhanced energy security and reduced vulnerability to disruptions are contributing to the appeal of clean energy solutions for businesses, thereby growing the demand.
Market Opportunity - Hydrogen serves as an energy carrier within the alternative energy market.
The increasing emphasis on corporate sustainability and Environmental, Social, and Governance (ESG) considerations propels businesses to explore clean energy solutions like hydrogen.
The development of cost-effective methods like electrolysis powered by renewable energy are drawing the attention of businesses seeking reliable, scalable, and low-carbon energy solutions.
Further, the potential to serve as an energy carrier in transportation, particularly in fuel cell vehicles and heavy-duty transport, is driving interest from industries aiming to transition away from fossil fuels.
Market Share Analysis- Solar will register the fastest growth.
The Alternative Energy Market is analyzed across Solar, Wind, Hydroelectricity, Geothermal, , Biomass & Others. Solar is poised to register the fastest growth. This growth is primarily attributed to declining costs of solar photovoltaic (PV) technology, driven by economies of scale, technological innovation, and increased manufacturing efficiency. The scalability and versatility of solar panels have facilitated their widespread adoption across residential, commercial, and utility-scale projects. Government incentives, subsidies, and favorable policies further incentivize the deployment of solar systems, promoting their attractiveness as a clean and sustainable energy source. Moreover, the increasing awareness of environmental concerns and the push for reducing carbon emissions have accelerated the demand for solar energy. Countries worldwide are setting renewable energy targets and implemented regulations promoting solar power adoption, leading to its proliferation in the energy mix. Solar energy's decentralized nature also appeals to consumers seeking energy independence and resilience, contributing to its popularity in residential installations.
Market Share Analysis- Residential held a significant market share in 2023.
The Alternative Energy Market is analyzed across various applications including Residential, Commercial, Transportation & Other. Of these, Residential held a significant market share in 2023. One of the primary drivers behind this growth is the increasing popularity of rooftop solar photovoltaic (PV) systems among homeowners. The appeal of residential solar installations lies in their ability to provide energy independence, reduce electricity bills through on-site power generation, and contribute to environmental sustainability by utilizing clean energy. Declining costs of solar technology, coupled with government incentives, tax credits, and net metering programs in several regions, have incentivized homeowners to invest in solar panels. Additionally, advancements in energy-efficient home appliances, smart home technologies, and the availability of residential energy storage solutions are contributing to the attractiveness of alternative energy in residential settings. Energy storage systems, such as home batteries, enable homeowners to store excess energy generated by solar panels for later use, enhancing self-consumption and reducing reliance on the grid.
Alternative Energy Market Segmentation
By Type
- Solar
- Wind
- Hydroelectricity
- Geothermal
- Biomass
- Others
By Application
- Residential
- Commercial
- Transportation
- Other
By Region
- North America (United States, Canada, Mexico)
- Europe (Germany, France, United Kingdom, Spain, Italy, Others)
- Asia Pacific (China, India, Japan, South Korea, Australia, Others)
- Latin America (Brazil, Argentina, Others)
- Middle East and Africa (Saudi Arabia, UAE, Kuwait, Other Middle East, South Africa, Nigeria, Other Africa)
Alternative Energy Market Companies
- Enel Spa
- Ormat Technologies Inc.
- Northland Power Inc.
- Acciona SA
- NextEra Energy Resources
- LLC, adani group
- LONGi
- Ontario Power Generation Inc.
- Trina solar
- capstone infrastructure corporation
- ReNewPower
- Constellation Energy Corporation
*List not exhaustive
Alternative Energy Market Outlook 2023
1 Market Overview
1.1 Introduction to the Alternative Energy Market
1.2 Scope of the Study
1.3 Research Objective
1.3.1 Key Market Scope and Segments
1.3.2 Players Covered
1.3.3 Years Considered
2 Executive Summary
2.1 2023 Alternative Energy Industry- Market Statistics
3 Market Dynamics
3.1 Market Drivers
3.2 Market Challenges
3.3 Market Opportunities
3.4 Market Trends
4 Market Factor Analysis
4.1 Porter’s Five Forces
4.2 Market Entropy
4.2.1 Global Alternative Energy Market Companies with Area Served
4.2.2 Products Offerings Global Alternative Energy Market
5 COVID-19 Impact Analysis and Outlook Scenarios
5.1.1 Covid-19 Impact Analysis
5.1.2 post-COVID-19 Scenario- Low Growth Case
5.1.3 post-COVID-19 Scenario- Reference Growth Case
5.1.4 post-COVID-19 Scenario- Low Growth Case
6 Global Alternative Energy Market Trends
6.1 Global Alternative Energy Revenue (USD Million) and CAGR (%) by Type (2018-2030)
6.2 Global Alternative Energy Revenue (USD Million) and CAGR (%) by Applications (2018-2030)
6.3 Global Alternative Energy Revenue (USD Million) and CAGR (%) by regions (2018-2030)
7 Global Alternative Energy Market Revenue (USD Million) by Type, and Applications (2018-2022)
7.1 Global Alternative Energy Revenue (USD Million) by Type (2018-2022)
7.1.1 Global Alternative Energy Revenue (USD Million), Market Share (%) by Type (2018-2022)
7.2 Global Alternative Energy Revenue (USD Million) by Applications (2018-2022)
7.2.1 Global Alternative Energy Revenue (USD Million), Market Share (%) by Applications (2018-2022)
8 Global Alternative Energy Development Regional Status and Outlook
8.1 Global Alternative Energy Revenue (USD Million) By Regions (2018-2022)
8.2 North America Alternative Energy Revenue (USD Million) by Type, and Application (2018-2022)
8.2.1 North America Alternative Energy Revenue (USD Million) by Country (2018-2022)
8.2.2 North America Alternative Energy Revenue (USD Million) by Type (2018-2022)
8.2.3 North America Alternative Energy Revenue (USD Million) by Applications (2018-2022)
8.3 Europe Alternative Energy Revenue (USD Million), by Type, and Applications (USD Million) (2018-2022)
8.3.1 Europe Alternative Energy Revenue (USD Million), by Country (2018-2022)
8.3.2 Europe Alternative Energy Revenue (USD Million) by Type (2018-2022)
8.3.3 Europe Alternative Energy Revenue (USD Million) by Applications (2018-2022)
8.4 Asia Pacific Alternative Energy Revenue (USD Million), and Revenue (USD Million) by Type, and Applications (2018-2022)
8.4.1 Asia Pacific Alternative Energy Revenue (USD Million) by Country (2018-2022)
8.4.2 Asia Pacific Alternative Energy Revenue (USD Million) by Type (2018-2022)
8.4.3 Asia Pacific Alternative Energy Revenue (USD Million) by Applications (2018-2022)
8.5 South America Alternative Energy Revenue (USD Million), by Type, and Applications (2018-2022)
8.5.1 South America Alternative Energy Revenue (USD Million), by Country (2018-2022)
8.5.2 South America Alternative Energy Revenue (USD Million) by Type (2018-2022)
8.5.3 South America Alternative Energy Revenue (USD Million) by Applications (2018-2022)
8.6 Middle East and Africa Alternative Energy Revenue (USD Million), by Type, Technology, Application, Thickness (2018-2022)
8.6.1 Middle East and Africa Alternative Energy Revenue (USD Million) by Country (2018-2022)
8.6.2 Middle East and Africa Alternative Energy Revenue (USD Million) by Type (2018-2022)
8.6.3 Middle East and Africa Alternative Energy Revenue (USD Million) by Applications (2018-2022)
9 Company Profiles
10 Global Alternative Energy Market Revenue (USD Million), by Type, and Applications (2023-2030)
10.1 Global Alternative Energy Revenue (USD Million) and Market Share (%) by Type (2023-2030)
10.1.1 Global Alternative Energy Revenue (USD Million), and Market Share (%) by Type (2023-2030)
10.2 Global Alternative Energy Revenue (USD Million) and Market Share (%) by Applications (2023-2030)
10.2.1 Global Alternative Energy Revenue (USD Million), and Market Share (%) by Applications (2023-2030)
11 Global Alternative Energy Development Regional Status and Outlook Forecast
11.1 Global Alternative Energy Revenue (USD Million) By Regions (2023-2030)
11.2 North America Alternative Energy Revenue (USD Million) by Type, and Applications (2023-2030)
11.2.1 North America Alternative Energy Revenue (USD) Million by Country (2023-2030)
11.2.2 North America Alternative Energy Revenue (USD Million), by Type (2023-2030)
11.2.3 North America Alternative Energy Revenue (USD Million), Market Share (%) by Applications (2023-2030)
11.3 Europe Alternative Energy Revenue (USD Million), by Type, and Applications (2023-2030)
11.3.1 Europe Alternative Energy Revenue (USD Million), by Country (2023-2030)
11.3.2 Europe Alternative Energy Revenue (USD Million), by Type (2023-2030)
11.3.3 Europe Alternative Energy Revenue (USD Million), by Applications (2023-2030)
11.4 Asia Pacific Alternative Energy Revenue (USD Million) by Type, and Applications (2023-2030)
11.4.1 Asia Pacific Alternative Energy Revenue (USD Million), by Country (2023-2030)
11.4.2 Asia Pacific Alternative Energy Revenue (USD Million), by Type (2023-2030)
11.4.3 Asia Pacific Alternative Energy Revenue (USD Million), by Applications (2023-2030)
11.5 South America Alternative Energy Revenue (USD Million), by Type, and Applications (2023-2030)
11.5.1 South America Alternative Energy Revenue (USD Million), by Country (2023-2030)
11.5.2 South America Alternative Energy Revenue (USD Million), by Type (2023-2030)
11.5.3 South America Alternative Energy Revenue (USD Million), by Applications (2023-2030)
11.6 Middle East and Africa Alternative Energy Revenue (USD Million), by Type, and Applications (2023-2030)
11.6.1 Middle East and Africa Alternative Energy Revenue (USD Million), by region (2023-2030)
11.6.2 Middle East and Africa Alternative Energy Revenue (USD Million), by Type (2023-2030)
11.6.3 Middle East and Africa Alternative Energy Revenue (USD Million), by Applications (2023-2030)
12 Methodology and Data Sources
12.1 Methodology/Research Approach
12.1.1 Research Programs/Design
12.1.2 Market Size Estimation
12.1.3 Market Breakdown and Data Triangulation
12.2 Data Sources
12.2.1 Secondary Sources
12.2.2 Primary Sources
12.3 Disclaimer
List of Tables
Table 1 Market Segmentation Analysis
Table 2 Global Alternative Energy Market Companies with Areas Served
Table 3 Products Offerings Global Alternative Energy Market
Table 4 Low Growth Scenario Forecasts
Table 5 Reference Case Growth Scenario
Table 6 High Growth Case Scenario
Table 7 Global Alternative Energy Revenue (USD Million) And CAGR (%) By Type (2018-2030)
Table 8 Global Alternative Energy Revenue (USD Million) And CAGR (%) By Applications (2018-2030)
Table 9 Global Alternative Energy Revenue (USD Million) And CAGR (%) By Regions (2018-2030)
Table 10 Global Alternative Energy Revenue (USD Million) By Type (2018-2022)
Table 11 Global Alternative Energy Revenue Market Share (%) By Type (2018-2022)
Table 12 Global Alternative Energy Revenue (USD Million) By Applications (2018-2022)
Table 13 Global Alternative Energy Revenue Market Share (%) By Applications (2018-2022)
Table 14 Global Alternative Energy Market Revenue (USD Million) By Regions (2018-2022)
Table 15 Global Alternative Energy Market Share (%) By Regions (2018-2022)
Table 16 North America Alternative Energy Revenue (USD Million) By Country (2018-2022)
Table 17 North America Alternative Energy Revenue (USD Million) By Type (2018-2022)
Table 18 North America Alternative Energy Revenue (USD Million) By Applications (2018-2022)
Table 19 Europe Alternative Energy Revenue (USD Million) By Country (2018-2022)
Table 20 Europe Alternative Energy Revenue (USD Million) By Type (2018-2022)
Table 21 Europe Alternative Energy Revenue (USD Million) By Applications (2018-2022)
Table 22 Asia Pacific Alternative Energy Revenue (USD Million) By Country (2018-2022)
Table 23 Asia Pacific Alternative Energy Revenue (USD Million) By Type (2018-2022)
Table 24 Asia Pacific Alternative Energy Revenue (USD Million) By Applications (2018-2022)
Table 25 South America Alternative Energy Revenue (USD Million) By Country (2018-2022)
Table 26 South America Alternative Energy Revenue (USD Million) By Type (2018-2022)
Table 27 South America Alternative Energy Revenue (USD Million) By Applications (2018-2022)
Table 28 Middle East and Africa Alternative Energy Revenue (USD Million) By Region (2018-2022)
Table 29 Middle East and Africa Alternative Energy Revenue (USD Million) By Type (2018-2022)
Table 30 Middle East and Africa Alternative Energy Revenue (USD Million) By Applications (2018-2022)
Table 31 Financial Analysis
Table 32 Global Alternative Energy Revenue (USD Million) By Type (2023-2030)
Table 33 Global Alternative Energy Revenue Market Share (%) By Type (2023-2030)
Table 34 Global Alternative Energy Revenue (USD Million) By Applications (2023-2030)
Table 35 Global Alternative Energy Revenue Market Share (%) By Applications (2023-2030)
Table 36 Global Alternative Energy Market Revenue (USD Million), And Revenue (USD Million) By Regions (2023-2030)
Table 37 North America Alternative Energy Revenue (USD)By Country (2023-2030)
Table 38 North America Alternative Energy Revenue (USD Million) By Type (2023-2030)
Table 39 North America Alternative Energy Revenue (USD Million) By Applications (2023-2030)
Table 40 Europe Alternative Energy Revenue (USD Million) By Country (2023-2030)
Table 41 Europe Alternative Energy Revenue (USD Million) By Type (2023-2030)
Table 42 Europe Alternative Energy Revenue (USD Million) By Applications (2023-2030)
Table 43 Asia Pacific Alternative Energy Revenue (USD Million) By Country (2023-2030)
Table 44 Asia Pacific Alternative Energy Revenue (USD Million) By Type (2023-2030)
Table 45 Asia Pacific Alternative Energy Revenue (USD Million) By Applications (2023-2030)
Table 46 South America Alternative Energy Revenue (USD Million) By Country (2023-2030)
Table 47 South America Alternative Energy Revenue (USD Million) By Type (2023-2030)
Table 48 South America Alternative Energy Revenue (USD Million) By Applications (2023-2030)
Table 49 Middle East and Africa Alternative Energy Revenue (USD Million) By Region (2023-2030)
Table 50 Middle East and Africa Alternative Energy Revenue (USD Million) By Region (2023-2030)
Table 51 Middle East and Africa Alternative Energy Revenue (USD Million) By Type (2023-2030)
Table 52 Middle East and Africa Alternative Energy Revenue (USD Million) By Applications (2023-2030)
Table 53 Research Programs/Design for This Report
Table 54 Key Data Information from Secondary Sources
Table 55 Key Data Information from Primary Sources
List of Figures
Figure 1 Market Scope
Figure 2 Porter’s Five Forces
Figure 3 Global Alternative Energy Revenue (USD Million) By Type (2018-2022)
Figure 4 Global Alternative Energy Revenue Market Share (%) By Type (2022)
Figure 5 Global Alternative Energy Revenue (USD Million) By Applications (2018-2022)
Figure 6 Global Alternative Energy Revenue Market Share (%) By Applications (2022)
Figure 7 Global Alternative Energy Market Revenue (USD Million) By Regions (2018-2022)
Figure 8 Global Alternative Energy Market Share (%) By Regions (2022)
Figure 9 North America Alternative Energy Revenue (USD Million) By Country (2018-2022)
Figure 10 North America Alternative Energy Revenue (USD Million) By Type (2018-2022)
Figure 11 North America Alternative Energy Revenue (USD Million) By Applications (2018-2022)
Figure 12 Europe Alternative Energy Revenue (USD Million) By Country (2018-2022)
Figure 13 Europe Alternative Energy Revenue (USD Million) By Type (2018-2022)
Figure 14 Europe Alternative Energy Revenue (USD Million) By Applications (2018-2022)
Figure 15 Asia Pacific Alternative Energy Revenue (USD Million) By Country (2018-2022)
Figure 16 Asia Pacific Alternative Energy Revenue (USD Million) By Type (2018-2022)
Figure 17 Asia Pacific Alternative Energy Revenue (USD Million) By Applications (2018-2022)
Figure 18 South America Alternative Energy Revenue (USD Million) By Country (2018-2022)
Figure 19 South America Alternative Energy Revenue (USD Million) By Type (2018-2022)
Figure 20 South America Alternative Energy Revenue (USD Million) By Applications (2018-2022)
Figure 21 Middle East and Africa Alternative Energy Revenue (USD Million) By Region (2018-2022)
Figure 22 Middle East and Africa Alternative Energy Revenue (USD Million) By Type (2018-2022)
Figure 23 Middle East and Africa Alternative Energy Revenue (USD Million) By Applications (2018-2022)
Figure 24 Global Alternative Energy Revenue (USD Million) By Type (2023-2030)
Figure 25 Global Alternative Energy Revenue Market Share (%) By Type (2030)
Figure 26 Global Alternative Energy Revenue (USD Million) By Applications (2023-2030)
Figure 27 Global Alternative Energy Revenue Market Share (%) By Applications (2030)
Figure 28 Global Alternative Energy Market Revenue (USD Million) By Regions (2023-2030)
Figure 29 North America Alternative Energy Revenue (USD Million) By Country (2023-2030)
Figure 30 North America Alternative Energy Revenue (USD Million) By Type (2023-2030)
Figure 31 North America Alternative Energy Revenue (USD Million) By Applications (2023-2030)
Figure 32 Europe Alternative Energy Revenue (USD Million) By Country (2023-2030)
Figure 33 Europe Alternative Energy Revenue (USD Million) By Type (2023-2030)
Figure 34 Europe Alternative Energy Revenue (USD Million) By Applications (2023-2030)
Figure 35 Asia Pacific Alternative Energy Revenue (USD Million) By Country (2023-2030)
Figure 36 Asia Pacific Alternative Energy Revenue (USD Million) By Type (2023-2030)
Figure 37 Asia Pacific Alternative Energy Revenue (USD Million) By Applications (2023-2030)
Figure 38 South America Alternative Energy Revenue (USD Million) By Country (2023-2030)
Figure 39 South America Alternative Energy Revenue (USD Million) By Type (2023-2030)
Figure 40 South America Alternative Energy Revenue (USD Million) By Applications (2023-2030)
Figure 41 Middle East and Africa Alternative Energy Revenue (USD Million) By Region (2023-2030)
Figure 42 Middle East and Africa Alternative Energy Revenue (USD Million) By Region (2023-2030)
Figure 43 Middle East and Africa Alternative Energy Revenue (USD Million) By Type (2023-2030)
Figure 44 Middle East and Africa Alternative Energy Revenue (USD Million) By Applications (2023-2030)
Figure 45 Bottom-Up and Top-Down Approaches for This Report
Figure 46 Data Triangulation
