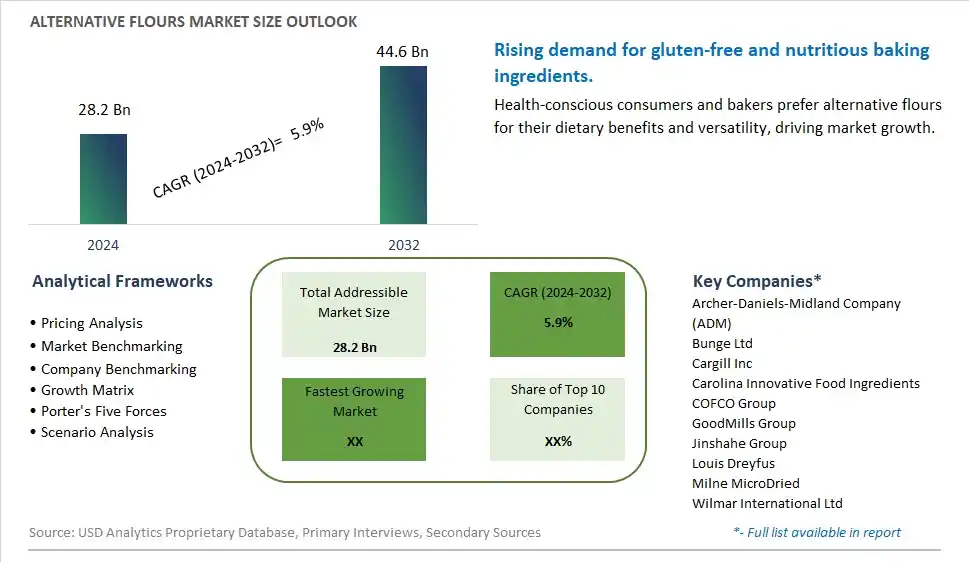
Global Alternative Flours Market Size is valued at $28.2 Billion in 2024 and is forecast to register a growth rate (CAGR) of 5.9% to reach $44.6 Billion by 2032.
The global Alternative Flours Market Comprehensive Study analyzes and forecasts the market size across 6 regions and 24 countries for diverse segments -By Product (Corn Flour, Rice Flour, Sweet Potato Flour, Quinoa Flour, Others), By Type (Organic, Conventional), By Distribution Channel (Supermarkets/Hypermarkets, Convenience Stores, Online Retail, Others)
An Introduction to Alternative Flours Market
The Alternative Flours market in 2024 is witnessing robust growth, driven by the rising consumer demand for gluten-free, nutrient-dense, and versatile baking options. Alternative flours, derived from sources such as almonds, coconut, chickpeas, and quinoa, are gaining popularity for their health benefits and suitability for special diets, including gluten-free, paleo, and keto. The market is supported by increasing health consciousness and the trend towards plant-based and whole food ingredients. Innovations in processing and formulation are enhancing the texture, flavor, and nutritional profile of alternative flours, expanding their application in various culinary and baking products.
Alternative Flours Competitive Landscape
The market report analyses the leading companies in the industry including Archer-Daniels-Midland Company (ADM), Bunge Ltd, Cargill Inc, Carolina Innovative Food Ingredients, COFCO Group, GoodMills Group, Jinshahe Group, Louis Dreyfus, Milne MicroDried, Wilmar International Ltd, and Others.
Alternative Flours Market Dynamics
Alternative Flours Market Trend: Growing Popularity of Gluten-Free and Health-Conscious Diets
The most prominent trend in the alternative flours market is the growing popularity of gluten-free and health-conscious diets. As more consumers become aware of gluten sensitivities and the benefits of diverse, nutrient-rich ingredients, there is an increasing demand for alternative flours such as almond, coconut, chickpea, and oat flours. These flours offer unique nutritional profiles, catering to various dietary needs and preferences, including low-carb, paleo, and vegan diets. This trend is driven by a broader movement towards healthier eating habits and the desire for more natural and less processed food options.
Alternative Flours Market Driver: Rise in Food Allergies and Intolerances
The primary driver for the alternative flours market is the rise in food allergies and intolerances. With a significant portion of the population experiencing gluten intolerance or celiac disease, traditional wheat flour is no longer suitable for many consumers. Alternative flours provide a solution for those who need or prefer to avoid gluten, as well as for those looking for more nutritious and diverse flour options. This increase in awareness and diagnosis of food allergies and intolerances has led to a surge in demand for alternative flours, fueling market growth.
Alternative Flours Market Opportunity: Innovation in Baking and Cooking Applications
A significant opportunity in the alternative flours market lies in innovation within baking and cooking applications. As consumers and food manufacturers explore the versatility of alternative flours, there is substantial potential for creating new and exciting products that leverage the unique properties of these ingredients. From gluten-free breads and pastries to nutrient-dense snack bars and pasta, the possibilities are vast. Additionally, the growing interest in home baking, driven by the desire for healthier and more personalized food choices, offers a lucrative market for developing and marketing alternative flour-based baking mixes and recipes.
Alternative Flours Market Share Analysis: Rice Flour segment generated the highest revenue share in the industry
The Rice Flour segment emerges as the largest in the Alternative Flours market, showcasing substantial growth and widespread consumer adoption. Rice flour is a versatile alternative to traditional wheat flour, offering gluten-free properties suitable for individuals with gluten sensitivities or celiac disease. It is widely used in various culinary applications, including baking, cooking, and as a thickening agent in sauces and soups. The popularity of rice flour is also attributed to its neutral flavor profile, which makes it suitable for a wide range of recipes and cuisines. Additionally, rice flour's nutritional profile, rich in carbohydrates, vitamins, and minerals, further enhances its appeal among health-conscious consumers. With the growing demand for gluten-free and alternative flour options, coupled with continuous innovations in rice flour processing techniques and product formulations, the Rice Flour segment is poised to maintain its market leadership and drive significant growth in the Alternative Flours market.
Alternative Flours Market Share Analysis: Organic Alternative Flours is the fastest growing segment over the forecast period to 2032
The Organic Alternative Flours segment is poised for rapid growth in the Alternative Flours market leading up to 2032. This segment's accelerated expansion is driven by several key factors. Firstly, there's a growing global trend towards organic and natural food products, with consumers increasingly prioritizing health, sustainability, and environmental consciousness. Organic alternative flours are produced without synthetic pesticides, fertilizers, or genetically modified organisms (GMOs), making them a healthier and environmentally friendly choice. The demand for organic flours is further boosted by the rising prevalence of gluten sensitivities and allergies, prompting consumers to seek gluten-free and clean-label alternatives. Further, the organic certification adds value to these flours, signaling quality, authenticity, and adherence to stringent organic standards. With consumers willing to pay a premium for organic products and the continuous expansion of organic farming practices, the Organic Alternative Flours segment is positioned to experience exponential growth and emerge as a dominant force within the Alternative Flours market by 2032.
Alternative Flours Market Share Analysis: Supermarkets/Hypermarket s segment generated the highest revenue share in the industry
The Supermarkets/Hypermarkets segment emerges as the largest in the Alternative Flours Market, showcasing substantial growth and widespread consumer accessibility. Supermarkets and hypermarkets offer a wide range of alternative flours under one roof, making them a convenient shopping destination for consumers seeking diverse flour options. These retail channels provide visibility and shelf space for alternative flours, enabling consumers to compare brands, prices, and product attributes easily. Further, supermarkets and hypermarkets often run promotions, discounts, and product demonstrations, further driving consumer awareness and purchase decisions. The convenience of one-stop shopping, coupled with the assurance of quality and variety, makes supermarkets/hypermarkets the preferred distribution channel for alternative flours. With the continuous expansion and modernization of retail infrastructure, coupled with evolving consumer preferences for healthy and specialty food products, the Supermarkets/Hypermarkets segment is poised to maintain its market leadership and drive significant growth in the Alternative Flours market.
Alternative Flours Market Segmentation
By Product
Corn Flour
Rice Flour
Sweet Potato Flour
Quinoa Flour
Others
By Type
Organic
Conventional
By Distribution Channel
Supermarkets/Hypermarkets
Convenience Stores
Online Retail
Others
Countries Analyzed
North America (US, Canada, Mexico)
Europe (Germany, UK, France, Spain, Italy, Russia, Rest of Europe)
Asia Pacific (China, India, Japan, South Korea, Australia, South East Asia, Rest of Asia)
South America (Brazil, Argentina, Rest of South America)
Middle East and Africa (Saudi Arabia, UAE, Rest of Middle East, South Africa, Egypt, Rest of Africa)
Alternative Flours Companies Profiled in the Study
Archer-Daniels-Midland Company (ADM)
Bunge Ltd
Cargill Inc
Carolina Innovative Food Ingredients
COFCO Group
GoodMills Group
Jinshahe Group
Louis Dreyfus
Milne MicroDried
Wilmar International Ltd
*- List Not Exhaustive
Chapter 1. TABLE OF CONTENTS
Chapter 2. Introduction to Alternative Flours Market
2.1. Market Overview
2.2. Key Statistics and Report Highlights
2.3. Scope of the Comprehensive Study
2.3.1. Market Definition
2.3.2 Countries and Regions Covered
2.3.3 Research Objective
2.3.4 Units, Currency, and Conversions
2.3.5 Industry Value Chain
2.4. Key Market Segments
2.5. Key Companies
2.6. Study Period
Chapter 3. Strategic Analysis Review
3.1. Alternative Flours Pricing Analysis and Forecast
3.2. Porter’s Five Forces
3.3. Market Ecosystem
3.4. SWOT Analysis
3.5. Regulatory Scenario
3.3. Effects of Inflation, Russia-Ukraine War, moderating economic growth, and other macroeconomic factors
Chapter 4. Competitive Landscape
4.1. Market Share Analysis
4.1.1. Global Alternative Flours Market Share by Company, 2023
4.1.2. Product Offerings of Leading Alternative Flours Companies
4.2. Market Entropy
4.2.1. New Product Launches in the Industry
4.2.2. Mergers, Acquisitions, Joint ventures, and Partnerships
4.3. Key Strategies and Best Practices
Chapter 5. Global Market Projections: Best, Reference, and Low Case Scenarios
5.1. Growth Analysis- Case Scenario Definitions
5.2. Low Growth Case Scenario Forecasts
5.3. Reference Growth Case Scenario Forecasts
5.4. High Growth Case Scenario Forecasts
Chapter 6. Market Dynamics
6.1. Alternative Flours Market Drivers
6.2. Alternative Flours Market Challenges
6.6. Alternative Flours Market Opportunities
6.4. Alternative Flours Market Trends
Chapter 7. Global Alternative Flours Market Outlook Trends
7.1. Global Alternative Flours Revenue (USD Million) and CAGR (%) by Type (2021-2032)
7.2. Global Alternative Flours Revenue (USD Million) and CAGR (%) by Application (2021-2032)
7.3. Global Alternative Flours Revenue (USD Million) and CAGR (%) by Product (2021-2032)
By Product
Corn Flour
Rice Flour
Sweet Potato Flour
Quinoa Flour
Others
By Type
Organic
Conventional
By Distribution Channel
Supermarkets/Hypermarkets
Convenience Stores
Online Retail
Others
Chapter 8. Global Alternative Flours Regional Analysis and Outlook
8.1. Global Alternative Flours Revenue (USD Million) By Regions (2021- 2032)
8.2. North America Alternative Flours Revenue (USD Million) by Country (2021-2032)
8.2.1. United States Alternative Flours Regional Analysis and Outlook
8.2.2. Canada Alternative Flours Regional Analysis and Outlook
8.2.3. Mexico Alternative Flours Regional Analysis and Outlook
8.3. Europe Alternative Flours Revenue (USD Million), by Country (2021-2032)
8.3.1. Germany Alternative Flours Regional Analysis and Outlook
8.3.2. France Alternative Flours Regional Analysis and Outlook
8.3.3. United Kingdom Alternative Flours Regional Analysis and Outlook
8.3.4. Spain Alternative Flours Regional Analysis and Outlook
8.3.5. Italy Alternative Flours Regional Analysis and Outlook
8.3.6. Russia Alternative Flours Regional Analysis and Outlook
8.3.7. Rest of Europe Alternative Flours Regional Analysis and Outlook
8.4. Asia Pacific Alternative Flours Revenue (USD Million) by Country (2021-2032)
8.4.1. China Alternative Flours Regional Analysis and Outlook
8.4.2. Japan Alternative Flours Regional Analysis and Outlook
8.4.3. India Alternative Flours Regional Analysis and Outlook
8.4.4. South Korea Alternative Flours Regional Analysis and Outlook
8.4.5. Australia Alternative Flours Regional Analysis and Outlook
8.4.6. South East Asia Alternative Flours Regional Analysis and Outlook
8.4.7. Rest of Asia Pacific Alternative Flours Regional Analysis and Outlook
8.5. South America Alternative Flours Revenue (USD Million), by Country (2021-2032)
8.5.1. Brazil Alternative Flours Regional Analysis and Outlook
8.5.2. Argentina Alternative Flours Regional Analysis and Outlook
8.5.3. Rest of South America Alternative Flours Regional Analysis and Outlook
8.6. Middle East and Africa Alternative Flours Revenue (USD Million) by Country (2021-2032)
8.6.1. Middle East Alternative Flours Regional Analysis and Outlook
8.6.2. Africa Alternative Flours Regional Analysis and Outlook
Chapter 9. North America Alternative Flours Analysis and Outlook
9.1. North America Alternative Flours Revenue (USD Million) by Segments (2021-2032)
9.1.1. North America Alternative Flours Revenue (USD Million) by Type (2021-2032)
9.1.2. North America Alternative Flours Revenue (USD Million) by Application (2021-2032)
9.1.3. North America Alternative Flours Revenue (USD Million) by Product (2021-2032)
By Product
Corn Flour
Rice Flour
Sweet Potato Flour
Quinoa Flour
Others
By Type
Organic
Conventional
By Distribution Channel
Supermarkets/Hypermarkets
Convenience Stores
Online Retail
Others
Chapter 10. Europe Alternative Flours Analysis and Outlook
10.1. Europe Alternative Flours Revenue (USD Million), by Segments (USD Million) (2021-2032)
10.1.1. Europe Alternative Flours Revenue (USD Million) by Type (2021-2032)
10.1.2. Europe Alternative Flours Revenue (USD Million) by Application (2021-2032)
10.1.3. Europe Alternative Flours Revenue (USD Million) by Product (2021-2032)
By Product
Corn Flour
Rice Flour
Sweet Potato Flour
Quinoa Flour
Others
By Type
Organic
Conventional
By Distribution Channel
Supermarkets/Hypermarkets
Convenience Stores
Online Retail
Others
Chapter 11. Asia Pacific Alternative Flours Analysis and Outlook
11.1. Asia Pacific Alternative Flours Revenue (USD Million), and Revenue (USD Million) by Segments (2021-2032)
11.1.1. Asia Pacific Alternative Flours Revenue (USD Million) by Type (2021-2032)
11.1.2. Asia Pacific Alternative Flours Revenue (USD Million) by Application (2021-2032)
11.1.3. Asia Pacific Alternative Flours Revenue (USD Million) by Product (2021-2032)
By Product
Corn Flour
Rice Flour
Sweet Potato Flour
Quinoa Flour
Others
By Type
Organic
Conventional
By Distribution Channel
Supermarkets/Hypermarkets
Convenience Stores
Online Retail
Others
Chapter 12. South America Alternative Flours Analysis and Outlook
12.1. South America Alternative Flours Revenue (USD Million), by Segments (2021-2032)
12.1.1. South America Alternative Flours Revenue (USD Million) by Type (2021-2032)
12.1.2. South America Alternative Flours Revenue (USD Million) by Application (2021-2032)
12.1.3. South America Alternative Flours Revenue (USD Million) by Product (2021-2032)
By Product
Corn Flour
Rice Flour
Sweet Potato Flour
Quinoa Flour
Others
By Type
Organic
Conventional
By Distribution Channel
Supermarkets/Hypermarkets
Convenience Stores
Online Retail
Others
Chapter 13. Middle East and Africa Alternative Flours Analysis and Outlook
13.1. Middle East and Africa Alternative Flours Revenue (USD Million), by Segments (2021-2032)
13.1.1. Middle East and Africa Alternative Flours Revenue (USD Million) by Type (2021-2032)
13.1.2. Middle East and Africa Alternative Flours Revenue (USD Million) by Application (2021-2032)
13.1.3. Middle East and Africa Alternative Flours Revenue (USD Million) by Product (2021-2032)
By Product
Corn Flour
Rice Flour
Sweet Potato Flour
Quinoa Flour
Others
By Type
Organic
Conventional
By Distribution Channel
Supermarkets/Hypermarkets
Convenience Stores
Online Retail
Others
Chapter 14. Alternative Flours Company Profiles
14.1 Business Overview
14.2 Product Profiles
14.3 SWOT Profiles
14.5 Recent Developments
14.6 Financial Profile
List of Companies
Archer-Daniels-Midland Company (ADM)
Bunge Ltd
Cargill Inc
Carolina Innovative Food Ingredients
COFCO Group
GoodMills Group
Jinshahe Group
Louis Dreyfus
Milne MicroDried
Wilmar International Ltd
15. Methodology and Data Sources
15.1 Customization Offerings
15.2 Subscription Services
15.3 Related Reports
15.4 Publisher Expertise
LIST OF TABLES
Table 1 Market Segmentation Analysis
Table 2 Global Alternative Flours Market Share of Leading Companies, 2023
Table 3 Product Offerings of Leading Companies
Table 4 Low Growth Scenario Forecasts
Table 5 Reference Case Growth Scenario
Table 6 High Growth Case Scenario
Table 7 Global Alternative Flours Revenue (USD Million) And CAGR (%) By Type (2021-2032)
Table 8 Global Alternative Flours Revenue (USD Million) And CAGR (%) By Application (2021-2032)
Table 9 Global Alternative Flours Revenue (USD Million) And CAGR (%) By Product (2021-2032)
Table 10 Global Alternative Flours Market Revenue (USD Million) By Regions (2021-2032)
Table 11 Global Alternative Flours Market Share (%) By Regions (2021-2032)
Table 12 North America Alternative Flours Revenue (USD Million) By Country (2021-2032)
Table 13 Europe Alternative Flours Revenue (USD Million) By Country (2021-2032)
Table 14 Asia Pacific Alternative Flours Revenue (USD Million) By Country (2021-2032)
Table 15 South America Alternative Flours Revenue (USD Million) By Country (2021-2032)
Table 16 Middle East and Africa Alternative Flours Revenue (USD Million) By Region (2021-2032)
Table 17 North America Alternative Flours Revenue (USD Million) By Type (2021-2032)
Table 18 North America Alternative Flours Revenue (USD Million) By Application (2021-2032)
Table 19 North America Alternative Flours Revenue (USD Million) By Product (2021-2032)
Table 20 Europe Alternative Flours Revenue (USD Million) By Type (2021-2032)
Table 21 Europe Alternative Flours Revenue (USD Million) By Application (2021-2032)
Table 22 Europe Alternative Flours Revenue (USD Million) By Product (2021-2032)
Table 23 Asia Pacific Alternative Flours Revenue (USD Million) By Type (2021-2032)
Table 24 Asia Pacific Alternative Flours Revenue (USD Million) By Application (2021-2032)
Table 25 Asia Pacific Alternative Flours Revenue (USD Million) By Product (2021-2032)
Table 26 South America Alternative Flours Revenue (USD Million) By Type (2021-2032)
Table 27 South America Alternative Flours Revenue (USD Million) By Application (2021-2032)
Table 28 South America Alternative Flours Revenue (USD Million) By Product (2021-2032)
Table 29 Middle East and Africa Alternative Flours Revenue (USD Million) By Type (2021-2032)
Table 30 Middle East and Africa Alternative Flours Revenue (USD Million) By Application (2021-2032)
Table 31 Middle East and Africa Alternative Flours Revenue (USD Million) By Product (2021-2032)
LIST OF FIGURES
Figure 1. Market Scope
Figure 2. Pricing Forecasts Per Unit, 2023- 2032
Figure 3. Porter’s Five Forces
Figure 4. Global Alternative Flours Market Revenue (USD Million) By Regions (2021-2032)
Figure 5. Global Alternative Flours Market Share (%) By Regions (2023)
Figure 6. North America Alternative Flours Revenue (USD Million) By Country (2021-2032)
Figure 7. United States Alternative Flours Revenue (USD Million) By Country (2021-2032)
Figure 8. Canada Alternative Flours Revenue (USD Million) By Country (2021-2032)
Figure 9. Mexico Alternative Flours Revenue (USD Million) By Country (2021-2032)
Figure 10. Europe Alternative Flours Revenue (USD Million) By Country (2021-2032)
Figure 11. Germany Alternative Flours Revenue (USD Million) By Country (2021-2032)
Figure 12. France Alternative Flours Revenue (USD Million) By Country (2021-2032)
Figure 13. United Kingdom Alternative Flours Revenue (USD Million) By Country (2021-2032)
Figure 14. Spain Alternative Flours Revenue (USD Million) By Country (2021-2032)
Figure 15. Italy Alternative Flours Revenue (USD Million) By Country (2021-2032)
Figure 16. Russia Alternative Flours Revenue (USD Million) By Country (2021-2032)
Figure 17. Rest of Europe Alternative Flours Revenue (USD Million) By Country (2021-2032)
Figure 11. Asia Pacific Alternative Flours Revenue (USD Million) By Country (2021-2032)
Figure 12. China Alternative Flours Revenue (USD Million) By Country (2021-2032)
Figure 13. Japan Alternative Flours Revenue (USD Million) By Country (2021-2032)
Figure 14. India Alternative Flours Revenue (USD Million) By Country (2021-2032)
Figure 15. South Korea Alternative Flours Revenue (USD Million) By Country (2021-2032)
Figure 16. Australia Alternative Flours Revenue (USD Million) By Country (2021-2032)
Figure 17. South East Asia Alternative Flours Revenue (USD Million) By Country (2021-2032)
Figure 18. South America Alternative Flours Revenue (USD Million) By Country (2021-2032)
Figure 19. Brazil Alternative Flours Revenue (USD Million) By Country (2021-2032)
Figure 20. Argentina Alternative Flours Revenue (USD Million) By Country (2021-2032)
Figure 21. Rest of Asia Pacific Alternative Flours Revenue (USD Million) By Country (2021-2032)
Figure 22. Middle East and Africa Alternative Flours Revenue (USD Million) By Region (2021-2032)
Figure 23. Saudi Arabia Alternative Flours Revenue (USD Million) By Region (2021-2032)
Figure 24. The UAE Alternative Flours Revenue (USD Million) By Region (2021-2032)
Figure 25. Rest of Middle East Alternative Flours Revenue (USD Million) By Region (2021-2032)
Figure 26. South Africa Alternative Flours Revenue (USD Million) By Region (2021-2032)
Figure 27. Africa Alternative Flours Revenue (USD Million) By Region (2021-2032)
Figure 28. North America Alternative Flours Revenue (USD Million) By Type (2021-2032)
Figure 29. North America Alternative Flours Revenue (USD Million) By Application (2021-2032)
Figure 30. North America Alternative Flours Revenue (USD Million) By Product (2021-2032)
Figure 31. Europe Alternative Flours Revenue (USD Million) By Type (2021-2032)
Figure 32. Europe Alternative Flours Revenue (USD Million) By Application (2021-2032)
Figure 33. Europe Alternative Flours Revenue (USD Million) By Product (2021-2032)
Figure 34. Asia Pacific Alternative Flours Revenue (USD Million) By Type (2021-2032)
Figure 35. Asia Pacific Alternative Flours Revenue (USD Million) By Application (2021-2032)
Figure 36. Asia Pacific Alternative Flours Revenue (USD Million) By Product (2021-2032)
Figure 37. South America Alternative Flours Revenue (USD Million) By Type (2021-2032)
Figure 38. South America Alternative Flours Revenue (USD Million) By Application (2021-2032)
Figure 39. South America Alternative Flours Revenue (USD Million) By Product (2021-2032)
Figure 40. Middle East and Africa Alternative Flours Revenue (USD Million) By Type (2021-2032)
Figure 41. Middle East and Africa Alternative Flours Revenue (USD Million) By Application (2021-2032)
Figure 42. Middle East and Africa Alternative Flours Revenue (USD Million) By Product (2021-2032)
By Product
Corn Flour
Rice Flour
Sweet Potato Flour
Quinoa Flour
Others
By Type
Organic
Conventional
By Distribution Channel
Supermarkets/Hypermarkets
Convenience Stores
Online Retail
Others
Countries Analyzed
North America (US, Canada, Mexico)
Europe (Germany, UK, France, Spain, Italy, Russia, Rest of Europe)
Asia Pacific (China, India, Japan, South Korea, Australia, South East Asia, Rest of Asia)
South America (Brazil, Argentina, Rest of South America)
Middle East and Africa (Saudi Arabia, UAE, Rest of Middle East, South Africa, Egypt, Rest of Africa)
