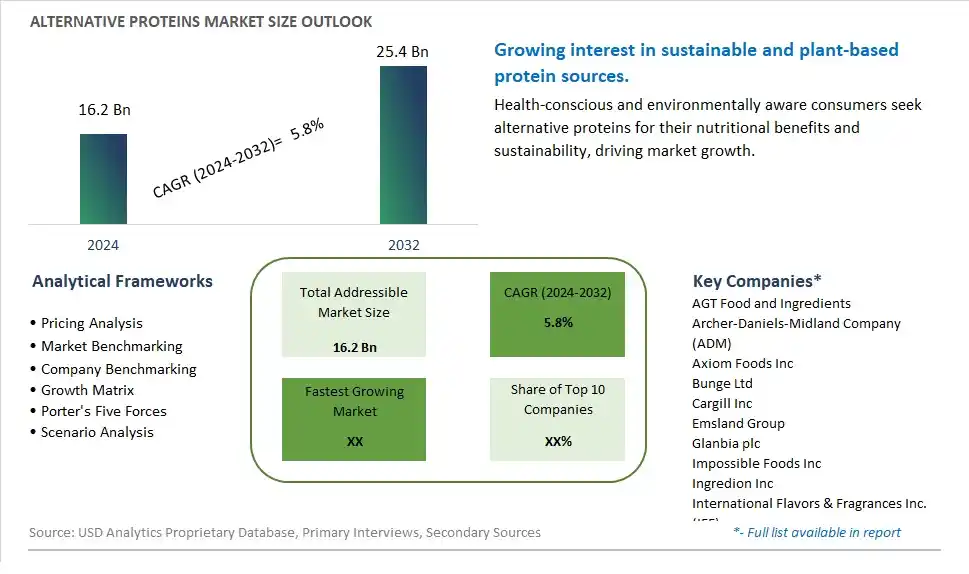
Global Alternative Proteins Market Size is valued at $16.2 Billion in 2024 and is forecast to register a growth rate (CAGR) of 5.8% to reach $25.4 Billion by 2032.
The global Alternative Proteins Market Comprehensive Study analyzes and forecasts the market size across 6 regions and 24 countries for diverse segments -By Product (Plant Protein, -Cereals, -Oats, -Legumes, -Roots, -Ancient Grains, -Nuts & Seeds, Microbe-based Protein, -Algae, -Bacteria, -Yeast, -Fungi, Insect Protein, -Coleoptera, -Lepidoptera, -Hymnoptera, -Orthoptera, -Hemiptera, -Diptera, -Others), By Application (Food & Beverages, Clinical Nutrition, Animal Feed, Infant Formulation, Others)
An Introduction to Alternative Proteins Market
The Alternative Proteins market in 2024 is booming, fueled by the growing demand for sustainable, ethical, and health-conscious protein sources. Alternative proteins, including plant-based, insect-based, and lab-grown options, are increasingly used in a wide range of food products such as meat substitutes, dairy alternatives, and protein supplements. The market is supported by rising consumer awareness of the environmental impact of traditional animal farming and the health benefits of plant-based diets. Advances in food technology and biotechnology are improving the taste, texture, and nutritional content of alternative proteins, making them more appealing and accessible to mainstream consumers.
Alternative Proteins Competitive Landscape
The market report analyses the leading companies in the industry including AGT Food and Ingredients, Archer-Daniels-Midland Company (ADM), Axiom Foods Inc, Bunge Ltd, Cargill Inc, Emsland Group, Glanbia plc, Impossible Foods Inc, Ingredion Inc, International Flavors & Fragrances Inc. (IFF), Kerry Group Plc, Lightlife Foods Inc, SunOpta Inc, Tate & Lyle PLC, and Others.
Alternative Proteins Market Dynamics
Market Trend: Growing Popularity of Gluten-Free and Health-Conscious Diets
The most prominent trend in the alternative flours market is the growing popularity of gluten-free and health-conscious diets. As more consumers become aware of gluten sensitivities and the benefits of diverse, nutrient-rich ingredients, there is an increasing demand for alternative flours such as almond, coconut, chickpea, and oat flours. These flours offer unique nutritional profiles, catering to various dietary needs and preferences, including low-carb, paleo, and vegan diets. This trend is driven by a broader movement towards healthier eating habits and the desire for more natural and less processed food options.
Market Driver: Rise in Food Allergies and Intolerances
The primary driver for the alternative flours market is the rise in food allergies and intolerances. With a significant portion of the population experiencing gluten intolerance or celiac disease, traditional wheat flour is no longer suitable for many consumers. Alternative flours provide a solution for those who need or prefer to avoid gluten, as well as for those looking for more nutritious and diverse flour options. This increase in awareness and diagnosis of food allergies and intolerances has led to a surge in demand for alternative flours, fueling market growth.
Market Opportunity: Innovation in Baking and Cooking Applications
A significant opportunity in the alternative flours market lies in innovation within baking and cooking applications. As consumers and food manufacturers explore the versatility of alternative flours, there is substantial potential for creating new and exciting products that leverage the unique properties of these ingredients. From gluten-free breads and pastries to nutrient-dense snack bars and pasta, the possibilities are vast. Additionally, the growing interest in home baking, driven by the desire for healthier and more personalized food choices, offers a lucrative market for developing and marketing alternative flour-based baking mixes and recipes.
Alternative Proteins Market Share Analysis: Plant Protein segment generated the highest revenue share in the industry
The Plant Protein segment stands out as the largest in the Alternative Proteins Market, showcasing significant growth and widespread adoption. Plant-based proteins, derived from sources such as cereals, oats, legumes, roots, ancient grains, nuts, and seeds, have gained immense popularity due to their nutritional benefits, environmental sustainability, and versatility in various food products. Consumers are increasingly embracing plant-based diets for health reasons, ethical considerations, and environmental concerns, driving the demand for plant protein alternatives. Further, advancements in food technology and processing techniques have led to the development of innovative plant protein formulations that mimic the taste, texture, and functionality of animal-based proteins, further expanding their market appeal. With the growing consumer shift towards plant-based eating and the continuous introduction of new plant protein sources and products, the Plant Protein segment is positioned to maintain its market leadership and drive substantial growth in the Alternative Proteins market.
Alternative Proteins Market Share Analysis: Food & Beverages is the fastest growing segment over the forecast period to 2032
The Food & Beverages segment within the Alternative Proteins Market is poised for rapid growth leading up to 2032. This segment's accelerated expansion is driven by several key factors. Firstly, there's a global trend towards plant-based diets and the increasing consumer awareness of the health and environmental benefits associated with alternative proteins. Food and beverage companies are incorporating alternative proteins into a wide range of products, including plant-based burgers, dairy alternatives, snacks, and beverages, to meet the growing demand from vegetarian, vegan, and flexitarian consumers. Further, the rising prevalence of lifestyle-related health conditions and the focus on sustainable food production are driving the adoption of alternative proteins in mainstream food and beverage offerings. The Food & Beverages segment also benefits from continuous innovations in ingredient formulations, flavor profiles, and product packaging, enhancing their appeal and driving consumer acceptance. With the growing consumer demand for healthier, sustainable, and plant-based food options, the Food & Beverages segment is positioned to experience exponential growth and emerge as a dominant force within the Alternative Proteins market by 2032.
Alternative Proteins Market Segmentation
By Product
Plant Protein
-Cereals
-Oats
-Legumes
-Roots
-Ancient Grains
-Nuts & Seeds
Microbe-based Protein
-Algae
-Bacteria
-Yeast
-Fungi
Insect Protein
-Coleoptera
-Lepidoptera
-Hymnoptera
-Orthoptera
-Hemiptera
-Diptera
-Others
By Application
Food & Beverages
Clinical Nutrition
Animal Feed
Infant Formulation
Others
Countries Analyzed
North America (US, Canada, Mexico)
Europe (Germany, UK, France, Spain, Italy, Russia, Rest of Europe)
Asia Pacific (China, India, Japan, South Korea, Australia, South East Asia, Rest of Asia)
South America (Brazil, Argentina, Rest of South America)
Middle East and Africa (Saudi Arabia, UAE, Rest of Middle East, South Africa, Egypt, Rest of Africa)
Alternative Proteins Companies Profiled in the Study
AGT Food and Ingredients
Archer-Daniels-Midland Company (ADM)
Axiom Foods Inc
Bunge Ltd
Cargill Inc
Emsland Group
Glanbia plc
Impossible Foods Inc
Ingredion Inc
International Flavors & Fragrances Inc. (IFF)
Kerry Group Plc
Lightlife Foods Inc
SunOpta Inc
Tate & Lyle PLC
*- List Not Exhaustive
Chapter 1. TABLE OF CONTENTS
Chapter 2. Introduction to Alternative Proteins Market
2.1. Market Overview
2.2. Key Statistics and Report Highlights
2.3. Scope of the Comprehensive Study
2.3.1. Market Definition
2.3.2 Countries and Regions Covered
2.3.3 Research Objective
2.3.4 Units, Currency, and Conversions
2.3.5 Industry Value Chain
2.4. Key Market Segments
2.5. Key Companies
2.6. Study Period
Chapter 3. Strategic Analysis Review
3.1. Alternative Proteins Pricing Analysis and Forecast
3.2. Porter’s Five Forces
3.3. Market Ecosystem
3.4. SWOT Analysis
3.5. Regulatory Scenario
3.3. Effects of Inflation, Russia-Ukraine War, moderating economic growth, and other macroeconomic factors
Chapter 4. Competitive Landscape
4.1. Market Share Analysis
4.1.1. Global Alternative Proteins Market Share by Company, 2023
4.1.2. Product Offerings of Leading Alternative Proteins Companies
4.2. Market Entropy
4.2.1. New Product Launches in the Industry
4.2.2. Mergers, Acquisitions, Joint ventures, and Partnerships
4.3. Key Strategies and Best Practices
Chapter 5. Global Market Projections: Best, Reference, and Low Case Scenarios
5.1. Growth Analysis- Case Scenario Definitions
5.2. Low Growth Case Scenario Forecasts
5.3. Reference Growth Case Scenario Forecasts
5.4. High Growth Case Scenario Forecasts
Chapter 6. Market Dynamics
6.1. Alternative Proteins Market Drivers
6.2. Alternative Proteins Market Challenges
6.6. Alternative Proteins Market Opportunities
6.4. Alternative Proteins Market Trends
Chapter 7. Global Alternative Proteins Market Outlook Trends
7.1. Global Alternative Proteins Revenue (USD Million) and CAGR (%) by Type (2021-2032)
7.2. Global Alternative Proteins Revenue (USD Million) and CAGR (%) by Application (2021-2032)
7.3. Global Alternative Proteins Revenue (USD Million) and CAGR (%) by Product (2021-2032)
By Product
Plant Protein
-Cereals
-Oats
-Legumes
-Roots
-Ancient Grains
-Nuts & Seeds
Microbe-based Protein
-Algae
-Bacteria
-Yeast
-Fungi
Insect Protein
-Coleoptera
-Lepidoptera
-Hymnoptera
-Orthoptera
-Hemiptera
-Diptera
-Others
By Application
Food & Beverages
Clinical Nutrition
Animal Feed
Infant Formulation
Others
Chapter 8. Global Alternative Proteins Regional Analysis and Outlook
8.1. Global Alternative Proteins Revenue (USD Million) By Regions (2021- 2032)
8.2. North America Alternative Proteins Revenue (USD Million) by Country (2021-2032)
8.2.1. United States Alternative Proteins Regional Analysis and Outlook
8.2.2. Canada Alternative Proteins Regional Analysis and Outlook
8.2.3. Mexico Alternative Proteins Regional Analysis and Outlook
8.3. Europe Alternative Proteins Revenue (USD Million), by Country (2021-2032)
8.3.1. Germany Alternative Proteins Regional Analysis and Outlook
8.3.2. France Alternative Proteins Regional Analysis and Outlook
8.3.3. United Kingdom Alternative Proteins Regional Analysis and Outlook
8.3.4. Spain Alternative Proteins Regional Analysis and Outlook
8.3.5. Italy Alternative Proteins Regional Analysis and Outlook
8.3.6. Russia Alternative Proteins Regional Analysis and Outlook
8.3.7. Rest of Europe Alternative Proteins Regional Analysis and Outlook
8.4. Asia Pacific Alternative Proteins Revenue (USD Million) by Country (2021-2032)
8.4.1. China Alternative Proteins Regional Analysis and Outlook
8.4.2. Japan Alternative Proteins Regional Analysis and Outlook
8.4.3. India Alternative Proteins Regional Analysis and Outlook
8.4.4. South Korea Alternative Proteins Regional Analysis and Outlook
8.4.5. Australia Alternative Proteins Regional Analysis and Outlook
8.4.6. South East Asia Alternative Proteins Regional Analysis and Outlook
8.4.7. Rest of Asia Pacific Alternative Proteins Regional Analysis and Outlook
8.5. South America Alternative Proteins Revenue (USD Million), by Country (2021-2032)
8.5.1. Brazil Alternative Proteins Regional Analysis and Outlook
8.5.2. Argentina Alternative Proteins Regional Analysis and Outlook
8.5.3. Rest of South America Alternative Proteins Regional Analysis and Outlook
8.6. Middle East and Africa Alternative Proteins Revenue (USD Million) by Country (2021-2032)
8.6.1. Middle East Alternative Proteins Regional Analysis and Outlook
8.6.2. Africa Alternative Proteins Regional Analysis and Outlook
Chapter 9. North America Alternative Proteins Analysis and Outlook
9.1. North America Alternative Proteins Revenue (USD Million) by Segments (2021-2032)
9.1.1. North America Alternative Proteins Revenue (USD Million) by Type (2021-2032)
9.1.2. North America Alternative Proteins Revenue (USD Million) by Application (2021-2032)
9.1.3. North America Alternative Proteins Revenue (USD Million) by Product (2021-2032)
By Product
Plant Protein
-Cereals
-Oats
-Legumes
-Roots
-Ancient Grains
-Nuts & Seeds
Microbe-based Protein
-Algae
-Bacteria
-Yeast
-Fungi
Insect Protein
-Coleoptera
-Lepidoptera
-Hymnoptera
-Orthoptera
-Hemiptera
-Diptera
-Others
By Application
Food & Beverages
Clinical Nutrition
Animal Feed
Infant Formulation
Others
Chapter 10. Europe Alternative Proteins Analysis and Outlook
10.1. Europe Alternative Proteins Revenue (USD Million), by Segments (USD Million) (2021-2032)
10.1.1. Europe Alternative Proteins Revenue (USD Million) by Type (2021-2032)
10.1.2. Europe Alternative Proteins Revenue (USD Million) by Application (2021-2032)
10.1.3. Europe Alternative Proteins Revenue (USD Million) by Product (2021-2032)
By Product
Plant Protein
-Cereals
-Oats
-Legumes
-Roots
-Ancient Grains
-Nuts & Seeds
Microbe-based Protein
-Algae
-Bacteria
-Yeast
-Fungi
Insect Protein
-Coleoptera
-Lepidoptera
-Hymnoptera
-Orthoptera
-Hemiptera
-Diptera
-Others
By Application
Food & Beverages
Clinical Nutrition
Animal Feed
Infant Formulation
Others
Chapter 11. Asia Pacific Alternative Proteins Analysis and Outlook
11.1. Asia Pacific Alternative Proteins Revenue (USD Million), and Revenue (USD Million) by Segments (2021-2032)
11.1.1. Asia Pacific Alternative Proteins Revenue (USD Million) by Type (2021-2032)
11.1.2. Asia Pacific Alternative Proteins Revenue (USD Million) by Application (2021-2032)
11.1.3. Asia Pacific Alternative Proteins Revenue (USD Million) by Product (2021-2032)
By Product
Plant Protein
-Cereals
-Oats
-Legumes
-Roots
-Ancient Grains
-Nuts & Seeds
Microbe-based Protein
-Algae
-Bacteria
-Yeast
-Fungi
Insect Protein
-Coleoptera
-Lepidoptera
-Hymnoptera
-Orthoptera
-Hemiptera
-Diptera
-Others
By Application
Food & Beverages
Clinical Nutrition
Animal Feed
Infant Formulation
Others
Chapter 12. South America Alternative Proteins Analysis and Outlook
12.1. South America Alternative Proteins Revenue (USD Million), by Segments (2021-2032)
12.1.1. South America Alternative Proteins Revenue (USD Million) by Type (2021-2032)
12.1.2. South America Alternative Proteins Revenue (USD Million) by Application (2021-2032)
12.1.3. South America Alternative Proteins Revenue (USD Million) by Product (2021-2032)
By Product
Plant Protein
-Cereals
-Oats
-Legumes
-Roots
-Ancient Grains
-Nuts & Seeds
Microbe-based Protein
-Algae
-Bacteria
-Yeast
-Fungi
Insect Protein
-Coleoptera
-Lepidoptera
-Hymnoptera
-Orthoptera
-Hemiptera
-Diptera
-Others
By Application
Food & Beverages
Clinical Nutrition
Animal Feed
Infant Formulation
Others
Chapter 13. Middle East and Africa Alternative Proteins Analysis and Outlook
13.1. Middle East and Africa Alternative Proteins Revenue (USD Million), by Segments (2021-2032)
13.1.1. Middle East and Africa Alternative Proteins Revenue (USD Million) by Type (2021-2032)
13.1.2. Middle East and Africa Alternative Proteins Revenue (USD Million) by Application (2021-2032)
13.1.3. Middle East and Africa Alternative Proteins Revenue (USD Million) by Product (2021-2032)
By Product
Plant Protein
-Cereals
-Oats
-Legumes
-Roots
-Ancient Grains
-Nuts & Seeds
Microbe-based Protein
-Algae
-Bacteria
-Yeast
-Fungi
Insect Protein
-Coleoptera
-Lepidoptera
-Hymnoptera
-Orthoptera
-Hemiptera
-Diptera
-Others
By Application
Food & Beverages
Clinical Nutrition
Animal Feed
Infant Formulation
Others
Chapter 14. Alternative Proteins Company Profiles
14.1 Business Overview
14.2 Product Profiles
14.3 SWOT Profiles
14.5 Recent Developments
14.6 Financial Profile
List of Companies
AGT Food and Ingredients
Archer-Daniels-Midland Company (ADM)
Axiom Foods Inc
Bunge Ltd
Cargill Inc
Emsland Group
Glanbia plc
Impossible Foods Inc
Ingredion Inc
International Flavors & Fragrances Inc. (IFF)
Kerry Group Plc
Lightlife Foods Inc
SunOpta Inc
Tate & Lyle PLC
15. Methodology and Data Sources
15.1 Customization Offerings
15.2 Subscription Services
15.3 Related Reports
15.4 Publisher Expertise
LIST OF TABLES
Table 1 Market Segmentation Analysis
Table 2 Global Alternative Proteins Market Share of Leading Companies, 2023
Table 3 Product Offerings of Leading Companies
Table 4 Low Growth Scenario Forecasts
Table 5 Reference Case Growth Scenario
Table 6 High Growth Case Scenario
Table 7 Global Alternative Proteins Revenue (USD Million) And CAGR (%) By Type (2021-2032)
Table 8 Global Alternative Proteins Revenue (USD Million) And CAGR (%) By Application (2021-2032)
Table 9 Global Alternative Proteins Revenue (USD Million) And CAGR (%) By Product (2021-2032)
Table 10 Global Alternative Proteins Market Revenue (USD Million) By Regions (2021-2032)
Table 11 Global Alternative Proteins Market Share (%) By Regions (2021-2032)
Table 12 North America Alternative Proteins Revenue (USD Million) By Country (2021-2032)
Table 13 Europe Alternative Proteins Revenue (USD Million) By Country (2021-2032)
Table 14 Asia Pacific Alternative Proteins Revenue (USD Million) By Country (2021-2032)
Table 15 South America Alternative Proteins Revenue (USD Million) By Country (2021-2032)
Table 16 Middle East and Africa Alternative Proteins Revenue (USD Million) By Region (2021-2032)
Table 17 North America Alternative Proteins Revenue (USD Million) By Type (2021-2032)
Table 18 North America Alternative Proteins Revenue (USD Million) By Application (2021-2032)
Table 19 North America Alternative Proteins Revenue (USD Million) By Product (2021-2032)
Table 20 Europe Alternative Proteins Revenue (USD Million) By Type (2021-2032)
Table 21 Europe Alternative Proteins Revenue (USD Million) By Application (2021-2032)
Table 22 Europe Alternative Proteins Revenue (USD Million) By Product (2021-2032)
Table 23 Asia Pacific Alternative Proteins Revenue (USD Million) By Type (2021-2032)
Table 24 Asia Pacific Alternative Proteins Revenue (USD Million) By Application (2021-2032)
Table 25 Asia Pacific Alternative Proteins Revenue (USD Million) By Product (2021-2032)
Table 26 South America Alternative Proteins Revenue (USD Million) By Type (2021-2032)
Table 27 South America Alternative Proteins Revenue (USD Million) By Application (2021-2032)
Table 28 South America Alternative Proteins Revenue (USD Million) By Product (2021-2032)
Table 29 Middle East and Africa Alternative Proteins Revenue (USD Million) By Type (2021-2032)
Table 30 Middle East and Africa Alternative Proteins Revenue (USD Million) By Application (2021-2032)
Table 31 Middle East and Africa Alternative Proteins Revenue (USD Million) By Product (2021-2032)
LIST OF FIGURES
Figure 1. Market Scope
Figure 2. Pricing Forecasts Per Unit, 2023- 2032
Figure 3. Porter’s Five Forces
Figure 4. Global Alternative Proteins Market Revenue (USD Million) By Regions (2021-2032)
Figure 5. Global Alternative Proteins Market Share (%) By Regions (2023)
Figure 6. North America Alternative Proteins Revenue (USD Million) By Country (2021-2032)
Figure 7. United States Alternative Proteins Revenue (USD Million) By Country (2021-2032)
Figure 8. Canada Alternative Proteins Revenue (USD Million) By Country (2021-2032)
Figure 9. Mexico Alternative Proteins Revenue (USD Million) By Country (2021-2032)
Figure 10. Europe Alternative Proteins Revenue (USD Million) By Country (2021-2032)
Figure 11. Germany Alternative Proteins Revenue (USD Million) By Country (2021-2032)
Figure 12. France Alternative Proteins Revenue (USD Million) By Country (2021-2032)
Figure 13. United Kingdom Alternative Proteins Revenue (USD Million) By Country (2021-2032)
Figure 14. Spain Alternative Proteins Revenue (USD Million) By Country (2021-2032)
Figure 15. Italy Alternative Proteins Revenue (USD Million) By Country (2021-2032)
Figure 16. Russia Alternative Proteins Revenue (USD Million) By Country (2021-2032)
Figure 17. Rest of Europe Alternative Proteins Revenue (USD Million) By Country (2021-2032)
Figure 11. Asia Pacific Alternative Proteins Revenue (USD Million) By Country (2021-2032)
Figure 12. China Alternative Proteins Revenue (USD Million) By Country (2021-2032)
Figure 13. Japan Alternative Proteins Revenue (USD Million) By Country (2021-2032)
Figure 14. India Alternative Proteins Revenue (USD Million) By Country (2021-2032)
Figure 15. South Korea Alternative Proteins Revenue (USD Million) By Country (2021-2032)
Figure 16. Australia Alternative Proteins Revenue (USD Million) By Country (2021-2032)
Figure 17. South East Asia Alternative Proteins Revenue (USD Million) By Country (2021-2032)
Figure 18. South America Alternative Proteins Revenue (USD Million) By Country (2021-2032)
Figure 19. Brazil Alternative Proteins Revenue (USD Million) By Country (2021-2032)
Figure 20. Argentina Alternative Proteins Revenue (USD Million) By Country (2021-2032)
Figure 21. Rest of Asia Pacific Alternative Proteins Revenue (USD Million) By Country (2021-2032)
Figure 22. Middle East and Africa Alternative Proteins Revenue (USD Million) By Region (2021-2032)
Figure 23. Saudi Arabia Alternative Proteins Revenue (USD Million) By Region (2021-2032)
Figure 24. The UAE Alternative Proteins Revenue (USD Million) By Region (2021-2032)
Figure 25. Rest of Middle East Alternative Proteins Revenue (USD Million) By Region (2021-2032)
Figure 26. South Africa Alternative Proteins Revenue (USD Million) By Region (2021-2032)
Figure 27. Africa Alternative Proteins Revenue (USD Million) By Region (2021-2032)
Figure 28. North America Alternative Proteins Revenue (USD Million) By Type (2021-2032)
Figure 29. North America Alternative Proteins Revenue (USD Million) By Application (2021-2032)
Figure 30. North America Alternative Proteins Revenue (USD Million) By Product (2021-2032)
Figure 31. Europe Alternative Proteins Revenue (USD Million) By Type (2021-2032)
Figure 32. Europe Alternative Proteins Revenue (USD Million) By Application (2021-2032)
Figure 33. Europe Alternative Proteins Revenue (USD Million) By Product (2021-2032)
Figure 34. Asia Pacific Alternative Proteins Revenue (USD Million) By Type (2021-2032)
Figure 35. Asia Pacific Alternative Proteins Revenue (USD Million) By Application (2021-2032)
Figure 36. Asia Pacific Alternative Proteins Revenue (USD Million) By Product (2021-2032)
Figure 37. South America Alternative Proteins Revenue (USD Million) By Type (2021-2032)
Figure 38. South America Alternative Proteins Revenue (USD Million) By Application (2021-2032)
Figure 39. South America Alternative Proteins Revenue (USD Million) By Product (2021-2032)
Figure 40. Middle East and Africa Alternative Proteins Revenue (USD Million) By Type (2021-2032)
Figure 41. Middle East and Africa Alternative Proteins Revenue (USD Million) By Application (2021-2032)
Figure 42. Middle East and Africa Alternative Proteins Revenue (USD Million) By Product (2021-2032)
By Product
Plant Protein
-Cereals
-Oats
-Legumes
-Roots
-Ancient Grains
-Nuts & Seeds
Microbe-based Protein
-Algae
-Bacteria
-Yeast
-Fungi
Insect Protein
-Coleoptera
-Lepidoptera
-Hymnoptera
-Orthoptera
-Hemiptera
-Diptera
-Others
By Application
Food & Beverages
Clinical Nutrition
Animal Feed
Infant Formulation
Others
Countries Analyzed
North America (US, Canada, Mexico)
Europe (Germany, UK, France, Spain, Italy, Russia, Rest of Europe)
Asia Pacific (China, India, Japan, South Korea, Australia, South East Asia, Rest of Asia)
South America (Brazil, Argentina, Rest of South America)
Middle East and Africa (Saudi Arabia, UAE, Rest of Middle East, South Africa, Egypt, Rest of Africa)
