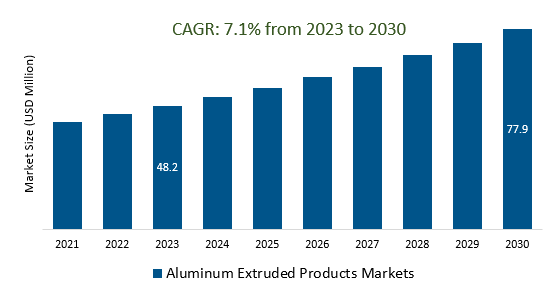
The Global Aluminium Extruded Products Market Size is estimated to be US 48.2 Billion in 2023 and is poised to register 7.10% growth over the forecast period from 2023 to 2030 to reach US $ 77.9 billion in 2030.
The Aluminium Extruded Products market is driven by factors such as the growing construction and building industry, automotive lightweighting, renewable energy, consumer electronics, urbanization, and sustainability. The demand for aluminum products is expected to rise due to stricter emissions regulations, electric vehicles, and the miniaturization of devices. The industry is also influenced by the growing popularity of consumer electronics and the need for heat sinks and casings. Rapid urbanization in emerging markets leads to increased demand for aluminum products in infrastructure projects. The industry is also focusing on customization and design flexibility, advanced manufacturing techniques, and the development of new aluminium alloys and composites. However, global supply chain challenges, trade and tariff policies, and circular economy initiatives are also affecting the market.
Rising Demand for Aluminium Extruded Products in the Growing Construction and Building Industry is boosting the market.
The Aluminium Extruded Products Market is experiencing a significant upswing due to the surging demand within the construction and building industry. This can be attributed to the unique properties of aluminium, such as its lightweight yet robust nature, corrosion resistance, and versatility in design, making it an ideal choice for construction applications. Architects and builders are increasingly turning to aluminium extruded products for a wide range of structural and decorative elements, from window frames and curtain walls to staircases and roofing systems. This trend is expected to continue as sustainability becomes a focal point in construction, with aluminium being highly recyclable and environmentally friendly. As a result, the aluminium extruded products market is poised for substantial growth as it aligns with the evolving needs of the construction industry.
Enhancing Thermal Performance and Miniaturization by using Aluminium Extrusions in Consumer Electronics is creating a demand in the market.
The integration of aluminium extrusions in consumer electronics has brought about a significant shift in the Aluminium Extruded Products Market. This trend is primarily driven by the desire to enhance thermal performance and achieve miniaturization in electronic devices. Aluminium extrusions offer an excellent solution due to their lightweight yet sturdy nature, enabling efficient heat dissipation while maintaining compact form factors. As consumer electronics continue to evolve and demand sleeker, more powerful designs, the use of aluminium extrusions becomes pivotal. This growing demand underscores the market's potential for expansion as manufacturers increasingly turn to this versatile material to meet the evolving requirements of modern consumer electronics.
Aluminium’s Crucial Role in Urbanization and Infrastructure Development is attracting a wide customer base.
Aluminium’s pivotal role in urbanization and infrastructure development is driving significant interest in the Aluminium Extruded Products Market. As cities around the world continue to expand, aluminium emerges as a versatile and essential material for constructing modern buildings, transportation systems, and infrastructure. Its lightweight nature, corrosion resistance, and malleability make it an ideal choice for architects, engineers, and builders. This increasing demand for aluminium extruded products spans across various sectors, from automotive and aerospace to construction and electronics, attracting a diverse customer base. As urbanization persists and sustainability gains prominence, aluminium’s importance in shaping our urban landscapes and enhancing infrastructure development is set to continue its growth trajectory in the market.
Market Share Analysis:
Channels are the most dominant aluminium extruded product type in the market.
Channels stand out as the preeminent category within the aluminium extrusion industry, commanding a significant and influential presence in the market. These extruded aluminium channels, with their versatile and adaptable design, have secured a prominent position due to their widespread utility across diverse applications. Whether employed in the construction sector for framing and structural support, in automotive manufacturing for enhancing lightweight durability, or even in the realm of consumer electronics for sleek, heat-dissipating casings, aluminium channels have consistently demonstrated their indispensability. Their enduring popularity is a testament to their exceptional strength-to-weight ratio, corrosion resistance, and the ease with which they can be shaped into a myriad of forms to meet specific project requirements. As a cornerstone product in the aluminium extrusion industry, channels continue to play a pivotal role in shaping the modern world by contributing to sustainable, high-performance solutions across various sectors.
The automotive and transportation sector stands as the predominant application for aluminium extruded products.
The automotive and transportation sector has emerged as the foremost domain for the utilization of aluminium extruded products. This industry relies on aluminium extrusions for a multitude of purposes due to their exceptional characteristics. Aluminium’s lightweight nature makes it ideal for enhancing fuel efficiency and reducing overall vehicle weight, thus contributing to reduced emissions and improved sustainability. Aluminium extruded products are widely employed in the manufacturing of vehicle frames, body panels, and structural components, as they offer remarkable strength-to-weight ratios and corrosion resistance. Moreover, their malleability allows for intricate and customized designs, fostering innovation in vehicle aesthetics and functionality. As the world increasingly pivots towards electric and hybrid vehicles, the demand for aluminium extrusions continues to surge, as they play a pivotal role in optimizing battery performance, further solidifying their significance in the automotive and transportation sector. Overall, aluminium extruded products are instrumental in shaping the future of greener, more efficient, and advanced transportation solutions.
The 6000 series aluminium alloy is the most dominant in the aluminium extruded product market.
The 6000 series aluminium alloy holds a prominent position as the reigning champion in the aluminium extruded product market. Renowned for its exceptional versatility and wide-ranging applications, this alloy is favored by manufacturers across various industries. Its dominance can be attributed to several key factors. Firstly, the 6000 series boasts remarkable strength-to-weight ratios, making it ideal for lightweight yet durable structures in industries like aerospace and automotive manufacturing. Additionally, its excellent corrosion resistance ensures longevity, making it an attractive choice for outdoor applications and structures exposed to harsh environments. Moreover, this alloy can be easily extruded into various complex shapes and profiles, offering limitless design possibilities. Its natural malleability allows for intricate detailing while maintaining structural integrity. With a high recyclability rate, it aligns with sustainability goals, making it a preferred choice for eco-conscious industries.
Market Share Analysis- Round Tube Aluminium Extruded Products Market will register the fastest growth
The Global Aluminium Extruded Products Market is analyzed across Channels, Equal angle Flat Bars, H Section, Round Bars, Square Bar, Round Tube, Square Tube, and others. Round Tube is poised to register the fastest growth. Round tubes are a significant category in the Aluminum Extruded Products market, widely used across industries like construction, automotive, aerospace, and manufacturing. Valued for their lightweight and corrosion-resistant properties, these tubes find applications in structural components, heat exchangers, hydraulic systems, and architecture. Their versatility and strength-to-weight ratio contribute to their demand in industries requiring durable yet lightweight materials, making them a key product in the market.
Market Share Analysis- c held a significant market share in 2023
The Global Aluminium Extruded Products Market is analyzed across various applications including Automotive and Transportation, Aerospace and Defence, Marine, Lighting, Display equipment, Electrical and Electronics, Architectural, Hygiene and Health, HVAC, Heat exchangers, Renewable energy, Office furniture, Retail, and others. Of these, Automotive and Transportation held a significant market share in 2023. The automotive and transportation sector significantly drives the Aluminum Extruded Products market due to the demand for lightweight, durable components in vehicles. Aluminum extrusions are extensively used in automotive applications, reducing weight while maintaining strength and safety standards, aligning with the industry's focus on fuel efficiency and emission reduction.
Aluminium Extruded Products Market Segmentation
Type
- Channels
- Equal Angle
- Flat Bars
- H Section
- Round Bars
- Square Bar
- Round Tube
- Square Tube
- Others
Application
- Automotive and Transportation
- Aerospace and Defence
- Marine
- Lighting
- Display equipment
- Electrical and Electronics
- Architectural
- Hygiene and Health
- HVAC
- Heat exchangers
- Renewable energy
- Office furniture
- Retail
Alloy
- 1000 series
- 2000 series
- 3000 series
- 5000 series
- 6000 series
- 7000 series
- Others
By Region
- North America (United States, Canada, Mexico)
- Europe (Germany, France, United Kingdom, Spain, Italy, Others)
- Asia Pacific (China, India, Japan, South Korea, Australia, Others)
- Latin America (Brazil, Argentina, Others)
- Middle East and Africa (Saudi Arabia, UAE, Kuwait, Other Middle East, South Africa, Nigeria, Other Africa)
Companies Profiled in the Report
- Alcoa Corporation
- Aluminium Products Company (ALUPCO)
- Aluminium Corporation of China Limited
- Arconic
- Arconic Corp.
- Bahrain Aluminium Extrusion Co
- Capalex (Capital Aluminium Extrusions Ltd)
- Centaury Aluminium Corp
- China Zhongwang Holdings Ltd
- Constellium
- Gulf Extrusions Co. LLC
- Hindalco Industries Ltd.
- Kaiser Aluminium Corporation
- Norsk Hydro ASA
- Novelis Inc
- QALEX (Qatar Aluminium Extrusion Co)
- Rio Tinto Plc
- RUSAL international PJSC
*List not exhaustive
Aluminium Extruded Products Market Outlook 2023
1 Market Overview
1.1 Introduction to the Aluminium Extruded Products Market
1.2 Scope of the Study
1.3 Research Objective
1.3.1 Key Market Scope and Segments
1.3.2 Players Covered
1.3.3 Years Considered
2 Executive Summary
2.1 2023 Aluminium Extruded Products Industry- Market Statistics
3 Market Dynamics
3.1 Market Drivers
3.2 Market Challenges
3.3 Market Opportunities
3.4 Market Trends
4 Market Factor Analysis
4.1 Porter’s Five Forces
4.2 Market Entropy
4.2.1 Global Aluminium Extruded Products Market Companies with Area Served
4.2.2 Products Offerings Global Aluminium Extruded Products Market
5 COVID-19 Impact Analysis and Outlook Scenarios
5.1.1 Covid-19 Impact Analysis
5.1.2 Post-COVID-19 Scenario- Low Growth Case
5.1.3 Post-COVID-19 Scenario- Reference Growth Case
5.1.4 Post-COVID-19 Scenario- Low Growth Case
6 Global Aluminium Extruded Products Market Trends
6.1 Global Aluminium Extruded Products Revenue (USD Million) and CAGR (%) by Type (2018-2030)
6.2 Global Aluminium Extruded Products Revenue (USD Million) and CAGR (%) by Applications (2018-2030)
6.3 Global Aluminium Extruded Products Revenue (USD Million) and CAGR (%) by Regions (2018-2030)
7 Global Aluminium Extruded Products Market Revenue (USD Million) by Type, and Applications (2018-2022)
7.1 Global Aluminium Extruded Products Revenue (USD Million) by Type (2018-2022)
7.1.1 Global Aluminium Extruded Products Revenue (USD Million), Market Share (%) by Type (2018-2022)
7.2 Global Aluminium Extruded Products Revenue (USD Million) by Applications (2018-2022)
7.2.1 Global Aluminium Extruded Products Revenue (USD Million), Market Share (%) by Applications (2018-2022)
8 Global Aluminium Extruded Products Development Regional Status and Outlook
8.1 Global Aluminium Extruded Products Revenue (USD Million) By Regions (2018-2022)
8.2 North America Aluminium Extruded Products Revenue (USD Million) by Type, and Application (2018-2022)
8.2.1 North America Aluminium Extruded Products Revenue (USD Million) by Country (2018-2022)
8.2.2 North America Aluminium Extruded Products Revenue (USD Million) by Type (2018-2022)
8.2.3 North America Aluminium Extruded Products Revenue (USD Million) by Applications (2018-2022)
8.3 Europe Aluminium Extruded Products Revenue (USD Million), by Type, and Applications (USD Million) (2018-2022)
8.3.1 Europe Aluminium Extruded Products Revenue (USD Million), by Country (2018-2022)
8.3.2 Europe Aluminium Extruded Products Revenue (USD Million) by Type (2018-2022)
8.3.3 Europe Aluminium Extruded Products Revenue (USD Million) by Applications (2018-2022)
8.4 Asia Pacific Aluminium Extruded Products Revenue (USD Million), and Revenue (USD Million) by Type, and Applications (2018-2022)
8.4.1 Asia Pacific Aluminium Extruded Products Revenue (USD Million) by Country (2018-2022)
8.4.2 Asia Pacific Aluminium Extruded Products Revenue (USD Million) by Type (2018-2022)
8.4.3 Asia Pacific Aluminium Extruded Products Revenue (USD Million) by Applications (2018-2022)
8.5 South America Aluminium Extruded Products Revenue (USD Million), by Type, and Applications (2018-2022)
8.5.1 South America Aluminium Extruded Products Revenue (USD Million), by Country (2018-2022)
8.5.2 South America Aluminium Extruded Products Revenue (USD Million) by Type (2018-2022)
8.5.3 South America Aluminium Extruded Products Revenue (USD Million) by Applications (2018-2022)
8.6 Middle East and Africa Aluminium Extruded Products Revenue (USD Million), by Type, Technology, Application, Thickness (2018-2022)
8.6.1 Middle East and Africa Aluminium Extruded Products Revenue (USD Million) by Country (2018-2022)
8.6.2 Middle East and Africa Aluminium Extruded Products Revenue (USD Million) by Type (2018-2022)
8.6.3 Middle East and Africa Aluminium Extruded Products Revenue (USD Million) by Applications (2018-2022)
9 Company Profiles
10 Global Aluminium Extruded Products Market Revenue (USD Million), by Type, and Applications (2023-2030)
10.1 Global Aluminium Extruded Products Revenue (USD Million) and Market Share (%) by Type (2023-2030)
10.1.1 Global Aluminium Extruded Products Revenue (USD Million), and Market Share (%) by Type (2023-2030)
10.2 Global Aluminium Extruded Products Revenue (USD Million) and Market Share (%) by Applications (2023-2030)
10.2.1 Global Aluminium Extruded Products Revenue (USD Million), and Market Share (%) by Applications (2023-2030)
11 Global Aluminium Extruded Products Development Regional Status and Outlook Forecast
11.1 Global Aluminium Extruded Products Revenue (USD Million) By Regions (2023-2030)
11.2 North America Aluminium Extruded Products Revenue (USD Million) by Type, and Applications (2023-2030)
11.2.1 North America Aluminium Extruded Products Revenue (USD) Million by Country (2023-2030)
11.2.2 North America Aluminium Extruded Products Revenue (USD Million), by Type (2023-2030)
11.2.3 North America Aluminium Extruded Products Revenue (USD Million), Market Share (%) by Applications (2023-2030)
11.3 Europe Aluminium Extruded Products Revenue (USD Million), by Type, and Applications (2023-2030)
11.3.1 Europe Aluminium Extruded Products Revenue (USD Million), by Country (2023-2030)
11.3.2 Europe Aluminium Extruded Products Revenue (USD Million), by Type (2023-2030)
11.3.3 Europe Aluminium Extruded Products Revenue (USD Million), by Applications (2023-2030)
11.4 Asia Pacific Aluminium Extruded Products Revenue (USD Million) by Type, and Applications (2023-2030)
11.4.1 Asia Pacific Aluminium Extruded Products Revenue (USD Million), by Country (2023-2030)
11.4.2 Asia Pacific Aluminium Extruded Products Revenue (USD Million), by Type (2023-2030)
11.4.3 Asia Pacific Aluminium Extruded Products Revenue (USD Million), by Applications (2023-2030)
11.5 South America Aluminium Extruded Products Revenue (USD Million), by Type, and Applications (2023-2030)
11.5.1 South America Aluminium Extruded Products Revenue (USD Million), by Country (2023-2030)
11.5.2 South America Aluminium Extruded Products Revenue (USD Million), by Type (2023-2030)
11.5.3 South America Aluminium Extruded Products Revenue (USD Million), by Applications (2023-2030)
11.6 Middle East and Africa Aluminium Extruded Products Revenue (USD Million), by Type, and Applications (2023-2030)
11.6.1 Middle East and Africa Aluminium Extruded Products Revenue (USD Million), by Region (2023-2030)
11.6.2 Middle East and Africa Aluminium Extruded Products Revenue (USD Million), by Type (2023-2030)
11.6.3 Middle East and Africa Aluminium Extruded Products Revenue (USD Million), by Applications (2023-2030)
12 Methodology and Data Sources
12.1 Methodology/Research Approach
12.1.1 Research Programs/Design
12.1.2 Market Size Estimation
12.1.3 Market Breakdown and Data Triangulation
12.2 Data Sources
12.2.1 Secondary Sources
12.2.2 Primary Sources
12.3 Disclaimer
List of Tables
Table 1 Market Segmentation Analysis
Table 2 Global Aluminium Extruded Products Market Companies with Areas Served
Table 3 Products Offerings Global Aluminium Extruded Products Market
Table 4 Low Growth Scenario Forecasts
Table 5 Reference Case Growth Scenario
Table 6 High Growth Case Scenario
Table 7 Global Aluminium Extruded Products Revenue (USD Million) And CAGR (%) By Type (2018-2030)
Table 8 Global Aluminium Extruded Products Revenue (USD Million) And CAGR (%) By Applications (2018-2030)
Table 9 Global Aluminium Extruded Products Revenue (USD Million) And CAGR (%) By Regions (2018-2030)
Table 10 Global Aluminium Extruded Products Revenue (USD Million) By Type (2018-2022)
Table 11 Global Aluminium Extruded Products Revenue Market Share (%) By Type (2018-2022)
Table 12 Global Aluminium Extruded Products Revenue (USD Million) By Applications (2018-2022)
Table 13 Global Aluminium Extruded Products Revenue Market Share (%) By Applications (2018-2022)
Table 14 Global Aluminium Extruded Products Market Revenue (USD Million) By Regions (2018-2022)
Table 15 Global Aluminium Extruded Products Market Share (%) By Regions (2018-2022)
Table 16 North America Aluminium Extruded Products Revenue (USD Million) By Country (2018-2022)
Table 17 North America Aluminium Extruded Products Revenue (USD Million) By Type (2018-2022)
Table 18 North America Aluminium Extruded Products Revenue (USD Million) By Applications (2018-2022)
Table 19 Europe Aluminium Extruded Products Revenue (USD Million) By Country (2018-2022)
Table 20 Europe Aluminium Extruded Products Revenue (USD Million) By Type (2018-2022)
Table 21 Europe Aluminium Extruded Products Revenue (USD Million) By Applications (2018-2022)
Table 22 Asia Pacific Aluminium Extruded Products Revenue (USD Million) By Country (2018-2022)
Table 23 Asia Pacific Aluminium Extruded Products Revenue (USD Million) By Type (2018-2022)
Table 24 Asia Pacific Aluminium Extruded Products Revenue (USD Million) By Applications (2018-2022)
Table 25 South America Aluminium Extruded Products Revenue (USD Million) By Country (2018-2022)
Table 26 South America Aluminium Extruded Products Revenue (USD Million) By Type (2018-2022)
Table 27 South America Aluminium Extruded Products Revenue (USD Million) By Applications (2018-2022)
Table 28 Middle East and Africa Aluminium Extruded Products Revenue (USD Million) By Region (2018-2022)
Table 29 Middle East and Africa Aluminium Extruded Products Revenue (USD Million) By Type (2018-2022)
Table 30 Middle East and Africa Aluminium Extruded Products Revenue (USD Million) By Applications (2018-2022)
Table 31 Financial Analysis
Table 32 Global Aluminium Extruded Products Revenue (USD Million) By Type (2023-2030)
Table 33 Global Aluminium Extruded Products Revenue Market Share (%) By Type (2023-2030)
Table 34 Global Aluminium Extruded Products Revenue (USD Million) By Applications (2023-2030)
Table 35 Global Aluminium Extruded Products Revenue Market Share (%) By Applications (2023-2030)
Table 36 Global Aluminium Extruded Products Market Revenue (USD Million), And Revenue (USD Million) By Regions (2023-2030)
Table 37 North America Aluminium Extruded Products Revenue (USD)By Country (2023-2030)
Table 38 North America Aluminium Extruded Products Revenue (USD Million) By Type (2023-2030)
Table 39 North America Aluminium Extruded Products Revenue (USD Million) By Applications (2023-2030)
Table 40 Europe Aluminium Extruded Products Revenue (USD Million) By Country (2023-2030)
Table 41 Europe Aluminium Extruded Products Revenue (USD Million) By Type (2023-2030)
Table 42 Europe Aluminium Extruded Products Revenue (USD Million) By Applications (2023-2030)
Table 43 Asia Pacific Aluminium Extruded Products Revenue (USD Million) By Country (2023-2030)
Table 44 Asia Pacific Aluminium Extruded Products Revenue (USD Million) By Type (2023-2030)
Table 45 Asia Pacific Aluminium Extruded Products Revenue (USD Million) By Applications (2023-2030)
Table 46 South America Aluminium Extruded Products Revenue (USD Million) By Country (2023-2030)
Table 47 South America Aluminium Extruded Products Revenue (USD Million) By Type (2023-2030)
Table 48 South America Aluminium Extruded Products Revenue (USD Million) By Applications (2023-2030)
Table 49 Middle East and Africa Aluminium Extruded Products Revenue (USD Million) By Region (2023-2030)
Table 50 Middle East and Africa Aluminium Extruded Products Revenue (USD Million) By Region (2023-2030)
Table 51 Middle East and Africa Aluminium Extruded Products Revenue (USD Million) By Type (2023-2030)
Table 52 Middle East and Africa Aluminium Extruded Products Revenue (USD Million) By Applications (2023-2030)
Table 53 Research Programs/Design for This Report
Table 54 Key Data Information from Secondary Sources
Table 55 Key Data Information from Primary Sources
List of Figures
Figure 1 Market Scope
Figure 2 Porter’s Five Forces
Figure 3 Global Aluminium Extruded Products Revenue (USD Million) By Type (2018-2022)
Figure 4 Global Aluminium Extruded Products Revenue Market Share (%) By Type (2022)
Figure 5 Global Aluminium Extruded Products Revenue (USD Million) By Applications (2018-2022)
Figure 6 Global Aluminium Extruded Products Revenue Market Share (%) By Applications (2022)
Figure 7 Global Aluminium Extruded Products Market Revenue (USD Million) By Regions (2018-2022)
Figure 8 Global Aluminium Extruded Products Market Share (%) By Regions (2022)
Figure 9 North America Aluminium Extruded Products Revenue (USD Million) By Country (2018-2022)
Figure 10 North America Aluminium Extruded Products Revenue (USD Million) By Type (2018-2022)
Figure 11 North America Aluminium Extruded Products Revenue (USD Million) By Applications (2018-2022)
Figure 12 Europe Aluminium Extruded Products Revenue (USD Million) By Country (2018-2022)
Figure 13 Europe Aluminium Extruded Products Revenue (USD Million) By Type (2018-2022)
Figure 14 Europe Aluminium Extruded Products Revenue (USD Million) By Applications (2018-2022)
Figure 15 Asia Pacific Aluminium Extruded Products Revenue (USD Million) By Country (2018-2022)
Figure 16 Asia Pacific Aluminium Extruded Products Revenue (USD Million) By Type (2018-2022)
Figure 17 Asia Pacific Aluminium Extruded Products Revenue (USD Million) By Applications (2018-2022)
Figure 18 South America Aluminium Extruded Products Revenue (USD Million) By Country (2018-2022)
Figure 19 South America Aluminium Extruded Products Revenue (USD Million) By Type (2018-2022)
Figure 20 South America Aluminium Extruded Products Revenue (USD Million) By Applications (2018-2022)
Figure 21 Middle East and Africa Aluminium Extruded Products Revenue (USD Million) By Region (2018-2022)
Figure 22 Middle East and Africa Aluminium Extruded Products Revenue (USD Million) By Type (2018-2022)
Figure 23 Middle East and Africa Aluminium Extruded Products Revenue (USD Million) By Applications (2018-2022)
Figure 24 Global Aluminium Extruded Products Revenue (USD Million) By Type (2023-2030)
Figure 25 Global Aluminium Extruded Products Revenue Market Share (%) By Type (2030)
Figure 26 Global Aluminium Extruded Products Revenue (USD Million) By Applications (2023-2030)
Figure 27 Global Aluminium Extruded Products Revenue Market Share (%) By Applications (2030)
Figure 28 Global Aluminium Extruded Products Market Revenue (USD Million) By Regions (2023-2030)
Figure 29 North America Aluminium Extruded Products Revenue (USD Million) By Country (2023-2030)
Figure 30 North America Aluminium Extruded Products Revenue (USD Million) By Type (2023-2030)
Figure 31 North America Aluminium Extruded Products Revenue (USD Million) By Applications (2023-2030)
Figure 32 Europe Aluminium Extruded Products Revenue (USD Million) By Country (2023-2030)
Figure 33 Europe Aluminium Extruded Products Revenue (USD Million) By Type (2023-2030)
Figure 34 Europe Aluminium Extruded Products Revenue (USD Million) By Applications (2023-2030)
Figure 35 Asia Pacific Aluminium Extruded Products Revenue (USD Million) By Country (2023-2030)
Figure 36 Asia Pacific Aluminium Extruded Products Revenue (USD Million) By Type (2023-2030)
Figure 37 Asia Pacific Aluminium Extruded Products Revenue (USD Million) By Applications (2023-2030)
Figure 38 South America Aluminium Extruded Products Revenue (USD Million) By Country (2023-2030)
Figure 39 South America Aluminium Extruded Products Revenue (USD Million) By Type (2023-2030)
Figure 40 South America Aluminium Extruded Products Revenue (USD Million) By Applications (2023-2030)
Figure 41 Middle East and Africa Aluminium Extruded Products Revenue (USD Million) By Region (2023-2030)
Figure 42 Middle East and Africa Aluminium Extruded Products Revenue (USD Million) By Region (2023-2030)
Figure 43 Middle East and Africa Aluminium Extruded Products Revenue (USD Million) By Type (2023-2030)
Figure 44 Middle East and Africa Aluminium Extruded Products Revenue (USD Million) By Applications (2023-2030)
Figure 45 Bottom-Up and Top-Down Approaches For This Report
Figure 46 Data Triangulation
