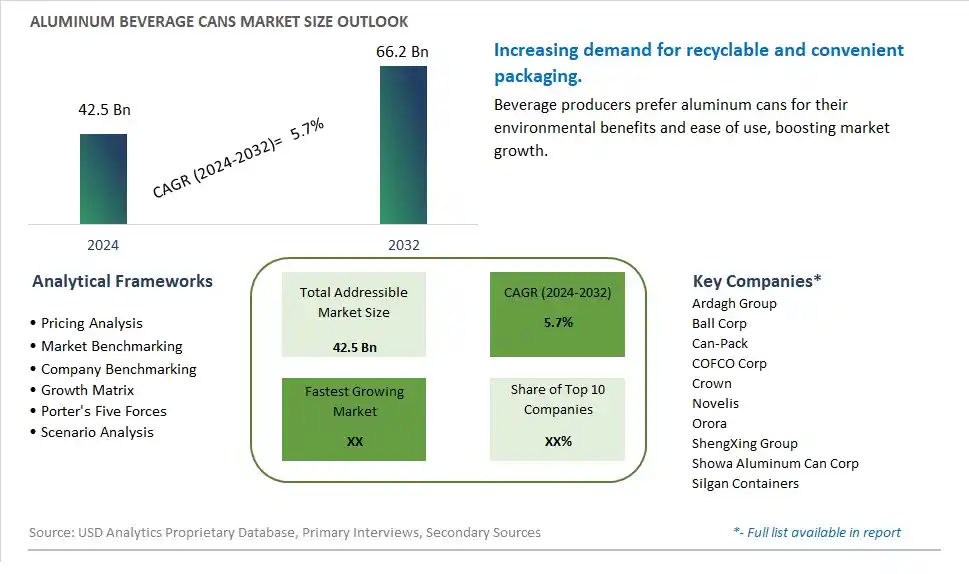
Global Aluminum Beverage Cans Market Size is valued at $42.5 Billion in 2024 and is forecast to register a growth rate (CAGR) of 5.7% to reach $66.2 Billion by 2032.
The global Aluminum Beverage Cans Market Comprehensive Study analyzes and forecasts the market size across 6 regions and 24 countries for diverse segments -By Type (2-Piece, 3-Piece), By Application (Carbonated Soft Drinks, Beer, Water, Energy Drinks, Others)
An Introduction to Aluminum Beverage Cans Market
In 2024, the Aluminum Beverage Cans market is expanding steadily, driven by the growing demand for sustainable and recyclable packaging solutions. Aluminum beverage cans are favored for their lightweight, durability, and excellent barrier properties, which preserve the quality and freshness of beverages. The market is supported by increasing environmental awareness and stringent regulations promoting recyclable packaging. Innovations in can design, including resealable and personalized options, are enhancing consumer appeal. Additionally, the rise in canned beverages such as craft beer, sparkling water, and energy drinks is further propelling market growth.
Aluminum Beverage Cans Competitive Landscape
The market report analyses the leading companies in the industry including Ardagh Group, Ball Corp, Can-Pack, COFCO Corp, Crown, Novelis, Orora, ShengXing Group, Showa Aluminum Can Corp, Silgan Containers, and Others.
Aluminum Beverage Cans Market Dynamics
Aluminum Beverage Cans Market Trend: Shift Towards Sustainability
The aluminum beverage cans market is witnessing a significant trend towards sustainability, driven by increasing consumer awareness and regulatory pressures. Aluminum cans are highly recyclable, and the market is seeing a shift from plastic packaging to aluminum due to its lower environmental impact. Major beverage companies are committing to using more recycled materials in their cans, and innovations in can design are making recycling processes more efficient. This trend is further fueled by consumer preference for eco-friendly packaging options, leading to a rise in the demand for aluminum cans over plastic alternatives.
Aluminum Beverage Cans Market Driver: Growing Beverage Consumption
A major driver for the aluminum beverage cans market is the increasing global consumption of beverages, particularly in the ready-to-drink (RTD) segment. The convenience, portability, and durability of aluminum cans make them an ideal choice for both carbonated and non-carbonated beverages. The surge in demand for energy drinks, craft beers, and health beverages has significantly boosted the aluminum cans market. Additionally, the growing popularity of e-commerce and on-the-go consumption patterns are propelling the demand for packaged beverages, thereby driving the market growth for aluminum cans.
Aluminum Beverage Cans Market Opportunity: Innovation in Can Designs
Innovation in can designs presents a substantial opportunity for the aluminum beverage cans market. Manufacturers are investing in advanced technologies to create lightweight, resealable, and aesthetically appealing cans to attract consumers and meet the diverse needs of beverage companies. There is also a rising trend towards personalized and limited-edition packaging, which can drive consumer engagement and brand loyalty. Moreover, advancements in printing technology enable high-quality graphics and interactive features on cans, offering beverage brands new ways to market their products and enhance consumer experience.
Aluminum Beverage Cans Market Share Analysis: 2-Piece Aluminum Beverage Cans segment generated the highest revenue share in the industry
The 2-Piece Aluminum Beverage Cans segment emerges as the largest in the Aluminum Beverage Cans market, showcasing substantial growth and widespread adoption. These cans are constructed from two separate pieces welded together, offering a seamless and durable packaging solution for beverages. The 2-Piece Aluminum Beverage Cans segment dominates the market due to several key advantages. Firstly, they are lightweight yet robust, making them ideal for transportation and storage, reducing logistics costs for beverage manufacturers. Additionally, 2-Piece Aluminum Beverage Cans offer superior protection against light, oxygen, and moisture, preserving the freshness and quality of beverages for extended periods. Further, advancements in can design, printing technology, and sustainability initiatives such as recyclability and material efficiency further enhance the appeal of 2-Piece Aluminum Beverage Cans among consumers and beverage companies. With the continuous innovation and expansion of the beverage industry, coupled with the convenience and environmental benefits of 2-Piece Aluminum Beverage Cans, this segment is poised to maintain its market leadership and drive significant growth in the Aluminum Beverage Cans market.
Aluminum Beverage Cans Market Share Analysis: Energy Drinks is the fastest growing segment over the forecast period to 2032
The Energy Drinks segment within the Aluminum Beverage Cans Market is poised for rapid growth leading up to 2032. This segment's accelerated expansion is driven by several key factors. Firstly, there's a growing global demand for energy drinks due to changing lifestyles, increased urbanization, and rising consumer awareness of health and wellness trends. Energy drinks are popular among consumers seeking a quick boost of energy and alertness, making them a preferred choice for busy professionals, athletes, and students. Additionally, the convenience and portability of aluminum beverage cans make them an ideal packaging solution for energy drinks, ensuring product freshness, convenience, and on-the-go consumption. The Energy Drinks segment also benefits from continuous product innovations, flavor variations, and marketing strategies targeting specific consumer demographics. With the growing market penetration of energy drinks and the increasing popularity of aluminum beverage cans as a preferred packaging format, the Energy Drinks segment is positioned to experience exponential growth and emerge as a dominant force within the Aluminum Beverage Cans market by 2032.
Aluminum Beverage Cans Market Segmentation
By Type
2-Piece
3-Piece
By Application
Carbonated Soft Drinks
Beer
Water
Energy Drinks
Others
Countries Analyzed
North America (US, Canada, Mexico)
Europe (Germany, UK, France, Spain, Italy, Russia, Rest of Europe)
Asia Pacific (China, India, Japan, South Korea, Australia, South East Asia, Rest of Asia)
South America (Brazil, Argentina, Rest of South America)
Middle East and Africa (Saudi Arabia, UAE, Rest of Middle East, South Africa, Egypt, Rest of Africa)
Aluminum Beverage Cans Companies Profiled in the Study
Ardagh Group
Ball Corp
Can-Pack
COFCO Corp
Crown
Novelis
Orora
ShengXing Group
Showa Aluminum Can Corp
Silgan Containers
*- List Not Exhaustive
Chapter 1. TABLE OF CONTENTS
Chapter 2. Introduction to Aluminum Beverage Cans Market
2.1. Market Overview
2.2. Key Statistics and Report Highlights
2.3. Scope of the Comprehensive Study
2.3.1. Market Definition
2.3.2 Countries and Regions Covered
2.3.3 Research Objective
2.3.4 Units, Currency, and Conversions
2.3.5 Industry Value Chain
2.4. Key Market Segments
2.5. Key Companies
2.6. Study Period
Chapter 3. Strategic Analysis Review
3.1. Aluminum Beverage Cans Pricing Analysis and Forecast
3.2. Porter’s Five Forces
3.3. Market Ecosystem
3.4. SWOT Analysis
3.5. Regulatory Scenario
3.3. Effects of Inflation, Russia-Ukraine War, moderating economic growth, and other macroeconomic factors
Chapter 4. Competitive Landscape
4.1. Market Share Analysis
4.1.1. Global Aluminum Beverage Cans Market Share by Company, 2023
4.1.2. Product Offerings of Leading Aluminum Beverage Cans Companies
4.2. Market Entropy
4.2.1. New Product Launches in the Industry
4.2.2. Mergers, Acquisitions, Joint ventures, and Partnerships
4.3. Key Strategies and Best Practices
Chapter 5. Global Market Projections: Best, Reference, and Low Case Scenarios
5.1. Growth Analysis- Case Scenario Definitions
5.2. Low Growth Case Scenario Forecasts
5.3. Reference Growth Case Scenario Forecasts
5.4. High Growth Case Scenario Forecasts
Chapter 6. Market Dynamics
6.1. Aluminum Beverage Cans Market Drivers
6.2. Aluminum Beverage Cans Market Challenges
6.6. Aluminum Beverage Cans Market Opportunities
6.4. Aluminum Beverage Cans Market Trends
Chapter 7. Global Aluminum Beverage Cans Market Outlook Trends
7.1. Global Aluminum Beverage Cans Revenue (USD Million) and CAGR (%) by Type (2021-2032)
7.2. Global Aluminum Beverage Cans Revenue (USD Million) and CAGR (%) by Application (2021-2032)
7.3. Global Aluminum Beverage Cans Revenue (USD Million) and CAGR (%) by Product (2021-2032)
By Type
2-Piece
3-Piece
By Application
Carbonated Soft Drinks
Beer
Water
Energy Drinks
Others
Chapter 8. Global Aluminum Beverage Cans Regional Analysis and Outlook
8.1. Global Aluminum Beverage Cans Revenue (USD Million) By Regions (2021- 2032)
8.2. North America Aluminum Beverage Cans Revenue (USD Million) by Country (2021-2032)
8.2.1. United States Aluminum Beverage Cans Regional Analysis and Outlook
8.2.2. Canada Aluminum Beverage Cans Regional Analysis and Outlook
8.2.3. Mexico Aluminum Beverage Cans Regional Analysis and Outlook
8.3. Europe Aluminum Beverage Cans Revenue (USD Million), by Country (2021-2032)
8.3.1. Germany Aluminum Beverage Cans Regional Analysis and Outlook
8.3.2. France Aluminum Beverage Cans Regional Analysis and Outlook
8.3.3. United Kingdom Aluminum Beverage Cans Regional Analysis and Outlook
8.3.4. Spain Aluminum Beverage Cans Regional Analysis and Outlook
8.3.5. Italy Aluminum Beverage Cans Regional Analysis and Outlook
8.3.6. Russia Aluminum Beverage Cans Regional Analysis and Outlook
8.3.7. Rest of Europe Aluminum Beverage Cans Regional Analysis and Outlook
8.4. Asia Pacific Aluminum Beverage Cans Revenue (USD Million) by Country (2021-2032)
8.4.1. China Aluminum Beverage Cans Regional Analysis and Outlook
8.4.2. Japan Aluminum Beverage Cans Regional Analysis and Outlook
8.4.3. India Aluminum Beverage Cans Regional Analysis and Outlook
8.4.4. South Korea Aluminum Beverage Cans Regional Analysis and Outlook
8.4.5. Australia Aluminum Beverage Cans Regional Analysis and Outlook
8.4.6. South East Asia Aluminum Beverage Cans Regional Analysis and Outlook
8.4.7. Rest of Asia Pacific Aluminum Beverage Cans Regional Analysis and Outlook
8.5. South America Aluminum Beverage Cans Revenue (USD Million), by Country (2021-2032)
8.5.1. Brazil Aluminum Beverage Cans Regional Analysis and Outlook
8.5.2. Argentina Aluminum Beverage Cans Regional Analysis and Outlook
8.5.3. Rest of South America Aluminum Beverage Cans Regional Analysis and Outlook
8.6. Middle East and Africa Aluminum Beverage Cans Revenue (USD Million) by Country (2021-2032)
8.6.1. Middle East Aluminum Beverage Cans Regional Analysis and Outlook
8.6.2. Africa Aluminum Beverage Cans Regional Analysis and Outlook
Chapter 9. North America Aluminum Beverage Cans Analysis and Outlook
9.1. North America Aluminum Beverage Cans Revenue (USD Million) by Segments (2021-2032)
9.1.1. North America Aluminum Beverage Cans Revenue (USD Million) by Type (2021-2032)
9.1.2. North America Aluminum Beverage Cans Revenue (USD Million) by Application (2021-2032)
9.1.3. North America Aluminum Beverage Cans Revenue (USD Million) by Product (2021-2032)
By Type
2-Piece
3-Piece
By Application
Carbonated Soft Drinks
Beer
Water
Energy Drinks
Others
Chapter 10. Europe Aluminum Beverage Cans Analysis and Outlook
10.1. Europe Aluminum Beverage Cans Revenue (USD Million), by Segments (USD Million) (2021-2032)
10.1.1. Europe Aluminum Beverage Cans Revenue (USD Million) by Type (2021-2032)
10.1.2. Europe Aluminum Beverage Cans Revenue (USD Million) by Application (2021-2032)
10.1.3. Europe Aluminum Beverage Cans Revenue (USD Million) by Product (2021-2032)
By Type
2-Piece
3-Piece
By Application
Carbonated Soft Drinks
Beer
Water
Energy Drinks
Others
Chapter 11. Asia Pacific Aluminum Beverage Cans Analysis and Outlook
11.1. Asia Pacific Aluminum Beverage Cans Revenue (USD Million), and Revenue (USD Million) by Segments (2021-2032)
11.1.1. Asia Pacific Aluminum Beverage Cans Revenue (USD Million) by Type (2021-2032)
11.1.2. Asia Pacific Aluminum Beverage Cans Revenue (USD Million) by Application (2021-2032)
11.1.3. Asia Pacific Aluminum Beverage Cans Revenue (USD Million) by Product (2021-2032)
By Type
2-Piece
3-Piece
By Application
Carbonated Soft Drinks
Beer
Water
Energy Drinks
Others
Chapter 12. South America Aluminum Beverage Cans Analysis and Outlook
12.1. South America Aluminum Beverage Cans Revenue (USD Million), by Segments (2021-2032)
12.1.1. South America Aluminum Beverage Cans Revenue (USD Million) by Type (2021-2032)
12.1.2. South America Aluminum Beverage Cans Revenue (USD Million) by Application (2021-2032)
12.1.3. South America Aluminum Beverage Cans Revenue (USD Million) by Product (2021-2032)
By Type
2-Piece
3-Piece
By Application
Carbonated Soft Drinks
Beer
Water
Energy Drinks
Others
Chapter 13. Middle East and Africa Aluminum Beverage Cans Analysis and Outlook
13.1. Middle East and Africa Aluminum Beverage Cans Revenue (USD Million), by Segments (2021-2032)
13.1.1. Middle East and Africa Aluminum Beverage Cans Revenue (USD Million) by Type (2021-2032)
13.1.2. Middle East and Africa Aluminum Beverage Cans Revenue (USD Million) by Application (2021-2032)
13.1.3. Middle East and Africa Aluminum Beverage Cans Revenue (USD Million) by Product (2021-2032)
By Type
2-Piece
3-Piece
By Application
Carbonated Soft Drinks
Beer
Water
Energy Drinks
Others
Chapter 14. Aluminum Beverage Cans Company Profiles
14.1 Business Overview
14.2 Product Profiles
14.3 SWOT Profiles
14.5 Recent Developments
14.6 Financial Profile
List of Companies
Ardagh Group
Ball Corp
Can-Pack
COFCO Corp
Crown
Novelis
Orora
ShengXing Group
Showa Aluminum Can Corp
Silgan Containers
15. Methodology and Data Sources
15.1 Customization Offerings
15.2 Subscription Services
15.3 Related Reports
15.4 Publisher Expertise
LIST OF TABLES
Table 1 Market Segmentation Analysis
Table 2 Global Aluminum Beverage Cans Market Share of Leading Companies, 2023
Table 3 Product Offerings of Leading Companies
Table 4 Low Growth Scenario Forecasts
Table 5 Reference Case Growth Scenario
Table 6 High Growth Case Scenario
Table 7 Global Aluminum Beverage Cans Revenue (USD Million) And CAGR (%) By Type (2021-2032)
Table 8 Global Aluminum Beverage Cans Revenue (USD Million) And CAGR (%) By Application (2021-2032)
Table 9 Global Aluminum Beverage Cans Revenue (USD Million) And CAGR (%) By Product (2021-2032)
Table 10 Global Aluminum Beverage Cans Market Revenue (USD Million) By Regions (2021-2032)
Table 11 Global Aluminum Beverage Cans Market Share (%) By Regions (2021-2032)
Table 12 North America Aluminum Beverage Cans Revenue (USD Million) By Country (2021-2032)
Table 13 Europe Aluminum Beverage Cans Revenue (USD Million) By Country (2021-2032)
Table 14 Asia Pacific Aluminum Beverage Cans Revenue (USD Million) By Country (2021-2032)
Table 15 South America Aluminum Beverage Cans Revenue (USD Million) By Country (2021-2032)
Table 16 Middle East and Africa Aluminum Beverage Cans Revenue (USD Million) By Region (2021-2032)
Table 17 North America Aluminum Beverage Cans Revenue (USD Million) By Type (2021-2032)
Table 18 North America Aluminum Beverage Cans Revenue (USD Million) By Application (2021-2032)
Table 19 North America Aluminum Beverage Cans Revenue (USD Million) By Product (2021-2032)
Table 20 Europe Aluminum Beverage Cans Revenue (USD Million) By Type (2021-2032)
Table 21 Europe Aluminum Beverage Cans Revenue (USD Million) By Application (2021-2032)
Table 22 Europe Aluminum Beverage Cans Revenue (USD Million) By Product (2021-2032)
Table 23 Asia Pacific Aluminum Beverage Cans Revenue (USD Million) By Type (2021-2032)
Table 24 Asia Pacific Aluminum Beverage Cans Revenue (USD Million) By Application (2021-2032)
Table 25 Asia Pacific Aluminum Beverage Cans Revenue (USD Million) By Product (2021-2032)
Table 26 South America Aluminum Beverage Cans Revenue (USD Million) By Type (2021-2032)
Table 27 South America Aluminum Beverage Cans Revenue (USD Million) By Application (2021-2032)
Table 28 South America Aluminum Beverage Cans Revenue (USD Million) By Product (2021-2032)
Table 29 Middle East and Africa Aluminum Beverage Cans Revenue (USD Million) By Type (2021-2032)
Table 30 Middle East and Africa Aluminum Beverage Cans Revenue (USD Million) By Application (2021-2032)
Table 31 Middle East and Africa Aluminum Beverage Cans Revenue (USD Million) By Product (2021-2032)
LIST OF FIGURES
Figure 1. Market Scope
Figure 2. Pricing Forecasts Per Unit, 2023- 2032
Figure 3. Porter’s Five Forces
Figure 4. Global Aluminum Beverage Cans Market Revenue (USD Million) By Regions (2021-2032)
Figure 5. Global Aluminum Beverage Cans Market Share (%) By Regions (2023)
Figure 6. North America Aluminum Beverage Cans Revenue (USD Million) By Country (2021-2032)
Figure 7. United States Aluminum Beverage Cans Revenue (USD Million) By Country (2021-2032)
Figure 8. Canada Aluminum Beverage Cans Revenue (USD Million) By Country (2021-2032)
Figure 9. Mexico Aluminum Beverage Cans Revenue (USD Million) By Country (2021-2032)
Figure 10. Europe Aluminum Beverage Cans Revenue (USD Million) By Country (2021-2032)
Figure 11. Germany Aluminum Beverage Cans Revenue (USD Million) By Country (2021-2032)
Figure 12. France Aluminum Beverage Cans Revenue (USD Million) By Country (2021-2032)
Figure 13. United Kingdom Aluminum Beverage Cans Revenue (USD Million) By Country (2021-2032)
Figure 14. Spain Aluminum Beverage Cans Revenue (USD Million) By Country (2021-2032)
Figure 15. Italy Aluminum Beverage Cans Revenue (USD Million) By Country (2021-2032)
Figure 16. Russia Aluminum Beverage Cans Revenue (USD Million) By Country (2021-2032)
Figure 17. Rest of Europe Aluminum Beverage Cans Revenue (USD Million) By Country (2021-2032)
Figure 11. Asia Pacific Aluminum Beverage Cans Revenue (USD Million) By Country (2021-2032)
Figure 12. China Aluminum Beverage Cans Revenue (USD Million) By Country (2021-2032)
Figure 13. Japan Aluminum Beverage Cans Revenue (USD Million) By Country (2021-2032)
Figure 14. India Aluminum Beverage Cans Revenue (USD Million) By Country (2021-2032)
Figure 15. South Korea Aluminum Beverage Cans Revenue (USD Million) By Country (2021-2032)
Figure 16. Australia Aluminum Beverage Cans Revenue (USD Million) By Country (2021-2032)
Figure 17. South East Asia Aluminum Beverage Cans Revenue (USD Million) By Country (2021-2032)
Figure 18. South America Aluminum Beverage Cans Revenue (USD Million) By Country (2021-2032)
Figure 19. Brazil Aluminum Beverage Cans Revenue (USD Million) By Country (2021-2032)
Figure 20. Argentina Aluminum Beverage Cans Revenue (USD Million) By Country (2021-2032)
Figure 21. Rest of Asia Pacific Aluminum Beverage Cans Revenue (USD Million) By Country (2021-2032)
Figure 22. Middle East and Africa Aluminum Beverage Cans Revenue (USD Million) By Region (2021-2032)
Figure 23. Saudi Arabia Aluminum Beverage Cans Revenue (USD Million) By Region (2021-2032)
Figure 24. The UAE Aluminum Beverage Cans Revenue (USD Million) By Region (2021-2032)
Figure 25. Rest of Middle East Aluminum Beverage Cans Revenue (USD Million) By Region (2021-2032)
Figure 26. South Africa Aluminum Beverage Cans Revenue (USD Million) By Region (2021-2032)
Figure 27. Africa Aluminum Beverage Cans Revenue (USD Million) By Region (2021-2032)
Figure 28. North America Aluminum Beverage Cans Revenue (USD Million) By Type (2021-2032)
Figure 29. North America Aluminum Beverage Cans Revenue (USD Million) By Application (2021-2032)
Figure 30. North America Aluminum Beverage Cans Revenue (USD Million) By Product (2021-2032)
Figure 31. Europe Aluminum Beverage Cans Revenue (USD Million) By Type (2021-2032)
Figure 32. Europe Aluminum Beverage Cans Revenue (USD Million) By Application (2021-2032)
Figure 33. Europe Aluminum Beverage Cans Revenue (USD Million) By Product (2021-2032)
Figure 34. Asia Pacific Aluminum Beverage Cans Revenue (USD Million) By Type (2021-2032)
Figure 35. Asia Pacific Aluminum Beverage Cans Revenue (USD Million) By Application (2021-2032)
Figure 36. Asia Pacific Aluminum Beverage Cans Revenue (USD Million) By Product (2021-2032)
Figure 37. South America Aluminum Beverage Cans Revenue (USD Million) By Type (2021-2032)
Figure 38. South America Aluminum Beverage Cans Revenue (USD Million) By Application (2021-2032)
Figure 39. South America Aluminum Beverage Cans Revenue (USD Million) By Product (2021-2032)
Figure 40. Middle East and Africa Aluminum Beverage Cans Revenue (USD Million) By Type (2021-2032)
Figure 41. Middle East and Africa Aluminum Beverage Cans Revenue (USD Million) By Application (2021-2032)
Figure 42. Middle East and Africa Aluminum Beverage Cans Revenue (USD Million) By Product (2021-2032)
By Type
2-Piece
3-Piece
By Application
Carbonated Soft Drinks
Beer
Water
Energy Drinks
Others
Countries Analyzed
North America (US, Canada, Mexico)
Europe (Germany, UK, France, Spain, Italy, Russia, Rest of Europe)
Asia Pacific (China, India, Japan, South Korea, Australia, South East Asia, Rest of Asia)
South America (Brazil, Argentina, Rest of South America)
Middle East and Africa (Saudi Arabia, UAE, Rest of Middle East, South Africa, Egypt, Rest of Africa)
