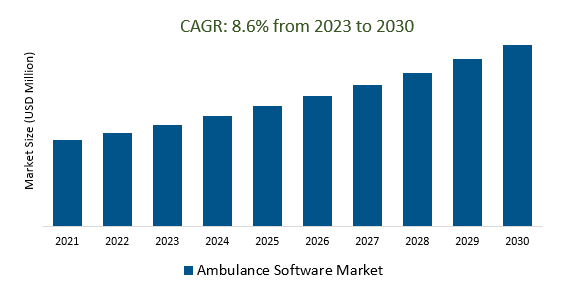
The Global Ambulance Software Market Size is estimated to register High CAGR over the forecast period from 2023 to 2030.
The market growth is driven by the increasing aging population and prevalence of chronic diseases, there's a growing demand for ambulance software that supports remote monitoring of patients with chronic conditions. Leading companies that are focused on Technological Advancements, Global Aging Population, Rising Healthcare Needs, Integrated Healthcare Systems, Disaster Management, Personalized Medicine, Data Analytics and Predictive Analytics, Healthcare Access in Developing Countries, and others to boost market shares in the industry.
Market Overview
The ambulance software market offers specialized solutions for improving emergency medical services by streamlining dispatch, electronic patient care reporting, GPS navigation, telemedicine integration, and data analytics. Market growth is driven by technological advancements, increased demand for emergency services, the shift towards patient-centered care, regulatory compliance, and the need for efficient crisis management. Challenges include interoperability issues, cost constraints, data security concerns, and user training requirements. Despite these challenges, the ambulance software market is poised for continued expansion as healthcare systems prioritize enhanced emergency response and patient care through innovative software solutions.
Market Dynamics
Market Trends - Benefits of AI and Machine Learning for Ambulance Software
AI and machine learning benefit ambulance software by improving diagnosis accuracy, optimizing resource allocation and routing, enhancing patient data documentation, and supporting telemedicine. These technologies also enable cost reduction through predictive maintenance and offer data-driven insights for continuous improvement in emergency medical care. Additionally, AI enhances data security and decision support, ultimately leading to better patient outcomes and more efficient healthcare services.
Market Driver- Data Analytics Demand Ambulance Software Market
The ambulance software market is experiencing a growing demand for data analytics solutions due to their ability to optimize emergency services by analyzing historical data, improving resource allocation, response times, and patient care, as well as ensuring compliance with healthcare regulations.
Market Opportunity-Introduction of Integration with Emergency Medical Services (EMS) Systems
Integration with Emergency Medical Services (EMS) systems is a vital trend in the ambulance software market, facilitating seamless coordination from emergency calls to hospital handover. This integration enhances communication, data sharing, and overall efficiency among EMS providers, paramedics, and hospitals, leading to improved patient care and reduced response times. It stands as a pivotal driver in the evolution of the ambulance software market.
Market Share Analysis- Cloud-Based Ambulance Software Market will register the fastest growth
The Global Ambulance Software Market is analyzed across Cloud-Based, On-Premise, and others. Cloud Based poised to register the fastest growth. The ambulance software market is increasingly adopting cloud-based solutions, driven by their scalability, accessibility, cost-efficiency, and support for secure data storage and retrieval. This trend responds to the demand for flexible and accessible tools in managing ambulance operations and patient care, making cloud-based solutions a prominent feature in the market's evolution.
Market Share Analysis- Large enterprises held a significant market share in 2023
The Global Ambulance Software Market is analyzed across various Enterprise Sizes including Large Enterprise, SMEs, and others. Of these, Large Enterprises held a significant market share in 2023. Large enterprises are increasingly influential in the ambulance software market, investing in comprehensive solutions to enhance emergency medical services. Their resources enable the implementation of advanced features like telemedicine and data analytics, reflecting a need for scalable and integrated software to improve patient care and operational efficiency in large ambulance service operations.
Ambulance Software Market Segmentation
By Type
By Application
- Point-of-Service Data
- Equipment Tracking and Dispatch Monitoring
- Shift Management
- Fleet Management
- Billing and Invoicing
- Electronic Patient Care Reporting
- Others
By Enterprise Size
By Access Type
- Mobile
- Personal Computers
- Others
By End Users
- Emergency Medical Service
- Hospitals
- Critical Care Services
- Others
By Region
- North America (United States, Canada, Mexico)
- Europe (Germany, France, United Kingdom, Spain, Italy, Others)
- Asia Pacific (China, India, Japan, South Korea, Australia, Others)
- Latin America (Brazil, Argentina, Others)
- Middle East and Africa (Saudi Arabia, UAE, Kuwait, Other Middle East, South Africa, Nigeria, Other Africa)
Ambulance Software Market Companies
- Cerner Corporation (United States)
- Trapeze Group (Canada)
- Sun Ridge Systems Inc (United States)
- Quark Software (United States)
- EMIS Health (United Kingdom)
- GE Healthcare (United States)
- Traumasoft (United States)
- Angel Track LLC (United States)
- Central Square (United States)
- ACG Infotech Limited (India)
- Chevin Fleet Solutions (United Kingdom)
- MEDHOST (United States)
- Sara Technologies (India)
- Cloudpital (United Kingdom)
- EPIC EMS (United States)
*List not exhaustive
Ambulance Software Market Outlook 2023
1 Market Overview
1.1 Introduction to the Ambulance Software Market
1.2 Scope of the Study
1.3 Research Objective
1.3.1 Key Market Scope and Segments
1.3.2 Players Covered
1.3.3 Years Considered
2 Executive Summary
2.1 2023 Ambulance Software Industry- Market Statistics
3 Market Dynamics
3.1 Market Drivers
3.2 Market Challenges
3.3 Market Opportunities
3.4 Market Trends
4 Market Factor Analysis
4.1 Porter’s Five Forces
4.2 Market Entropy
4.2.1 Global Ambulance Software Market Companies with Area Served
4.2.2 Products Offerings Global Ambulance Software Market
5 COVID-19 Impact Analysis and Outlook Scenarios
5.1.1 Covid-19 Impact Analysis
5.1.2 post-COVID-19 Scenario- Low Growth Case
5.1.3 post-COVID-19 Scenario- Reference Growth Case
5.1.4 post-COVID-19 Scenario- Low Growth Case
6 Global Ambulance Software Market Trends
6.1 Global Ambulance Software Revenue (USD Million) and CAGR (%) by Type (2018-2030)
6.2 Global Ambulance Software Revenue (USD Million) and CAGR (%) by Applications (2018-2030)
6.3 Global Ambulance Software Revenue (USD Million) and CAGR (%) by regions (2018-2030)
7 Global Ambulance Software Market Revenue (USD Million) by Type, and Applications (2018-2022)
7.1 Global Ambulance Software Revenue (USD Million) by Type (2018-2022)
7.1.1 Global Ambulance Software Revenue (USD Million), Market Share (%) by Type (2018-2022)
7.2 Global Ambulance Software Revenue (USD Million) by Applications (2018-2022)
7.2.1 Global Ambulance Software Revenue (USD Million), Market Share (%) by Applications (2018-2022)
8 Global Ambulance Software Development Regional Status and Outlook
8.1 Global Ambulance Software Revenue (USD Million) By Regions (2018-2022)
8.2 North America Ambulance Software Revenue (USD Million) by Type, and Application (2018-2022)
8.2.1 North America Ambulance Software Revenue (USD Million) by Country (2018-2022)
8.2.2 North America Ambulance Software Revenue (USD Million) by Type (2018-2022)
8.2.3 North America Ambulance Software Revenue (USD Million) by Applications (2018-2022)
8.3 Europe Ambulance Software Revenue (USD Million), by Type, and Applications (USD Million) (2018-2022)
8.3.1 Europe Ambulance Software Revenue (USD Million), by Country (2018-2022)
8.3.2 Europe Ambulance Software Revenue (USD Million) by Type (2018-2022)
8.3.3 Europe Ambulance Software Revenue (USD Million) by Applications (2018-2022)
8.4 Asia Pacific Ambulance Software Revenue (USD Million), and Revenue (USD Million) by Type, and Applications (2018-2022)
8.4.1 Asia Pacific Ambulance Software Revenue (USD Million) by Country (2018-2022)
8.4.2 Asia Pacific Ambulance Software Revenue (USD Million) by Type (2018-2022)
8.4.3 Asia Pacific Ambulance Software Revenue (USD Million) by Applications (2018-2022)
8.5 South America Ambulance Software Revenue (USD Million), by Type, and Applications (2018-2022)
8.5.1 South America Ambulance Software Revenue (USD Million), by Country (2018-2022)
8.5.2 South America Ambulance Software Revenue (USD Million) by Type (2018-2022)
8.5.3 South America Ambulance Software Revenue (USD Million) by Applications (2018-2022)
8.6 Middle East and Africa Ambulance Software Revenue (USD Million), by Type, Technology, Application, Thickness (2018-2022)
8.6.1 Middle East and Africa Ambulance Software Revenue (USD Million) by Country (2018-2022)
8.6.2 Middle East and Africa Ambulance Software Revenue (USD Million) by Type (2018-2022)
8.6.3 Middle East and Africa Ambulance Software Revenue (USD Million) by Applications (2018-2022)
9 Company Profiles
10 Global Ambulance Software Market Revenue (USD Million), by Type, and Applications (2023-2030)
10.1 Global Ambulance Software Revenue (USD Million) and Market Share (%) by Type (2023-2030)
10.1.1 Global Ambulance Software Revenue (USD Million), and Market Share (%) by Type (2023-2030)
10.2 Global Ambulance Software Revenue (USD Million) and Market Share (%) by Applications (2023-2030)
10.2.1 Global Ambulance Software Revenue (USD Million), and Market Share (%) by Applications (2023-2030)
11 Global Ambulance Software Development Regional Status and Outlook Forecast
11.1 Global Ambulance Software Revenue (USD Million) By Regions (2023-2030)
11.2 North America Ambulance Software Revenue (USD Million) by Type, and Applications (2023-2030)
11.2.1 North America Ambulance Software Revenue (USD) Million by Country (2023-2030)
11.2.2 North America Ambulance Software Revenue (USD Million), by Type (2023-2030)
11.2.3 North America Ambulance Software Revenue (USD Million), Market Share (%) by Applications (2023-2030)
11.3 Europe Ambulance Software Revenue (USD Million), by Type, and Applications (2023-2030)
11.3.1 Europe Ambulance Software Revenue (USD Million), by Country (2023-2030)
11.3.2 Europe Ambulance Software Revenue (USD Million), by Type (2023-2030)
11.3.3 Europe Ambulance Software Revenue (USD Million), by Applications (2023-2030)
11.4 Asia Pacific Ambulance Software Revenue (USD Million) by Type, and Applications (2023-2030)
11.4.1 Asia Pacific Ambulance Software Revenue (USD Million), by Country (2023-2030)
11.4.2 Asia Pacific Ambulance Software Revenue (USD Million), by Type (2023-2030)
11.4.3 Asia Pacific Ambulance Software Revenue (USD Million), by Applications (2023-2030)
11.5 South America Ambulance Software Revenue (USD Million), by Type, and Applications (2023-2030)
11.5.1 South America Ambulance Software Revenue (USD Million), by Country (2023-2030)
11.5.2 South America Ambulance Software Revenue (USD Million), by Type (2023-2030)
11.5.3 South America Ambulance Software Revenue (USD Million), by Applications (2023-2030)
11.6 Middle East and Africa Ambulance Software Revenue (USD Million), by Type, and Applications (2023-2030)
11.6.1 Middle East and Africa Ambulance Software Revenue (USD Million), by region (2023-2030)
11.6.2 Middle East and Africa Ambulance Software Revenue (USD Million), by Type (2023-2030)
11.6.3 Middle East and Africa Ambulance Software Revenue (USD Million), by Applications (2023-2030)
12 Methodology and Data Sources
12.1 Methodology/Research Approach
12.1.1 Research Programs/Design
12.1.2 Market Size Estimation
12.1.3 Market Breakdown and Data Triangulation
12.2 Data Sources
12.2.1 Secondary Sources
12.2.2 Primary Sources
12.3 Disclaimer
List of Tables
Table 1 Market Segmentation Analysis
Table 2 Global Ambulance Software Market Companies with Areas Served
Table 3 Products Offerings Global Ambulance Software Market
Table 4 Low Growth Scenario Forecasts
Table 5 Reference Case Growth Scenario
Table 6 High Growth Case Scenario
Table 7 Global Ambulance Software Revenue (USD Million) And CAGR (%) By Type (2018-2030)
Table 8 Global Ambulance Software Revenue (USD Million) And CAGR (%) By Applications (2018-2030)
Table 9 Global Ambulance Software Revenue (USD Million) And CAGR (%) By Regions (2018-2030)
Table 10 Global Ambulance Software Revenue (USD Million) By Type (2018-2022)
Table 11 Global Ambulance Software Revenue Market Share (%) By Type (2018-2022)
Table 12 Global Ambulance Software Revenue (USD Million) By Applications (2018-2022)
Table 13 Global Ambulance Software Revenue Market Share (%) By Applications (2018-2022)
Table 14 Global Ambulance Software Market Revenue (USD Million) By Regions (2018-2022)
Table 15 Global Ambulance Software Market Share (%) By Regions (2018-2022)
Table 16 North America Ambulance Software Revenue (USD Million) By Country (2018-2022)
Table 17 North America Ambulance Software Revenue (USD Million) By Type (2018-2022)
Table 18 North America Ambulance Software Revenue (USD Million) By Applications (2018-2022)
Table 19 Europe Ambulance Software Revenue (USD Million) By Country (2018-2022)
Table 20 Europe Ambulance Software Revenue (USD Million) By Type (2018-2022)
Table 21 Europe Ambulance Software Revenue (USD Million) By Applications (2018-2022)
Table 22 Asia Pacific Ambulance Software Revenue (USD Million) By Country (2018-2022)
Table 23 Asia Pacific Ambulance Software Revenue (USD Million) By Type (2018-2022)
Table 24 Asia Pacific Ambulance Software Revenue (USD Million) By Applications (2018-2022)
Table 25 South America Ambulance Software Revenue (USD Million) By Country (2018-2022)
Table 26 South America Ambulance Software Revenue (USD Million) By Type (2018-2022)
Table 27 South America Ambulance Software Revenue (USD Million) By Applications (2018-2022)
Table 28 Middle East and Africa Ambulance Software Revenue (USD Million) By Region (2018-2022)
Table 29 Middle East and Africa Ambulance Software Revenue (USD Million) By Type (2018-2022)
Table 30 Middle East and Africa Ambulance Software Revenue (USD Million) By Applications (2018-2022)
Table 31 Financial Analysis
Table 32 Global Ambulance Software Revenue (USD Million) By Type (2023-2030)
Table 33 Global Ambulance Software Revenue Market Share (%) By Type (2023-2030)
Table 34 Global Ambulance Software Revenue (USD Million) By Applications (2023-2030)
Table 35 Global Ambulance Software Revenue Market Share (%) By Applications (2023-2030)
Table 36 Global Ambulance Software Market Revenue (USD Million), And Revenue (USD Million) By Regions (2023-2030)
Table 37 North America Ambulance Software Revenue (USD)By Country (2023-2030)
Table 38 North America Ambulance Software Revenue (USD Million) By Type (2023-2030)
Table 39 North America Ambulance Software Revenue (USD Million) By Applications (2023-2030)
Table 40 Europe Ambulance Software Revenue (USD Million) By Country (2023-2030)
Table 41 Europe Ambulance Software Revenue (USD Million) By Type (2023-2030)
Table 42 Europe Ambulance Software Revenue (USD Million) By Applications (2023-2030)
Table 43 Asia Pacific Ambulance Software Revenue (USD Million) By Country (2023-2030)
Table 44 Asia Pacific Ambulance Software Revenue (USD Million) By Type (2023-2030)
Table 45 Asia Pacific Ambulance Software Revenue (USD Million) By Applications (2023-2030)
Table 46 South America Ambulance Software Revenue (USD Million) By Country (2023-2030)
Table 47 South America Ambulance Software Revenue (USD Million) By Type (2023-2030)
Table 48 South America Ambulance Software Revenue (USD Million) By Applications (2023-2030)
Table 49 Middle East and Africa Ambulance Software Revenue (USD Million) By Region (2023-2030)
Table 50 Middle East and Africa Ambulance Software Revenue (USD Million) By Region (2023-2030)
Table 51 Middle East and Africa Ambulance Software Revenue (USD Million) By Type (2023-2030)
Table 52 Middle East and Africa Ambulance Software Revenue (USD Million) By Applications (2023-2030)
Table 53 Research Programs/Design for This Report
Table 54 Key Data Information from Secondary Sources
Table 55 Key Data Information from Primary Sources
List of Figures
Figure 1 Market Scope
Figure 2 Porter’s Five Forces
Figure 3 Global Ambulance Software Revenue (USD Million) By Type (2018-2022)
Figure 4 Global Ambulance Software Revenue Market Share (%) By Type (2022)
Figure 5 Global Ambulance Software Revenue (USD Million) By Applications (2018-2022)
Figure 6 Global Ambulance Software Revenue Market Share (%) By Applications (2022)
Figure 7 Global Ambulance Software Market Revenue (USD Million) By Regions (2018-2022)
Figure 8 Global Ambulance Software Market Share (%) By Regions (2022)
Figure 9 North America Ambulance Software Revenue (USD Million) By Country (2018-2022)
Figure 10 North America Ambulance Software Revenue (USD Million) By Type (2018-2022)
Figure 11 North America Ambulance Software Revenue (USD Million) By Applications (2018-2022)
Figure 12 Europe Ambulance Software Revenue (USD Million) By Country (2018-2022)
Figure 13 Europe Ambulance Software Revenue (USD Million) By Type (2018-2022)
Figure 14 Europe Ambulance Software Revenue (USD Million) By Applications (2018-2022)
Figure 15 Asia Pacific Ambulance Software Revenue (USD Million) By Country (2018-2022)
Figure 16 Asia Pacific Ambulance Software Revenue (USD Million) By Type (2018-2022)
Figure 17 Asia Pacific Ambulance Software Revenue (USD Million) By Applications (2018-2022)
Figure 18 South America Ambulance Software Revenue (USD Million) By Country (2018-2022)
Figure 19 South America Ambulance Software Revenue (USD Million) By Type (2018-2022)
Figure 20 South America Ambulance Software Revenue (USD Million) By Applications (2018-2022)
Figure 21 Middle East and Africa Ambulance Software Revenue (USD Million) By Region (2018-2022)
Figure 22 Middle East and Africa Ambulance Software Revenue (USD Million) By Type (2018-2022)
Figure 23 Middle East and Africa Ambulance Software Revenue (USD Million) By Applications (2018-2022)
Figure 24 Global Ambulance Software Revenue (USD Million) By Type (2023-2030)
Figure 25 Global Ambulance Software Revenue Market Share (%) By Type (2030)
Figure 26 Global Ambulance Software Revenue (USD Million) By Applications (2023-2030)
Figure 27 Global Ambulance Software Revenue Market Share (%) By Applications (2030)
Figure 28 Global Ambulance Software Market Revenue (USD Million) By Regions (2023-2030)
Figure 29 North America Ambulance Software Revenue (USD Million) By Country (2023-2030)
Figure 30 North America Ambulance Software Revenue (USD Million) By Type (2023-2030)
Figure 31 North America Ambulance Software Revenue (USD Million) By Applications (2023-2030)
Figure 32 Europe Ambulance Software Revenue (USD Million) By Country (2023-2030)
Figure 33 Europe Ambulance Software Revenue (USD Million) By Type (2023-2030)
Figure 34 Europe Ambulance Software Revenue (USD Million) By Applications (2023-2030)
Figure 35 Asia Pacific Ambulance Software Revenue (USD Million) By Country (2023-2030)
Figure 36 Asia Pacific Ambulance Software Revenue (USD Million) By Type (2023-2030)
Figure 37 Asia Pacific Ambulance Software Revenue (USD Million) By Applications (2023-2030)
Figure 38 South America Ambulance Software Revenue (USD Million) By Country (2023-2030)
Figure 39 South America Ambulance Software Revenue (USD Million) By Type (2023-2030)
Figure 40 South America Ambulance Software Revenue (USD Million) By Applications (2023-2030)
Figure 41 Middle East and Africa Ambulance Software Revenue (USD Million) By Region (2023-2030)
Figure 42 Middle East and Africa Ambulance Software Revenue (USD Million) By Region (2023-2030)
Figure 43 Middle East and Africa Ambulance Software Revenue (USD Million) By Type (2023-2030)
Figure 44 Middle East and Africa Ambulance Software Revenue (USD Million) By Applications (2023-2030)
Figure 45 Bottom-Up and Top-Down Approaches for This Report
Figure 46 Data Triangulation
