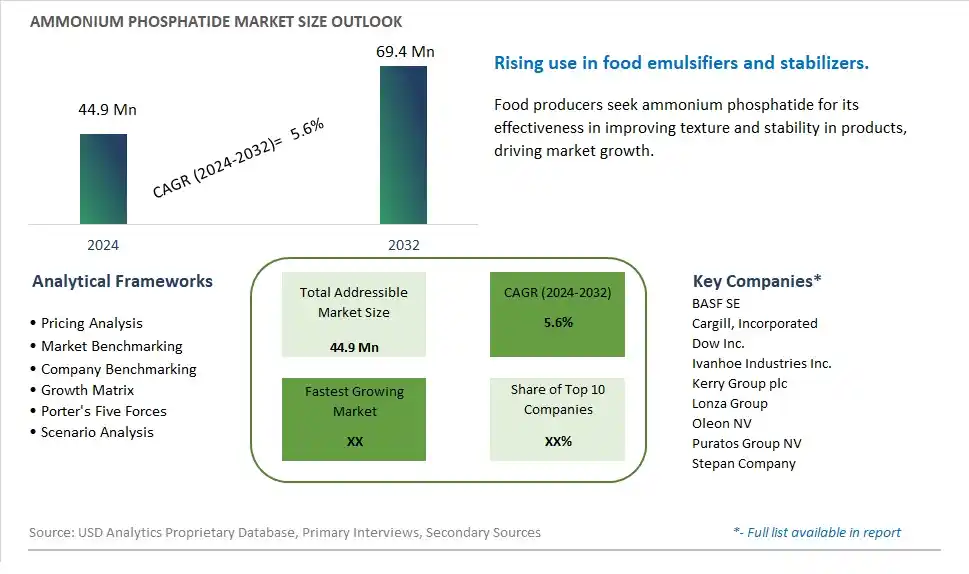
Global Ammonium Phosphatide Market Size is valued at $44.9 Million in 2024 and is forecast to register a growth rate (CAGR) of 5.6% to reach $69.4 Million by 2032.
The global Ammonium Phosphatide Market Comprehensive Study analyzes and forecasts the market size across 6 regions and 24 countries for diverse segments -By Type (Natural, Synthetic), By Usage (Emulsifier, Functional Additive, Others), By Application (Bakery, Dairy, Fine Food, Margarine, Soy, Others)
An Introduction to Ammonium Phosphatide Market
The Ammonium Phosphatide market in 2024 is experiencing significant growth, driven by its essential role as an emulsifier in the food industry, particularly in chocolate and confectionery production. Ammonium phosphatide is valued for its ability to improve texture, reduce viscosity, and extend the shelf life of products. The market is supported by the increasing demand for high-quality and cost-effective food additives. Advances in manufacturing processes are enhancing the purity and performance of ammonium phosphatide, catering to the needs of food manufacturers seeking efficient and reliable emulsifying agents.
Ammonium Phosphatide Competitive Landscape
The market report analyses the leading companies in the industry including BASF SE, Cargill, Incorporated, Dow Inc., Ivanhoe Industries Inc., Kerry Group plc, Lonza Group, Oleon NV, Puratos Group NV, Stepan Company, and Others.
Ammonium Phosphatide Market Dynamics
Ammonium Phosphatide Market Trend: Increasing Use in Confectionery and Bakery Products
The ammonium phosphatide market is experiencing a prominent trend of increasing use in the confectionery and bakery industries. This emulsifier is preferred for its ability to improve texture, extend shelf life, and enhance the overall quality of products like chocolates, cakes, and pastries. With the rising demand for premium and high-quality confectionery items, manufacturers are increasingly incorporating ammonium phosphatide to meet consumer expectations. Additionally, the trend towards clean-label products is driving the adoption of ammonium phosphatide, as it is seen as a safer and more acceptable additive compared to synthetic emulsifiers.
Ammonium Phosphatide Market Driver: Growing Demand for Processed Foods
A major driver for the ammonium phosphatide market is the growing global demand for processed and convenience foods. As lifestyles become busier, consumers are leaning more towards ready-to-eat and easy-to-prepare food options, which often require effective emulsifiers to maintain product stability and quality. Ammonium phosphatide is widely used in processed food products to improve their texture and extend their shelf life, thereby supporting the growing demand. Moreover, the expansion of the food processing industry, especially in emerging markets, is significantly driving the demand for ammonium phosphatide as manufacturers aim to meet the increasing consumer demand for processed food products.
Ammonium Phosphatide Market Opportunity: Expansion into Emerging Markets
Expansion into emerging markets presents a substantial opportunity for the ammonium phosphatide market. Countries in Asia-Pacific, Latin America, and Africa are witnessing rapid urbanization and an increase in disposable incomes, leading to a rise in the consumption of processed and convenience foods. This provides a lucrative opportunity for manufacturers of ammonium phosphatide to expand their presence and cater to the growing food processing industry in these regions. Additionally, increased investments in food manufacturing infrastructure and the growing trend of westernized eating habits in these markets are expected to further boost the demand for ammonium phosphatide. By focusing on these emerging markets, manufacturers can capitalize on the untapped potential and drive significant market growth.
Ammonium Phosphatide Market Share Analysis: Natural Ammonium Phosphatide segment generated the highest revenue share in the industry
The Natural Ammonium Phosphatide segment emerges as the largest in the Ammonium Phosphatide market, showcasing substantial growth and widespread adoption. Natural Ammonium Phosphatide is derived from natural sources, such as sunflower lecithin, and is preferred by consumers and manufacturers alike due to its clean label and natural origin. This segment dominates the market due to several key advantages. Firstly, natural Ammonium Phosphatide is perceived as a healthier and more environmentally friendly alternative to synthetic counterparts, aligning with the growing consumer demand for clean-label ingredients. Additionally, natural Ammonium Phosphatide offers functional benefits such as emulsification, stabilization, and texture improvement in food and beverage products, making it a versatile ingredient for manufacturers. With increasing consumer awareness of health and wellness, coupled with the clean-label trend driving demand for natural ingredients, the Natural Ammonium Phosphatide segment is positioned to maintain its market leadership and drive significant growth in the Ammonium Phosphatide market.
Ammonium Phosphatide Market Share Analysis: Emulsifier is the fastest growing segment over the forecast period to 2032
The Emulsifier segment within the Ammonium Phosphatide Market is poised for rapid growth leading up to 2032. This segment's accelerated expansion is driven by several key factors. Emulsifiers, such as Ammonium Phosphatide, play a crucial role in food and beverage applications by improving the stability, texture, and shelf life of products. With the increasing demand for processed and convenience foods, the need for effective emulsifiers like Ammonium Phosphatide is on the rise. Further, Ammonium Phosphatide is preferred over traditional emulsifiers due to its clean label, natural origin, and versatile functionality. It is widely used in a variety of products, including chocolates, confectionery, baked goods, and dairy products, highlighting its broad application scope. The Emulsifier segment also benefits from ongoing research and development efforts aimed at enhancing the performance and functionality of Ammonium Phosphatide in food formulations. With the continuous innovation and growing consumer preference for clean-label ingredients, the Emulsifier segment is well-positioned to experience exponential growth and emerge as a dominant force within the Ammonium Phosphatide market by 2032.
Ammonium Phosphatide Market Share Analysis: Bakery segment generated the highest revenue share in the industry
The Bakery segment stands out as the largest in the Ammonium Phosphatide Market, showcasing substantial growth and widespread adoption. Ammonium Phosphatide is extensively used in the bakery industry due to its emulsification and stabilizing properties, which enhance the texture, volume, and shelf life of baked goods. This segment dominates the market due to several key factors. Firstly, the bakery sector experiences consistent demand for various products such as bread, cakes, pastries, and cookies, driving the need for effective emulsifiers like Ammonium Phosphatide. Further, Ammonium Phosphatide is preferred by bakers and manufacturers for its clean label, natural origin, and ability to produce high-quality baked goods. The Bakery segment also benefits from continuous innovations in bakery formulations, packaging designs, and consumer preferences for healthier and clean-label ingredients. With the growing global consumption of bakery products and the versatile functionality of Ammonium Phosphatide in bakery applications, the Bakery segment is positioned to maintain its market leadership and drive significant growth in the Ammonium Phosphatide market.
Ammonium Phosphatide Market Segmentation
By Type
Natural
Synthetic
By Usage
Emulsifier
Functional Additive
Others
By Application
Bakery
Dairy
Fine Food
Margarine
Soy
Others
Countries Analyzed
North America (US, Canada, Mexico)
Europe (Germany, UK, France, Spain, Italy, Russia, Rest of Europe)
Asia Pacific (China, India, Japan, South Korea, Australia, South East Asia, Rest of Asia)
South America (Brazil, Argentina, Rest of South America)
Middle East and Africa (Saudi Arabia, UAE, Rest of Middle East, South Africa, Egypt, Rest of Africa)
Ammonium Phosphatide Companies Profiled in the Study
BASF SE
Cargill, Incorporated
Dow Inc.
Ivanhoe Industries Inc.
Kerry Group plc
Lonza Group
Oleon NV
Puratos Group NV
Stepan Company
*- List Not Exhaustive
Chapter 1. TABLE OF CONTENTS
Chapter 2. Introduction to Ammonium Phosphatide Market
2.1. Market Overview
2.2. Key Statistics and Report Highlights
2.3. Scope of the Comprehensive Study
2.3.1. Market Definition
2.3.2 Countries and Regions Covered
2.3.3 Research Objective
2.3.4 Units, Currency, and Conversions
2.3.5 Industry Value Chain
2.4. Key Market Segments
2.5. Key Companies
2.6. Study Period
Chapter 3. Strategic Analysis Review
3.1. Ammonium Phosphatide Pricing Analysis and Forecast
3.2. Porter’s Five Forces
3.3. Market Ecosystem
3.4. SWOT Analysis
3.5. Regulatory Scenario
3.3. Effects of Inflation, Russia-Ukraine War, moderating economic growth, and other macroeconomic factors
Chapter 4. Competitive Landscape
4.1. Market Share Analysis
4.1.1. Global Ammonium Phosphatide Market Share by Company, 2023
4.1.2. Product Offerings of Leading Ammonium Phosphatide Companies
4.2. Market Entropy
4.2.1. New Product Launches in the Industry
4.2.2. Mergers, Acquisitions, Joint ventures, and Partnerships
4.3. Key Strategies and Best Practices
Chapter 5. Global Market Projections: Best, Reference, and Low Case Scenarios
5.1. Growth Analysis- Case Scenario Definitions
5.2. Low Growth Case Scenario Forecasts
5.3. Reference Growth Case Scenario Forecasts
5.4. High Growth Case Scenario Forecasts
Chapter 6. Market Dynamics
6.1. Ammonium Phosphatide Market Drivers
6.2. Ammonium Phosphatide Market Challenges
6.6. Ammonium Phosphatide Market Opportunities
6.4. Ammonium Phosphatide Market Trends
Chapter 7. Global Ammonium Phosphatide Market Outlook Trends
7.1. Global Ammonium Phosphatide Revenue (USD Million) and CAGR (%) by Type (2021-2032)
7.2. Global Ammonium Phosphatide Revenue (USD Million) and CAGR (%) by Application (2021-2032)
7.3. Global Ammonium Phosphatide Revenue (USD Million) and CAGR (%) by Product (2021-2032)
By Type
Natural
Synthetic
By Usage
Emulsifier
Functional Additive
Others
By Application
Bakery
Dairy
Fine Food
Margarine
Soy
Others
Chapter 8. Global Ammonium Phosphatide Regional Analysis and Outlook
8.1. Global Ammonium Phosphatide Revenue (USD Million) By Regions (2021- 2032)
8.2. North America Ammonium Phosphatide Revenue (USD Million) by Country (2021-2032)
8.2.1. United States Ammonium Phosphatide Regional Analysis and Outlook
8.2.2. Canada Ammonium Phosphatide Regional Analysis and Outlook
8.2.3. Mexico Ammonium Phosphatide Regional Analysis and Outlook
8.3. Europe Ammonium Phosphatide Revenue (USD Million), by Country (2021-2032)
8.3.1. Germany Ammonium Phosphatide Regional Analysis and Outlook
8.3.2. France Ammonium Phosphatide Regional Analysis and Outlook
8.3.3. United Kingdom Ammonium Phosphatide Regional Analysis and Outlook
8.3.4. Spain Ammonium Phosphatide Regional Analysis and Outlook
8.3.5. Italy Ammonium Phosphatide Regional Analysis and Outlook
8.3.6. Russia Ammonium Phosphatide Regional Analysis and Outlook
8.3.7. Rest of Europe Ammonium Phosphatide Regional Analysis and Outlook
8.4. Asia Pacific Ammonium Phosphatide Revenue (USD Million) by Country (2021-2032)
8.4.1. China Ammonium Phosphatide Regional Analysis and Outlook
8.4.2. Japan Ammonium Phosphatide Regional Analysis and Outlook
8.4.3. India Ammonium Phosphatide Regional Analysis and Outlook
8.4.4. South Korea Ammonium Phosphatide Regional Analysis and Outlook
8.4.5. Australia Ammonium Phosphatide Regional Analysis and Outlook
8.4.6. South East Asia Ammonium Phosphatide Regional Analysis and Outlook
8.4.7. Rest of Asia Pacific Ammonium Phosphatide Regional Analysis and Outlook
8.5. South America Ammonium Phosphatide Revenue (USD Million), by Country (2021-2032)
8.5.1. Brazil Ammonium Phosphatide Regional Analysis and Outlook
8.5.2. Argentina Ammonium Phosphatide Regional Analysis and Outlook
8.5.3. Rest of South America Ammonium Phosphatide Regional Analysis and Outlook
8.6. Middle East and Africa Ammonium Phosphatide Revenue (USD Million) by Country (2021-2032)
8.6.1. Middle East Ammonium Phosphatide Regional Analysis and Outlook
8.6.2. Africa Ammonium Phosphatide Regional Analysis and Outlook
Chapter 9. North America Ammonium Phosphatide Analysis and Outlook
9.1. North America Ammonium Phosphatide Revenue (USD Million) by Segments (2021-2032)
9.1.1. North America Ammonium Phosphatide Revenue (USD Million) by Type (2021-2032)
9.1.2. North America Ammonium Phosphatide Revenue (USD Million) by Application (2021-2032)
9.1.3. North America Ammonium Phosphatide Revenue (USD Million) by Product (2021-2032)
By Type
Natural
Synthetic
By Usage
Emulsifier
Functional Additive
Others
By Application
Bakery
Dairy
Fine Food
Margarine
Soy
Others
Chapter 10. Europe Ammonium Phosphatide Analysis and Outlook
10.1. Europe Ammonium Phosphatide Revenue (USD Million), by Segments (USD Million) (2021-2032)
10.1.1. Europe Ammonium Phosphatide Revenue (USD Million) by Type (2021-2032)
10.1.2. Europe Ammonium Phosphatide Revenue (USD Million) by Application (2021-2032)
10.1.3. Europe Ammonium Phosphatide Revenue (USD Million) by Product (2021-2032)
By Type
Natural
Synthetic
By Usage
Emulsifier
Functional Additive
Others
By Application
Bakery
Dairy
Fine Food
Margarine
Soy
Others
Chapter 11. Asia Pacific Ammonium Phosphatide Analysis and Outlook
11.1. Asia Pacific Ammonium Phosphatide Revenue (USD Million), and Revenue (USD Million) by Segments (2021-2032)
11.1.1. Asia Pacific Ammonium Phosphatide Revenue (USD Million) by Type (2021-2032)
11.1.2. Asia Pacific Ammonium Phosphatide Revenue (USD Million) by Application (2021-2032)
11.1.3. Asia Pacific Ammonium Phosphatide Revenue (USD Million) by Product (2021-2032)
By Type
Natural
Synthetic
By Usage
Emulsifier
Functional Additive
Others
By Application
Bakery
Dairy
Fine Food
Margarine
Soy
Others
Chapter 12. South America Ammonium Phosphatide Analysis and Outlook
12.1. South America Ammonium Phosphatide Revenue (USD Million), by Segments (2021-2032)
12.1.1. South America Ammonium Phosphatide Revenue (USD Million) by Type (2021-2032)
12.1.2. South America Ammonium Phosphatide Revenue (USD Million) by Application (2021-2032)
12.1.3. South America Ammonium Phosphatide Revenue (USD Million) by Product (2021-2032)
By Type
Natural
Synthetic
By Usage
Emulsifier
Functional Additive
Others
By Application
Bakery
Dairy
Fine Food
Margarine
Soy
Others
Chapter 13. Middle East and Africa Ammonium Phosphatide Analysis and Outlook
13.1. Middle East and Africa Ammonium Phosphatide Revenue (USD Million), by Segments (2021-2032)
13.1.1. Middle East and Africa Ammonium Phosphatide Revenue (USD Million) by Type (2021-2032)
13.1.2. Middle East and Africa Ammonium Phosphatide Revenue (USD Million) by Application (2021-2032)
13.1.3. Middle East and Africa Ammonium Phosphatide Revenue (USD Million) by Product (2021-2032)
By Type
Natural
Synthetic
By Usage
Emulsifier
Functional Additive
Others
By Application
Bakery
Dairy
Fine Food
Margarine
Soy
Others
Chapter 14. Ammonium Phosphatide Company Profiles
14.1 Business Overview
14.2 Product Profiles
14.3 SWOT Profiles
14.5 Recent Developments
14.6 Financial Profile
List of Companies
BASF SE
Cargill, Incorporated
Dow Inc.
Ivanhoe Industries Inc.
Kerry Group plc
Lonza Group
Oleon NV
Puratos Group NV
Stepan Company
15. Methodology and Data Sources
15.1 Customization Offerings
15.2 Subscription Services
15.3 Related Reports
15.4 Publisher Expertise
LIST OF TABLES
Table 1 Market Segmentation Analysis
Table 2 Global Ammonium Phosphatide Market Share of Leading Companies, 2023
Table 3 Product Offerings of Leading Companies
Table 4 Low Growth Scenario Forecasts
Table 5 Reference Case Growth Scenario
Table 6 High Growth Case Scenario
Table 7 Global Ammonium Phosphatide Revenue (USD Million) And CAGR (%) By Type (2021-2032)
Table 8 Global Ammonium Phosphatide Revenue (USD Million) And CAGR (%) By Application (2021-2032)
Table 9 Global Ammonium Phosphatide Revenue (USD Million) And CAGR (%) By Product (2021-2032)
Table 10 Global Ammonium Phosphatide Market Revenue (USD Million) By Regions (2021-2032)
Table 11 Global Ammonium Phosphatide Market Share (%) By Regions (2021-2032)
Table 12 North America Ammonium Phosphatide Revenue (USD Million) By Country (2021-2032)
Table 13 Europe Ammonium Phosphatide Revenue (USD Million) By Country (2021-2032)
Table 14 Asia Pacific Ammonium Phosphatide Revenue (USD Million) By Country (2021-2032)
Table 15 South America Ammonium Phosphatide Revenue (USD Million) By Country (2021-2032)
Table 16 Middle East and Africa Ammonium Phosphatide Revenue (USD Million) By Region (2021-2032)
Table 17 North America Ammonium Phosphatide Revenue (USD Million) By Type (2021-2032)
Table 18 North America Ammonium Phosphatide Revenue (USD Million) By Application (2021-2032)
Table 19 North America Ammonium Phosphatide Revenue (USD Million) By Product (2021-2032)
Table 20 Europe Ammonium Phosphatide Revenue (USD Million) By Type (2021-2032)
Table 21 Europe Ammonium Phosphatide Revenue (USD Million) By Application (2021-2032)
Table 22 Europe Ammonium Phosphatide Revenue (USD Million) By Product (2021-2032)
Table 23 Asia Pacific Ammonium Phosphatide Revenue (USD Million) By Type (2021-2032)
Table 24 Asia Pacific Ammonium Phosphatide Revenue (USD Million) By Application (2021-2032)
Table 25 Asia Pacific Ammonium Phosphatide Revenue (USD Million) By Product (2021-2032)
Table 26 South America Ammonium Phosphatide Revenue (USD Million) By Type (2021-2032)
Table 27 South America Ammonium Phosphatide Revenue (USD Million) By Application (2021-2032)
Table 28 South America Ammonium Phosphatide Revenue (USD Million) By Product (2021-2032)
Table 29 Middle East and Africa Ammonium Phosphatide Revenue (USD Million) By Type (2021-2032)
Table 30 Middle East and Africa Ammonium Phosphatide Revenue (USD Million) By Application (2021-2032)
Table 31 Middle East and Africa Ammonium Phosphatide Revenue (USD Million) By Product (2021-2032)
LIST OF FIGURES
Figure 1. Market Scope
Figure 2. Pricing Forecasts Per Unit, 2023- 2032
Figure 3. Porter’s Five Forces
Figure 4. Global Ammonium Phosphatide Market Revenue (USD Million) By Regions (2021-2032)
Figure 5. Global Ammonium Phosphatide Market Share (%) By Regions (2023)
Figure 6. North America Ammonium Phosphatide Revenue (USD Million) By Country (2021-2032)
Figure 7. United States Ammonium Phosphatide Revenue (USD Million) By Country (2021-2032)
Figure 8. Canada Ammonium Phosphatide Revenue (USD Million) By Country (2021-2032)
Figure 9. Mexico Ammonium Phosphatide Revenue (USD Million) By Country (2021-2032)
Figure 10. Europe Ammonium Phosphatide Revenue (USD Million) By Country (2021-2032)
Figure 11. Germany Ammonium Phosphatide Revenue (USD Million) By Country (2021-2032)
Figure 12. France Ammonium Phosphatide Revenue (USD Million) By Country (2021-2032)
Figure 13. United Kingdom Ammonium Phosphatide Revenue (USD Million) By Country (2021-2032)
Figure 14. Spain Ammonium Phosphatide Revenue (USD Million) By Country (2021-2032)
Figure 15. Italy Ammonium Phosphatide Revenue (USD Million) By Country (2021-2032)
Figure 16. Russia Ammonium Phosphatide Revenue (USD Million) By Country (2021-2032)
Figure 17. Rest of Europe Ammonium Phosphatide Revenue (USD Million) By Country (2021-2032)
Figure 11. Asia Pacific Ammonium Phosphatide Revenue (USD Million) By Country (2021-2032)
Figure 12. China Ammonium Phosphatide Revenue (USD Million) By Country (2021-2032)
Figure 13. Japan Ammonium Phosphatide Revenue (USD Million) By Country (2021-2032)
Figure 14. India Ammonium Phosphatide Revenue (USD Million) By Country (2021-2032)
Figure 15. South Korea Ammonium Phosphatide Revenue (USD Million) By Country (2021-2032)
Figure 16. Australia Ammonium Phosphatide Revenue (USD Million) By Country (2021-2032)
Figure 17. South East Asia Ammonium Phosphatide Revenue (USD Million) By Country (2021-2032)
Figure 18. South America Ammonium Phosphatide Revenue (USD Million) By Country (2021-2032)
Figure 19. Brazil Ammonium Phosphatide Revenue (USD Million) By Country (2021-2032)
Figure 20. Argentina Ammonium Phosphatide Revenue (USD Million) By Country (2021-2032)
Figure 21. Rest of Asia Pacific Ammonium Phosphatide Revenue (USD Million) By Country (2021-2032)
Figure 22. Middle East and Africa Ammonium Phosphatide Revenue (USD Million) By Region (2021-2032)
Figure 23. Saudi Arabia Ammonium Phosphatide Revenue (USD Million) By Region (2021-2032)
Figure 24. The UAE Ammonium Phosphatide Revenue (USD Million) By Region (2021-2032)
Figure 25. Rest of Middle East Ammonium Phosphatide Revenue (USD Million) By Region (2021-2032)
Figure 26. South Africa Ammonium Phosphatide Revenue (USD Million) By Region (2021-2032)
Figure 27. Africa Ammonium Phosphatide Revenue (USD Million) By Region (2021-2032)
Figure 28. North America Ammonium Phosphatide Revenue (USD Million) By Type (2021-2032)
Figure 29. North America Ammonium Phosphatide Revenue (USD Million) By Application (2021-2032)
Figure 30. North America Ammonium Phosphatide Revenue (USD Million) By Product (2021-2032)
Figure 31. Europe Ammonium Phosphatide Revenue (USD Million) By Type (2021-2032)
Figure 32. Europe Ammonium Phosphatide Revenue (USD Million) By Application (2021-2032)
Figure 33. Europe Ammonium Phosphatide Revenue (USD Million) By Product (2021-2032)
Figure 34. Asia Pacific Ammonium Phosphatide Revenue (USD Million) By Type (2021-2032)
Figure 35. Asia Pacific Ammonium Phosphatide Revenue (USD Million) By Application (2021-2032)
Figure 36. Asia Pacific Ammonium Phosphatide Revenue (USD Million) By Product (2021-2032)
Figure 37. South America Ammonium Phosphatide Revenue (USD Million) By Type (2021-2032)
Figure 38. South America Ammonium Phosphatide Revenue (USD Million) By Application (2021-2032)
Figure 39. South America Ammonium Phosphatide Revenue (USD Million) By Product (2021-2032)
Figure 40. Middle East and Africa Ammonium Phosphatide Revenue (USD Million) By Type (2021-2032)
Figure 41. Middle East and Africa Ammonium Phosphatide Revenue (USD Million) By Application (2021-2032)
Figure 42. Middle East and Africa Ammonium Phosphatide Revenue (USD Million) By Product (2021-2032)
By Type
Natural
Synthetic
By Usage
Emulsifier
Functional Additive
Others
By Application
Bakery
Dairy
Fine Food
Margarine
Soy
Others
Countries Analyzed
North America (US, Canada, Mexico)
Europe (Germany, UK, France, Spain, Italy, Russia, Rest of Europe)
Asia Pacific (China, India, Japan, South Korea, Australia, South East Asia, Rest of Asia)
South America (Brazil, Argentina, Rest of South America)
Middle East and Africa (Saudi Arabia, UAE, Rest of Middle East, South Africa, Egypt, Rest of Africa)
