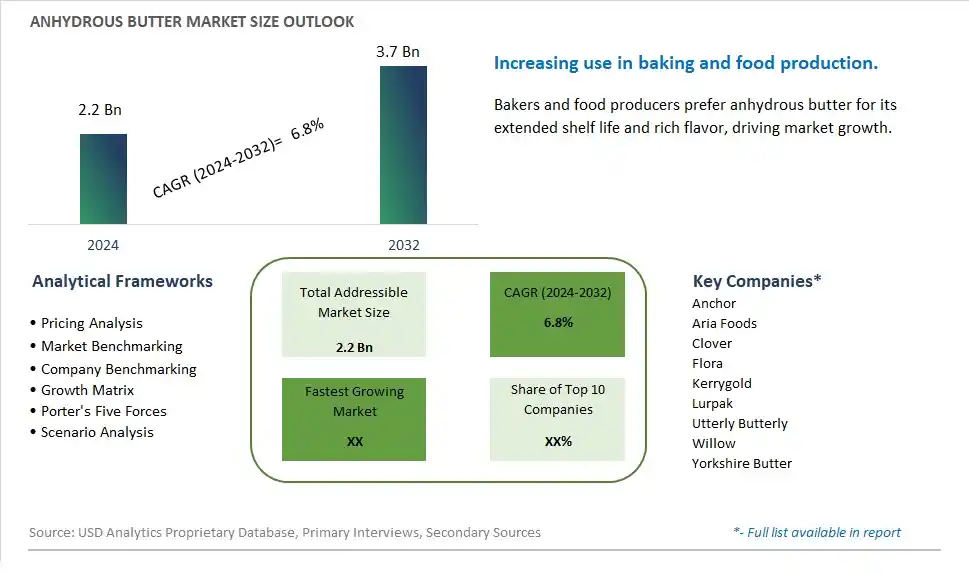
Global Anhydrous Butter Market Size is valued at $2.2 Billion in 2024 and is forecast to register a growth rate (CAGR) of 6.8% to reach $3.7 Billion by 2032.
The global Anhydrous Butter Market Comprehensive Study analyzes and forecasts the market size across 6 regions and 24 countries for diverse segments -By Type (Unsalted Butter, Salted Butter), By Application (Baking, Making Sauce, Fried Food, Others)
An Introduction to Anhydrous Butter Market
The Anhydrous Butter market in 2024 is witnessing robust growth, driven by its extensive use in the food processing and bakery industries. Anhydrous butter, which contains minimal moisture and higher fat content, is valued for its long shelf life, stable consistency, and rich flavor. The market is supported by the increasing demand for high-quality ingredients in premium baked goods, confectioneries, and convenience foods. Advances in dairy processing technologies are enhancing the production efficiency and quality of anhydrous butter. Additionally, the trend towards clean-label and natural ingredients is further boosting its market appeal.
Anhydrous Butter Competitive Landscape
The market report analyses the leading companies in the industry including Anchor, Aria Foods, Clover, Flora, Kerrygold, Lurpak, Utterly Butterly, Willow, Yorkshire Butter, and Others.
Anhydrous Butter Market Dynamics
Anhydrous Butter Market Trend: Increasing Demand for Long-Shelf-Life Dairy Products
The anhydrous butter market is witnessing a significant trend towards increasing demand for long-shelf-life dairy products. As consumers seek convenient and durable food options, anhydrous butter, with its extended shelf life and storage stability, is becoming increasingly popular. This trend is particularly notable in regions with limited refrigeration infrastructure, as well as among manufacturers looking to reduce waste and enhance the efficiency of their supply chains. Additionally, the rise in e-commerce and international trade of dairy products is fueling this trend, as anhydrous butter’s stable nature makes it an ideal candidate for long-distance transportation and storage.
Anhydrous Butter Market Driver: Growing Food Processing Industry
A major driver for the anhydrous butter market is the growing food processing industry. As the demand for processed and packaged foods continues to rise globally, food manufacturers are increasingly incorporating anhydrous butter as a key ingredient due to its versatility and functionality. It is widely used in bakery products, confectioneries, and ready-to-eat meals, enhancing flavor and texture while providing a reliable source of dairy fat. The food processing industry's expansion, driven by urbanization, changing lifestyles, and increased disposable incomes, is significantly boosting the demand for anhydrous butter.
Anhydrous Butter Market Opportunity: Expansion into Emerging Markets
Expanding into emerging markets presents a substantial opportunity for the anhydrous butter market. Countries in Asia-Pacific, Latin America, and Africa are experiencing rapid urbanization and a growing middle class, leading to increased consumption of dairy products and processed foods. The demand for high-quality, long-shelf-life dairy ingredients like anhydrous butter is rising in these regions, driven by both consumer preferences and the expanding food processing industry. By establishing a strong presence in these emerging markets and leveraging local distribution channels, manufacturers can capitalize on the growing demand and drive significant market growth.
Anhydrous Butter Market Share Analysis: Unsalted Butter segment generated the highest revenue share in the industry
The Unsalted Butter segment emerges as the largest in the Anhydrous Butter Market, showcasing substantial growth and widespread consumer preference. Unsalted butter, also known as sweet butter, is a versatile dairy product widely used in cooking, baking, and food preparation. This segment dominates the market due to several key factors. Firstly, unsalted butter is preferred by consumers and chefs for its pure and natural flavor, allowing them to control the salt content in their recipes. Additionally, unsalted butter is versatile and can be used in a wide range of dishes, including pastries, sauces, sautéed dishes, and desserts. The Unsalted Butter segment also benefits from its natural ingredients, without additives or preservatives, making it a healthier option for consumers conscious of their dietary choices. With the increasing demand for natural and minimally processed ingredients in food products, the Unsalted Butter segment is positioned to maintain its market leadership and drive significant growth in the Anhydrous Butter market.
Anhydrous Butter Market Share Analysis: Baking is the fastest growing segment over the forecast period to 2032
The Baking segment within the Anhydrous Butter Market is poised for rapid growth leading up to 2032. This segment's accelerated expansion is driven by several key factors. Firstly, there's a growing global trend towards home baking, artisanal bakeries, and specialty baked goods, driving the demand for high-quality ingredients like anhydrous butter. Anhydrous butter is preferred by bakers for its superior baking properties, including its ability to enhance texture, flavor, and moisture retention in baked goods. Further, the versatility of anhydrous butter allows it to be used in a wide range of baked products, such as cakes, cookies, pastries, and bread, catering to diverse consumer preferences. The Baking segment also benefits from continuous innovations in baking techniques, recipes, and product formulations, further fueling its growth. With consumers increasingly seeking premium and artisanal baked goods, the Baking segment is positioned to experience exponential growth and emerge as a dominant force within the Anhydrous Butter Market by 2032.
Anhydrous Butter Market Segmentation
By Type
Unsalted Butter
Salted Butter
By Application
Baking
Making Sauce
Fried Food
Others
Countries Analyzed
North America (US, Canada, Mexico)
Europe (Germany, UK, France, Spain, Italy, Russia, Rest of Europe)
Asia Pacific (China, India, Japan, South Korea, Australia, South East Asia, Rest of Asia)
South America (Brazil, Argentina, Rest of South America)
Middle East and Africa (Saudi Arabia, UAE, Rest of Middle East, South Africa, Egypt, Rest of Africa)
Anhydrous Butter Companies Profiled in the Study
Anchor
Aria Foods
Clover
Flora
Kerrygold
Lurpak
Utterly Butterly
Willow
Yorkshire Butter
*- List Not Exhaustive
Chapter 1. TABLE OF CONTENTS
Chapter 2. Introduction to Anhydrous Butter Market
2.1. Market Overview
2.2. Key Statistics and Report Highlights
2.3. Scope of the Comprehensive Study
2.3.1. Market Definition
2.3.2 Countries and Regions Covered
2.3.3 Research Objective
2.3.4 Units, Currency, and Conversions
2.3.5 Industry Value Chain
2.4. Key Market Segments
2.5. Key Companies
2.6. Study Period
Chapter 3. Strategic Analysis Review
3.1. Anhydrous Butter Pricing Analysis and Forecast
3.2. Porter’s Five Forces
3.3. Market Ecosystem
3.4. SWOT Analysis
3.5. Regulatory Scenario
3.3. Effects of Inflation, Russia-Ukraine War, moderating economic growth, and other macroeconomic factors
Chapter 4. Competitive Landscape
4.1. Market Share Analysis
4.1.1. Global Anhydrous Butter Market Share by Company, 2023
4.1.2. Product Offerings of Leading Anhydrous Butter Companies
4.2. Market Entropy
4.2.1. New Product Launches in the Industry
4.2.2. Mergers, Acquisitions, Joint ventures, and Partnerships
4.3. Key Strategies and Best Practices
Chapter 5. Global Market Projections: Best, Reference, and Low Case Scenarios
5.1. Growth Analysis- Case Scenario Definitions
5.2. Low Growth Case Scenario Forecasts
5.3. Reference Growth Case Scenario Forecasts
5.4. High Growth Case Scenario Forecasts
Chapter 6. Market Dynamics
6.1. Anhydrous Butter Market Drivers
6.2. Anhydrous Butter Market Challenges
6.6. Anhydrous Butter Market Opportunities
6.4. Anhydrous Butter Market Trends
Chapter 7. Global Anhydrous Butter Market Outlook Trends
7.1. Global Anhydrous Butter Revenue (USD Million) and CAGR (%) by Type (2021-2032)
7.2. Global Anhydrous Butter Revenue (USD Million) and CAGR (%) by Application (2021-2032)
7.3. Global Anhydrous Butter Revenue (USD Million) and CAGR (%) by Product (2021-2032)
By Type
Unsalted Butter
Salted Butter
By Application
Baking
Making Sauce
Fried Food
Others
Chapter 8. Global Anhydrous Butter Regional Analysis and Outlook
8.1. Global Anhydrous Butter Revenue (USD Million) By Regions (2021- 2032)
8.2. North America Anhydrous Butter Revenue (USD Million) by Country (2021-2032)
8.2.1. United States Anhydrous Butter Regional Analysis and Outlook
8.2.2. Canada Anhydrous Butter Regional Analysis and Outlook
8.2.3. Mexico Anhydrous Butter Regional Analysis and Outlook
8.3. Europe Anhydrous Butter Revenue (USD Million), by Country (2021-2032)
8.3.1. Germany Anhydrous Butter Regional Analysis and Outlook
8.3.2. France Anhydrous Butter Regional Analysis and Outlook
8.3.3. United Kingdom Anhydrous Butter Regional Analysis and Outlook
8.3.4. Spain Anhydrous Butter Regional Analysis and Outlook
8.3.5. Italy Anhydrous Butter Regional Analysis and Outlook
8.3.6. Russia Anhydrous Butter Regional Analysis and Outlook
8.3.7. Rest of Europe Anhydrous Butter Regional Analysis and Outlook
8.4. Asia Pacific Anhydrous Butter Revenue (USD Million) by Country (2021-2032)
8.4.1. China Anhydrous Butter Regional Analysis and Outlook
8.4.2. Japan Anhydrous Butter Regional Analysis and Outlook
8.4.3. India Anhydrous Butter Regional Analysis and Outlook
8.4.4. South Korea Anhydrous Butter Regional Analysis and Outlook
8.4.5. Australia Anhydrous Butter Regional Analysis and Outlook
8.4.6. South East Asia Anhydrous Butter Regional Analysis and Outlook
8.4.7. Rest of Asia Pacific Anhydrous Butter Regional Analysis and Outlook
8.5. South America Anhydrous Butter Revenue (USD Million), by Country (2021-2032)
8.5.1. Brazil Anhydrous Butter Regional Analysis and Outlook
8.5.2. Argentina Anhydrous Butter Regional Analysis and Outlook
8.5.3. Rest of South America Anhydrous Butter Regional Analysis and Outlook
8.6. Middle East and Africa Anhydrous Butter Revenue (USD Million) by Country (2021-2032)
8.6.1. Middle East Anhydrous Butter Regional Analysis and Outlook
8.6.2. Africa Anhydrous Butter Regional Analysis and Outlook
Chapter 9. North America Anhydrous Butter Analysis and Outlook
9.1. North America Anhydrous Butter Revenue (USD Million) by Segments (2021-2032)
9.1.1. North America Anhydrous Butter Revenue (USD Million) by Type (2021-2032)
9.1.2. North America Anhydrous Butter Revenue (USD Million) by Application (2021-2032)
9.1.3. North America Anhydrous Butter Revenue (USD Million) by Product (2021-2032)
By Type
Unsalted Butter
Salted Butter
By Application
Baking
Making Sauce
Fried Food
Others
Chapter 10. Europe Anhydrous Butter Analysis and Outlook
10.1. Europe Anhydrous Butter Revenue (USD Million), by Segments (USD Million) (2021-2032)
10.1.1. Europe Anhydrous Butter Revenue (USD Million) by Type (2021-2032)
10.1.2. Europe Anhydrous Butter Revenue (USD Million) by Application (2021-2032)
10.1.3. Europe Anhydrous Butter Revenue (USD Million) by Product (2021-2032)
By Type
Unsalted Butter
Salted Butter
By Application
Baking
Making Sauce
Fried Food
Others
Chapter 11. Asia Pacific Anhydrous Butter Analysis and Outlook
11.1. Asia Pacific Anhydrous Butter Revenue (USD Million), and Revenue (USD Million) by Segments (2021-2032)
11.1.1. Asia Pacific Anhydrous Butter Revenue (USD Million) by Type (2021-2032)
11.1.2. Asia Pacific Anhydrous Butter Revenue (USD Million) by Application (2021-2032)
11.1.3. Asia Pacific Anhydrous Butter Revenue (USD Million) by Product (2021-2032)
By Type
Unsalted Butter
Salted Butter
By Application
Baking
Making Sauce
Fried Food
Others
Chapter 12. South America Anhydrous Butter Analysis and Outlook
12.1. South America Anhydrous Butter Revenue (USD Million), by Segments (2021-2032)
12.1.1. South America Anhydrous Butter Revenue (USD Million) by Type (2021-2032)
12.1.2. South America Anhydrous Butter Revenue (USD Million) by Application (2021-2032)
12.1.3. South America Anhydrous Butter Revenue (USD Million) by Product (2021-2032)
By Type
Unsalted Butter
Salted Butter
By Application
Baking
Making Sauce
Fried Food
Others
Chapter 13. Middle East and Africa Anhydrous Butter Analysis and Outlook
13.1. Middle East and Africa Anhydrous Butter Revenue (USD Million), by Segments (2021-2032)
13.1.1. Middle East and Africa Anhydrous Butter Revenue (USD Million) by Type (2021-2032)
13.1.2. Middle East and Africa Anhydrous Butter Revenue (USD Million) by Application (2021-2032)
13.1.3. Middle East and Africa Anhydrous Butter Revenue (USD Million) by Product (2021-2032)
By Type
Unsalted Butter
Salted Butter
By Application
Baking
Making Sauce
Fried Food
Others
Chapter 14. Anhydrous Butter Company Profiles
14.1 Business Overview
14.2 Product Profiles
14.3 SWOT Profiles
14.5 Recent Developments
14.6 Financial Profile
List of Companies
Anchor
Aria Foods
Clover
Flora
Kerrygold
Lurpak
Utterly Butterly
Willow
Yorkshire Butter
15. Methodology and Data Sources
15.1 Customization Offerings
15.2 Subscription Services
15.3 Related Reports
15.4 Publisher Expertise
LIST OF TABLES
Table 1 Market Segmentation Analysis
Table 2 Global Anhydrous Butter Market Share of Leading Companies, 2023
Table 3 Product Offerings of Leading Companies
Table 4 Low Growth Scenario Forecasts
Table 5 Reference Case Growth Scenario
Table 6 High Growth Case Scenario
Table 7 Global Anhydrous Butter Revenue (USD Million) And CAGR (%) By Type (2021-2032)
Table 8 Global Anhydrous Butter Revenue (USD Million) And CAGR (%) By Application (2021-2032)
Table 9 Global Anhydrous Butter Revenue (USD Million) And CAGR (%) By Product (2021-2032)
Table 10 Global Anhydrous Butter Market Revenue (USD Million) By Regions (2021-2032)
Table 11 Global Anhydrous Butter Market Share (%) By Regions (2021-2032)
Table 12 North America Anhydrous Butter Revenue (USD Million) By Country (2021-2032)
Table 13 Europe Anhydrous Butter Revenue (USD Million) By Country (2021-2032)
Table 14 Asia Pacific Anhydrous Butter Revenue (USD Million) By Country (2021-2032)
Table 15 South America Anhydrous Butter Revenue (USD Million) By Country (2021-2032)
Table 16 Middle East and Africa Anhydrous Butter Revenue (USD Million) By Region (2021-2032)
Table 17 North America Anhydrous Butter Revenue (USD Million) By Type (2021-2032)
Table 18 North America Anhydrous Butter Revenue (USD Million) By Application (2021-2032)
Table 19 North America Anhydrous Butter Revenue (USD Million) By Product (2021-2032)
Table 20 Europe Anhydrous Butter Revenue (USD Million) By Type (2021-2032)
Table 21 Europe Anhydrous Butter Revenue (USD Million) By Application (2021-2032)
Table 22 Europe Anhydrous Butter Revenue (USD Million) By Product (2021-2032)
Table 23 Asia Pacific Anhydrous Butter Revenue (USD Million) By Type (2021-2032)
Table 24 Asia Pacific Anhydrous Butter Revenue (USD Million) By Application (2021-2032)
Table 25 Asia Pacific Anhydrous Butter Revenue (USD Million) By Product (2021-2032)
Table 26 South America Anhydrous Butter Revenue (USD Million) By Type (2021-2032)
Table 27 South America Anhydrous Butter Revenue (USD Million) By Application (2021-2032)
Table 28 South America Anhydrous Butter Revenue (USD Million) By Product (2021-2032)
Table 29 Middle East and Africa Anhydrous Butter Revenue (USD Million) By Type (2021-2032)
Table 30 Middle East and Africa Anhydrous Butter Revenue (USD Million) By Application (2021-2032)
Table 31 Middle East and Africa Anhydrous Butter Revenue (USD Million) By Product (2021-2032)
LIST OF FIGURES
Figure 1. Market Scope
Figure 2. Pricing Forecasts Per Unit, 2023- 2032
Figure 3. Porter’s Five Forces
Figure 4. Global Anhydrous Butter Market Revenue (USD Million) By Regions (2021-2032)
Figure 5. Global Anhydrous Butter Market Share (%) By Regions (2023)
Figure 6. North America Anhydrous Butter Revenue (USD Million) By Country (2021-2032)
Figure 7. United States Anhydrous Butter Revenue (USD Million) By Country (2021-2032)
Figure 8. Canada Anhydrous Butter Revenue (USD Million) By Country (2021-2032)
Figure 9. Mexico Anhydrous Butter Revenue (USD Million) By Country (2021-2032)
Figure 10. Europe Anhydrous Butter Revenue (USD Million) By Country (2021-2032)
Figure 11. Germany Anhydrous Butter Revenue (USD Million) By Country (2021-2032)
Figure 12. France Anhydrous Butter Revenue (USD Million) By Country (2021-2032)
Figure 13. United Kingdom Anhydrous Butter Revenue (USD Million) By Country (2021-2032)
Figure 14. Spain Anhydrous Butter Revenue (USD Million) By Country (2021-2032)
Figure 15. Italy Anhydrous Butter Revenue (USD Million) By Country (2021-2032)
Figure 16. Russia Anhydrous Butter Revenue (USD Million) By Country (2021-2032)
Figure 17. Rest of Europe Anhydrous Butter Revenue (USD Million) By Country (2021-2032)
Figure 11. Asia Pacific Anhydrous Butter Revenue (USD Million) By Country (2021-2032)
Figure 12. China Anhydrous Butter Revenue (USD Million) By Country (2021-2032)
Figure 13. Japan Anhydrous Butter Revenue (USD Million) By Country (2021-2032)
Figure 14. India Anhydrous Butter Revenue (USD Million) By Country (2021-2032)
Figure 15. South Korea Anhydrous Butter Revenue (USD Million) By Country (2021-2032)
Figure 16. Australia Anhydrous Butter Revenue (USD Million) By Country (2021-2032)
Figure 17. South East Asia Anhydrous Butter Revenue (USD Million) By Country (2021-2032)
Figure 18. South America Anhydrous Butter Revenue (USD Million) By Country (2021-2032)
Figure 19. Brazil Anhydrous Butter Revenue (USD Million) By Country (2021-2032)
Figure 20. Argentina Anhydrous Butter Revenue (USD Million) By Country (2021-2032)
Figure 21. Rest of Asia Pacific Anhydrous Butter Revenue (USD Million) By Country (2021-2032)
Figure 22. Middle East and Africa Anhydrous Butter Revenue (USD Million) By Region (2021-2032)
Figure 23. Saudi Arabia Anhydrous Butter Revenue (USD Million) By Region (2021-2032)
Figure 24. The UAE Anhydrous Butter Revenue (USD Million) By Region (2021-2032)
Figure 25. Rest of Middle East Anhydrous Butter Revenue (USD Million) By Region (2021-2032)
Figure 26. South Africa Anhydrous Butter Revenue (USD Million) By Region (2021-2032)
Figure 27. Africa Anhydrous Butter Revenue (USD Million) By Region (2021-2032)
Figure 28. North America Anhydrous Butter Revenue (USD Million) By Type (2021-2032)
Figure 29. North America Anhydrous Butter Revenue (USD Million) By Application (2021-2032)
Figure 30. North America Anhydrous Butter Revenue (USD Million) By Product (2021-2032)
Figure 31. Europe Anhydrous Butter Revenue (USD Million) By Type (2021-2032)
Figure 32. Europe Anhydrous Butter Revenue (USD Million) By Application (2021-2032)
Figure 33. Europe Anhydrous Butter Revenue (USD Million) By Product (2021-2032)
Figure 34. Asia Pacific Anhydrous Butter Revenue (USD Million) By Type (2021-2032)
Figure 35. Asia Pacific Anhydrous Butter Revenue (USD Million) By Application (2021-2032)
Figure 36. Asia Pacific Anhydrous Butter Revenue (USD Million) By Product (2021-2032)
Figure 37. South America Anhydrous Butter Revenue (USD Million) By Type (2021-2032)
Figure 38. South America Anhydrous Butter Revenue (USD Million) By Application (2021-2032)
Figure 39. South America Anhydrous Butter Revenue (USD Million) By Product (2021-2032)
Figure 40. Middle East and Africa Anhydrous Butter Revenue (USD Million) By Type (2021-2032)
Figure 41. Middle East and Africa Anhydrous Butter Revenue (USD Million) By Application (2021-2032)
Figure 42. Middle East and Africa Anhydrous Butter Revenue (USD Million) By Product (2021-2032)
By Type
Unsalted Butter
Salted Butter
By Application
Baking
Making Sauce
Fried Food
Others
Countries Analyzed
North America (US, Canada, Mexico)
Europe (Germany, UK, France, Spain, Italy, Russia, Rest of Europe)
Asia Pacific (China, India, Japan, South Korea, Australia, South East Asia, Rest of Asia)
South America (Brazil, Argentina, Rest of South America)
Middle East and Africa (Saudi Arabia, UAE, Rest of Middle East, South Africa, Egypt, Rest of Africa)
