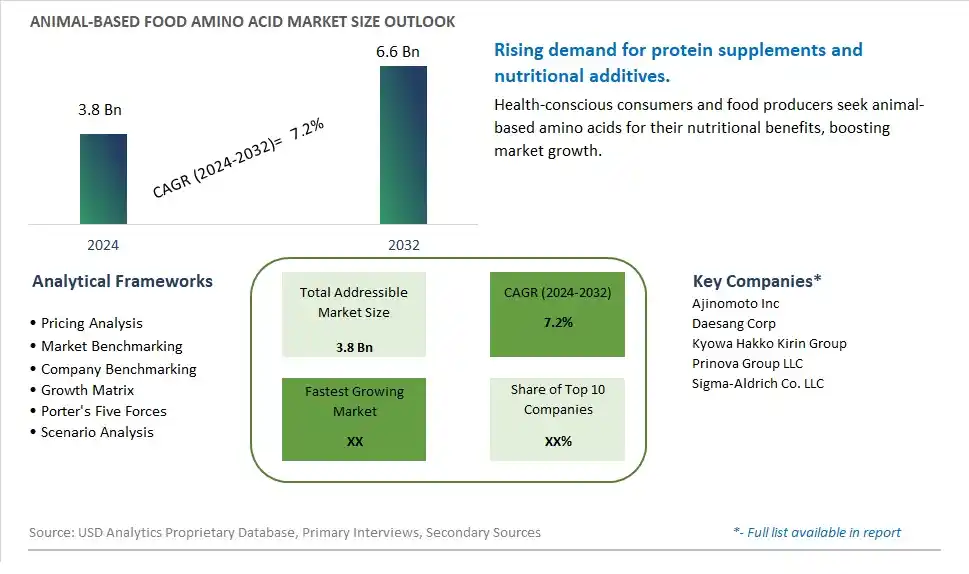
Global Animal-based Food Amino Acid Market Size is valued at $3.8 Billion in 2024 and is forecast to register a growth rate (CAGR) of 7.2% to reach $6.6 Billion by 2032.
The global Animal-based Food Amino Acid Market Comprehensive Study analyzes and forecasts the market size across 6 regions and 24 countries for diverse segments -By Type (Glutamic acid, Lysine, Tryptophan, Methionine, Phenylalanine, Others), By Application (Nutraceuticals, Infant formula, Food fortification, Convenience foods, Others)
An Introduction to Animal-based Food Amino Acid Market
The Animal-Based Food Amino Acid Market involves the production and sale of amino acids derived from animal sources, which are used as nutritional supplements and food additives. These amino acids are essential for various bodily functions, including muscle growth, metabolism, and immune support. The market is driven by increasing demand for high-quality protein supplements, rising awareness about the benefits of amino acids, and growing applications in the food and beverage industry. Additionally, advancements in extraction and purification technologies support market growth.
Animal based Food Amino Acid Competitive Landscape
The market report analyses the leading companies in the industry including Ajinomoto Inc, Daesang Corp, Kyowa Hakko Kirin Group, Prinova Group LLC, Sigma-Aldrich Co. LLC, and Others.
Animal based Food Amino Acid Market Dynamics
Market Trend: Rising Focus on Animal Nutrition and Health
The animal-based food amino acid market is experiencing a significant trend towards an increased focus on animal nutrition and health. With growing awareness of the benefits of amino acids in improving livestock productivity, enhancing feed efficiency, and promoting overall animal health, the demand for these essential nutrients is on the rise. Producers are increasingly formulating feeds with precise amino acid profiles to meet the specific dietary needs of different animal species. This trend is driven by the need to optimize growth rates, improve meat quality, and ensure sustainable livestock farming practices. The adoption of advanced feed formulations incorporating animal-based amino acids is expected to continue growing, driven by innovations in animal nutrition and a focus on sustainable farming practices.
Market Driver: Increasing Meat and Dairy Consumption
A major driver for the animal-based food amino acid market is the increasing global consumption of meat and dairy products. As populations grow and incomes rise, especially in emerging economies, the demand for high-quality animal protein is surging. This has led to an expansion in livestock production, necessitating the use of high-quality feeds that are rich in essential amino acids to ensure optimal animal growth and health. The livestock industry relies heavily on amino acids to enhance feed efficiency and improve the nutritional profile of meat and dairy products. Additionally, the rising consumer preference for protein-rich diets and the trend towards more sustainable and efficient livestock production are further driving the demand for animal-based food amino acids.
Market Opportunity: Technological Advancements in Amino Acid Production
Technological advancements in the production of animal-based food amino acids present a significant opportunity for market growth. Innovations in fermentation technology, genetic engineering, and extraction processes are making it more efficient and cost-effective to produce high-quality amino acids. These advancements are enabling manufacturers to scale up production, reduce costs, and improve the purity and bioavailability of amino acids in animal feed. Additionally, the development of customized amino acid blends tailored to specific livestock needs offers significant potential for market expansion. By leveraging these technological advancements, producers can meet the growing demand for high-performance animal feeds, enhance livestock productivity, and contribute to more sustainable and efficient food production systems.
Animal-based Food Amino Acid Market Share Analysis- Largest Segment by Type
The Glutamic Acid segment is the largest in the Animal-based Food Amino Acid Market by type. This dominance is due to glutamic acid's widespread use as a flavor enhancer, particularly in the form of monosodium glutamate (MSG), in the food industry. It is a crucial amino acid in animal feed as well, enhancing palatability and intake, thereby improving growth rates and feed efficiency in livestock. The extensive application of glutamic acid in both human food and animal nutrition markets contributes to its significant market share. Furthermore, the ongoing demand for processed and convenience foods, which often rely on flavor enhancers to improve taste, ensures a steady demand for glutamic acid. Its versatility and effectiveness in enhancing flavors make it a cornerstone in the food additives industry, sustaining its position as the largest segment within the animal-based food amino acid market.
Animal-based Food Amino Acid Market Share Analysis- Fastest Growing Segment by Application
The Nutraceuticals segment is poised to grow the fastest in the Animal-based Food Amino Acid Market by application over the next five years. This growth is driven by the increasing consumer awareness of health and wellness, leading to a surge in demand for dietary supplements and functional foods enriched with amino acids. Nutraceuticals, which include supplements and fortified foods, are sought after for their health benefits, such as improved muscle growth, enhanced cognitive function, and overall wellness. The rise in aging populations and lifestyle-related health issues further fuels the demand for nutraceuticals, as consumers look for ways to maintain health and prevent diseases. Additionally, the continuous innovation in nutraceutical products, including personalized nutrition and targeted health benefits, drives the market forward. The expanding distribution channels, including e-commerce, also make these products more accessible to a broader audience, supporting the rapid growth of the nutraceuticals segment.
Animal based Food Amino Acid Market Segmentation
By Type
Glutamic acid
Lysine
Tryptophan
Methionine
Phenylalanine
Others
By Application
Nutraceuticals
Infant formula
Food fortification
Convenience foods
Others
Countries Analyzed
North America (US, Canada, Mexico)
Europe (Germany, UK, France, Spain, Italy, Russia, Rest of Europe)
Asia Pacific (China, India, Japan, South Korea, Australia, South East Asia, Rest of Asia)
South America (Brazil, Argentina, Rest of South America)
Middle East and Africa (Saudi Arabia, UAE, Rest of Middle East, South Africa, Egypt, Rest of Africa)
Animal based Food Amino Acid Companies Profiled in the Study
Ajinomoto Inc
Daesang Corp
Kyowa Hakko Kirin Group
Prinova Group LLC
Sigma-Aldrich Co. LLC
*- List Not Exhaustive
Chapter 1. TABLE OF CONTENTS
Chapter 2. Introduction to Animal based Food Amino Acid Market
2.1. Market Overview
2.2. Key Statistics and Report Highlights
2.3. Scope of the Comprehensive Study
2.3.1. Market Definition
2.3.2 Countries and Regions Covered
2.3.3 Research Objective
2.3.4 Units, Currency, and Conversions
2.3.5 Industry Value Chain
2.4. Key Market Segments
2.5. Key Companies
2.6. Study Period
Chapter 3. Strategic Analysis Review
3.1. Animal based Food Amino Acid Pricing Analysis and Forecast
3.2. Porter’s Five Forces
3.3. Market Ecosystem
3.4. SWOT Analysis
3.5. Regulatory Scenario
3.3. Effects of Inflation, Russia-Ukraine War, moderating economic growth, and other macroeconomic factors
Chapter 4. Competitive Landscape
4.1. Market Share Analysis
4.1.1. Global Animal based Food Amino Acid Market Share by Company, 2023
4.1.2. Product Offerings of Leading Animal based Food Amino Acid Companies
4.2. Market Entropy
4.2.1. New Product Launches in the Industry
4.2.2. Mergers, Acquisitions, Joint ventures, and Partnerships
4.3. Key Strategies and Best Practices
Chapter 5. Global Market Projections: Best, Reference, and Low Case Scenarios
5.1. Growth Analysis- Case Scenario Definitions
5.2. Low Growth Case Scenario Forecasts
5.3. Reference Growth Case Scenario Forecasts
5.4. High Growth Case Scenario Forecasts
Chapter 6. Market Dynamics
6.1. Animal based Food Amino Acid Market Drivers
6.2. Animal based Food Amino Acid Market Challenges
6.6. Animal based Food Amino Acid Market Opportunities
6.4. Animal based Food Amino Acid Market Trends
Chapter 7. Global Animal based Food Amino Acid Market Outlook Trends
7.1. Global Animal based Food Amino Acid Revenue (USD Million) and CAGR (%) by Type (2021-2032)
7.2. Global Animal based Food Amino Acid Revenue (USD Million) and CAGR (%) by Application (2021-2032)
7.3. Global Animal based Food Amino Acid Revenue (USD Million) and CAGR (%) by Product (2021-2032)
By Type
Glutamic acid
Lysine
Tryptophan
Methionine
Phenylalanine
Others
By Application
Nutraceuticals
Infant formula
Food fortification
Convenience foods
Others
Chapter 8. Global Animal based Food Amino Acid Regional Analysis and Outlook
8.1. Global Animal based Food Amino Acid Revenue (USD Million) By Regions (2021- 2032)
8.2. North America Animal based Food Amino Acid Revenue (USD Million) by Country (2021-2032)
8.2.1. United States Animal based Food Amino Acid Regional Analysis and Outlook
8.2.2. Canada Animal based Food Amino Acid Regional Analysis and Outlook
8.2.3. Mexico Animal based Food Amino Acid Regional Analysis and Outlook
8.3. Europe Animal based Food Amino Acid Revenue (USD Million), by Country (2021-2032)
8.3.1. Germany Animal based Food Amino Acid Regional Analysis and Outlook
8.3.2. France Animal based Food Amino Acid Regional Analysis and Outlook
8.3.3. United Kingdom Animal based Food Amino Acid Regional Analysis and Outlook
8.3.4. Spain Animal based Food Amino Acid Regional Analysis and Outlook
8.3.5. Italy Animal based Food Amino Acid Regional Analysis and Outlook
8.3.6. Russia Animal based Food Amino Acid Regional Analysis and Outlook
8.3.7. Rest of Europe Animal based Food Amino Acid Regional Analysis and Outlook
8.4. Asia Pacific Animal based Food Amino Acid Revenue (USD Million) by Country (2021-2032)
8.4.1. China Animal based Food Amino Acid Regional Analysis and Outlook
8.4.2. Japan Animal based Food Amino Acid Regional Analysis and Outlook
8.4.3. India Animal based Food Amino Acid Regional Analysis and Outlook
8.4.4. South Korea Animal based Food Amino Acid Regional Analysis and Outlook
8.4.5. Australia Animal based Food Amino Acid Regional Analysis and Outlook
8.4.6. South East Asia Animal based Food Amino Acid Regional Analysis and Outlook
8.4.7. Rest of Asia Pacific Animal based Food Amino Acid Regional Analysis and Outlook
8.5. South America Animal based Food Amino Acid Revenue (USD Million), by Country (2021-2032)
8.5.1. Brazil Animal based Food Amino Acid Regional Analysis and Outlook
8.5.2. Argentina Animal based Food Amino Acid Regional Analysis and Outlook
8.5.3. Rest of South America Animal based Food Amino Acid Regional Analysis and Outlook
8.6. Middle East and Africa Animal based Food Amino Acid Revenue (USD Million) by Country (2021-2032)
8.6.1. Middle East Animal based Food Amino Acid Regional Analysis and Outlook
8.6.2. Africa Animal based Food Amino Acid Regional Analysis and Outlook
Chapter 9. North America Animal based Food Amino Acid Analysis and Outlook
9.1. North America Animal based Food Amino Acid Revenue (USD Million) by Segments (2021-2032)
9.1.1. North America Animal based Food Amino Acid Revenue (USD Million) by Type (2021-2032)
9.1.2. North America Animal based Food Amino Acid Revenue (USD Million) by Application (2021-2032)
9.1.3. North America Animal based Food Amino Acid Revenue (USD Million) by Product (2021-2032)
By Type
Glutamic acid
Lysine
Tryptophan
Methionine
Phenylalanine
Others
By Application
Nutraceuticals
Infant formula
Food fortification
Convenience foods
Others
Chapter 10. Europe Animal based Food Amino Acid Analysis and Outlook
10.1. Europe Animal based Food Amino Acid Revenue (USD Million), by Segments (USD Million) (2021-2032)
10.1.1. Europe Animal based Food Amino Acid Revenue (USD Million) by Type (2021-2032)
10.1.2. Europe Animal based Food Amino Acid Revenue (USD Million) by Application (2021-2032)
10.1.3. Europe Animal based Food Amino Acid Revenue (USD Million) by Product (2021-2032)
By Type
Glutamic acid
Lysine
Tryptophan
Methionine
Phenylalanine
Others
By Application
Nutraceuticals
Infant formula
Food fortification
Convenience foods
Others
Chapter 11. Asia Pacific Animal based Food Amino Acid Analysis and Outlook
11.1. Asia Pacific Animal based Food Amino Acid Revenue (USD Million), and Revenue (USD Million) by Segments (2021-2032)
11.1.1. Asia Pacific Animal based Food Amino Acid Revenue (USD Million) by Type (2021-2032)
11.1.2. Asia Pacific Animal based Food Amino Acid Revenue (USD Million) by Application (2021-2032)
11.1.3. Asia Pacific Animal based Food Amino Acid Revenue (USD Million) by Product (2021-2032)
By Type
Glutamic acid
Lysine
Tryptophan
Methionine
Phenylalanine
Others
By Application
Nutraceuticals
Infant formula
Food fortification
Convenience foods
Others
Chapter 12. South America Animal based Food Amino Acid Analysis and Outlook
12.1. South America Animal based Food Amino Acid Revenue (USD Million), by Segments (2021-2032)
12.1.1. South America Animal based Food Amino Acid Revenue (USD Million) by Type (2021-2032)
12.1.2. South America Animal based Food Amino Acid Revenue (USD Million) by Application (2021-2032)
12.1.3. South America Animal based Food Amino Acid Revenue (USD Million) by Product (2021-2032)
By Type
Glutamic acid
Lysine
Tryptophan
Methionine
Phenylalanine
Others
By Application
Nutraceuticals
Infant formula
Food fortification
Convenience foods
Others
Chapter 13. Middle East and Africa Animal based Food Amino Acid Analysis and Outlook
13.1. Middle East and Africa Animal based Food Amino Acid Revenue (USD Million), by Segments (2021-2032)
13.1.1. Middle East and Africa Animal based Food Amino Acid Revenue (USD Million) by Type (2021-2032)
13.1.2. Middle East and Africa Animal based Food Amino Acid Revenue (USD Million) by Application (2021-2032)
13.1.3. Middle East and Africa Animal based Food Amino Acid Revenue (USD Million) by Product (2021-2032)
By Type
Glutamic acid
Lysine
Tryptophan
Methionine
Phenylalanine
Others
By Application
Nutraceuticals
Infant formula
Food fortification
Convenience foods
Others
Chapter 14. Animal based Food Amino Acid Company Profiles
14.1 Business Overview
14.2 Product Profiles
14.3 SWOT Profiles
14.5 Recent Developments
14.6 Financial Profile
List of Companies
Ajinomoto Inc
Daesang Corp
Kyowa Hakko Kirin Group
Prinova Group LLC
Sigma-Aldrich Co. LLC
15. Methodology and Data Sources
15.1 Customization Offerings
15.2 Subscription Services
15.3 Related Reports
15.4 Publisher Expertise
LIST OF TABLES
Table 1 Market Segmentation Analysis
Table 2 Global Animal based Food Amino Acid Market Share of Leading Companies, 2023
Table 3 Product Offerings of Leading Companies
Table 4 Low Growth Scenario Forecasts
Table 5 Reference Case Growth Scenario
Table 6 High Growth Case Scenario
Table 7 Global Animal based Food Amino Acid Revenue (USD Million) And CAGR (%) By Type (2021-2032)
Table 8 Global Animal based Food Amino Acid Revenue (USD Million) And CAGR (%) By Application (2021-2032)
Table 9 Global Animal based Food Amino Acid Revenue (USD Million) And CAGR (%) By Product (2021-2032)
Table 10 Global Animal based Food Amino Acid Market Revenue (USD Million) By Regions (2021-2032)
Table 11 Global Animal based Food Amino Acid Market Share (%) By Regions (2021-2032)
Table 12 North America Animal based Food Amino Acid Revenue (USD Million) By Country (2021-2032)
Table 13 Europe Animal based Food Amino Acid Revenue (USD Million) By Country (2021-2032)
Table 14 Asia Pacific Animal based Food Amino Acid Revenue (USD Million) By Country (2021-2032)
Table 15 South America Animal based Food Amino Acid Revenue (USD Million) By Country (2021-2032)
Table 16 Middle East and Africa Animal based Food Amino Acid Revenue (USD Million) By Region (2021-2032)
Table 17 North America Animal based Food Amino Acid Revenue (USD Million) By Type (2021-2032)
Table 18 North America Animal based Food Amino Acid Revenue (USD Million) By Application (2021-2032)
Table 19 North America Animal based Food Amino Acid Revenue (USD Million) By Product (2021-2032)
Table 20 Europe Animal based Food Amino Acid Revenue (USD Million) By Type (2021-2032)
Table 21 Europe Animal based Food Amino Acid Revenue (USD Million) By Application (2021-2032)
Table 22 Europe Animal based Food Amino Acid Revenue (USD Million) By Product (2021-2032)
Table 23 Asia Pacific Animal based Food Amino Acid Revenue (USD Million) By Type (2021-2032)
Table 24 Asia Pacific Animal based Food Amino Acid Revenue (USD Million) By Application (2021-2032)
Table 25 Asia Pacific Animal based Food Amino Acid Revenue (USD Million) By Product (2021-2032)
Table 26 South America Animal based Food Amino Acid Revenue (USD Million) By Type (2021-2032)
Table 27 South America Animal based Food Amino Acid Revenue (USD Million) By Application (2021-2032)
Table 28 South America Animal based Food Amino Acid Revenue (USD Million) By Product (2021-2032)
Table 29 Middle East and Africa Animal based Food Amino Acid Revenue (USD Million) By Type (2021-2032)
Table 30 Middle East and Africa Animal based Food Amino Acid Revenue (USD Million) By Application (2021-2032)
Table 31 Middle East and Africa Animal based Food Amino Acid Revenue (USD Million) By Product (2021-2032)
LIST OF FIGURES
Figure 1. Market Scope
Figure 2. Pricing Forecasts Per Unit, 2023- 2032
Figure 3. Porter’s Five Forces
Figure 4. Global Animal based Food Amino Acid Market Revenue (USD Million) By Regions (2021-2032)
Figure 5. Global Animal based Food Amino Acid Market Share (%) By Regions (2023)
Figure 6. North America Animal based Food Amino Acid Revenue (USD Million) By Country (2021-2032)
Figure 7. United States Animal based Food Amino Acid Revenue (USD Million) By Country (2021-2032)
Figure 8. Canada Animal based Food Amino Acid Revenue (USD Million) By Country (2021-2032)
Figure 9. Mexico Animal based Food Amino Acid Revenue (USD Million) By Country (2021-2032)
Figure 10. Europe Animal based Food Amino Acid Revenue (USD Million) By Country (2021-2032)
Figure 11. Germany Animal based Food Amino Acid Revenue (USD Million) By Country (2021-2032)
Figure 12. France Animal based Food Amino Acid Revenue (USD Million) By Country (2021-2032)
Figure 13. United Kingdom Animal based Food Amino Acid Revenue (USD Million) By Country (2021-2032)
Figure 14. Spain Animal based Food Amino Acid Revenue (USD Million) By Country (2021-2032)
Figure 15. Italy Animal based Food Amino Acid Revenue (USD Million) By Country (2021-2032)
Figure 16. Russia Animal based Food Amino Acid Revenue (USD Million) By Country (2021-2032)
Figure 17. Rest of Europe Animal based Food Amino Acid Revenue (USD Million) By Country (2021-2032)
Figure 11. Asia Pacific Animal based Food Amino Acid Revenue (USD Million) By Country (2021-2032)
Figure 12. China Animal based Food Amino Acid Revenue (USD Million) By Country (2021-2032)
Figure 13. Japan Animal based Food Amino Acid Revenue (USD Million) By Country (2021-2032)
Figure 14. India Animal based Food Amino Acid Revenue (USD Million) By Country (2021-2032)
Figure 15. South Korea Animal based Food Amino Acid Revenue (USD Million) By Country (2021-2032)
Figure 16. Australia Animal based Food Amino Acid Revenue (USD Million) By Country (2021-2032)
Figure 17. South East Asia Animal based Food Amino Acid Revenue (USD Million) By Country (2021-2032)
Figure 18. South America Animal based Food Amino Acid Revenue (USD Million) By Country (2021-2032)
Figure 19. Brazil Animal based Food Amino Acid Revenue (USD Million) By Country (2021-2032)
Figure 20. Argentina Animal based Food Amino Acid Revenue (USD Million) By Country (2021-2032)
Figure 21. Rest of Asia Pacific Animal based Food Amino Acid Revenue (USD Million) By Country (2021-2032)
Figure 22. Middle East and Africa Animal based Food Amino Acid Revenue (USD Million) By Region (2021-2032)
Figure 23. Saudi Arabia Animal based Food Amino Acid Revenue (USD Million) By Region (2021-2032)
Figure 24. The UAE Animal based Food Amino Acid Revenue (USD Million) By Region (2021-2032)
Figure 25. Rest of Middle East Animal based Food Amino Acid Revenue (USD Million) By Region (2021-2032)
Figure 26. South Africa Animal based Food Amino Acid Revenue (USD Million) By Region (2021-2032)
Figure 27. Africa Animal based Food Amino Acid Revenue (USD Million) By Region (2021-2032)
Figure 28. North America Animal based Food Amino Acid Revenue (USD Million) By Type (2021-2032)
Figure 29. North America Animal based Food Amino Acid Revenue (USD Million) By Application (2021-2032)
Figure 30. North America Animal based Food Amino Acid Revenue (USD Million) By Product (2021-2032)
Figure 31. Europe Animal based Food Amino Acid Revenue (USD Million) By Type (2021-2032)
Figure 32. Europe Animal based Food Amino Acid Revenue (USD Million) By Application (2021-2032)
Figure 33. Europe Animal based Food Amino Acid Revenue (USD Million) By Product (2021-2032)
Figure 34. Asia Pacific Animal based Food Amino Acid Revenue (USD Million) By Type (2021-2032)
Figure 35. Asia Pacific Animal based Food Amino Acid Revenue (USD Million) By Application (2021-2032)
Figure 36. Asia Pacific Animal based Food Amino Acid Revenue (USD Million) By Product (2021-2032)
Figure 37. South America Animal based Food Amino Acid Revenue (USD Million) By Type (2021-2032)
Figure 38. South America Animal based Food Amino Acid Revenue (USD Million) By Application (2021-2032)
Figure 39. South America Animal based Food Amino Acid Revenue (USD Million) By Product (2021-2032)
Figure 40. Middle East and Africa Animal based Food Amino Acid Revenue (USD Million) By Type (2021-2032)
Figure 41. Middle East and Africa Animal based Food Amino Acid Revenue (USD Million) By Application (2021-2032)
Figure 42. Middle East and Africa Animal based Food Amino Acid Revenue (USD Million) By Product (2021-2032)
By Type
Glutamic acid
Lysine
Tryptophan
Methionine
Phenylalanine
Others
By Application
Nutraceuticals
Infant formula
Food fortification
Convenience foods
Others
Countries Analyzed
North America (US, Canada, Mexico)
Europe (Germany, UK, France, Spain, Italy, Russia, Rest of Europe)
Asia Pacific (China, India, Japan, South Korea, Australia, South East Asia, Rest of Asia)
South America (Brazil, Argentina, Rest of South America)
Middle East and Africa (Saudi Arabia, UAE, Rest of Middle East, South Africa, Egypt, Rest of Africa)
