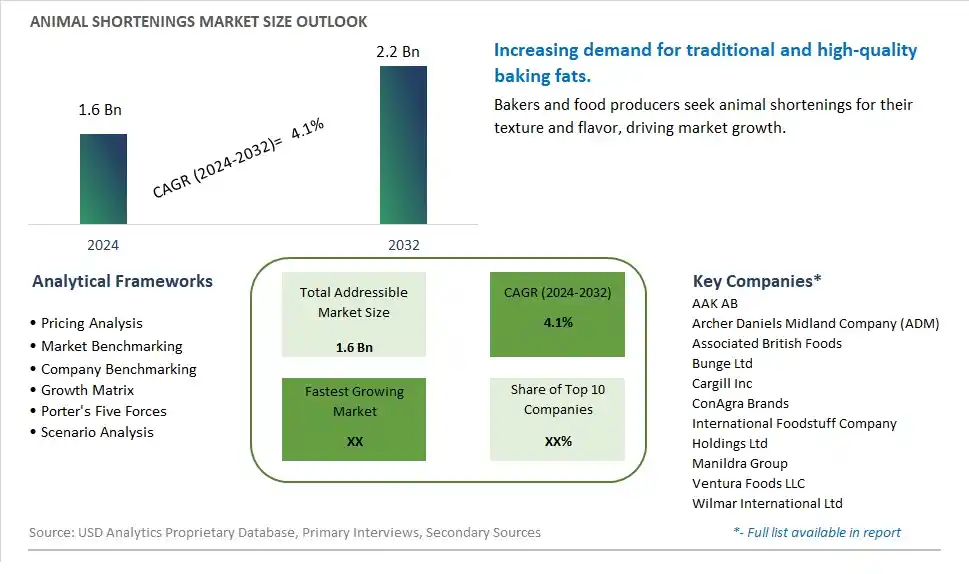
Global Animal Shortenings Market Size is valued at $1.6 Billion in 2024 and is forecast to register a growth rate (CAGR) of 4.1% to reach $2.2 Billion by 2032.
The global Animal Shortenings Market Comprehensive Study analyzes and forecasts the market size across 6 regions and 24 countries for diverse segments -By Type (Solid, Liquid, Cake/Icing, All-purpose, Others), By Application (Bakery products, Confectionery products, Snacks & savory products, Others)
An Introduction to Animal Shortenings Market
The Animal Shortenings market in 2024 is expanding steadily, driven by its crucial role in the bakery and confectionery industries. Animal shortenings, derived from rendered animal fats, are valued for their ability to enhance the texture, flavor, and shelf life of baked goods. The market is supported by the increasing demand for high-quality and traditional baking ingredients. Advances in rendering and processing technologies are improving the quality and consistency of animal shortenings. The market is also benefiting from the rising trend towards artisanal and homemade baked goods, where traditional ingredients are highly sought after for their authentic taste and performance.
Animal Shortenings Competitive Landscape
The market report analyses the leading companies in the industry including AAK AB, Archer Daniels Midland Company (ADM), Associated British Foods, Bunge Ltd, Cargill Inc, ConAgra Brands, International Foodstuff Company Holdings Ltd, Manildra Group, Ventura Foods LLC, Wilmar International Ltd, and Others.
Animal Shortenings Market Dynamics
Animal Shortenings Market Trend: Shift Towards Natural and Clean-Label Ingredients
The animal shortenings market is experiencing a significant trend towards the shift towards natural and clean-label ingredients. Consumers are increasingly demanding transparency and simplicity in the products they consume, leading to a preference for animal shortenings over synthetic or highly processed alternatives. This trend is driven by a growing awareness of the health benefits associated with natural fats and the desire to avoid artificial additives and trans fats. As a result, food manufacturers are reformulating their products to include animal shortenings, which are perceived as more wholesome and natural, aligning with the clean-label movement that emphasizes fewer, recognizable ingredients.
Animal Shortenings Market Driver: Increasing Demand for Baked Goods and Confectioneries
A major driver for the animal shortenings market is the increasing demand for baked goods and confectioneries. As consumer preferences shift towards indulgent and comfort foods, the bakery and confectionery sectors are witnessing significant growth. Animal shortenings, known for their superior functionality in providing desirable textures, flavors, and shelf-life stability, are essential ingredients in these products. The rising consumption of pastries, cakes, cookies, and other baked items, coupled with the growth of artisanal and gourmet baking trends, is driving the demand for high-quality shortenings derived from animal fats. This driver is further reinforced by the expanding foodservice industry and the popularity of home baking.
Animal Shortenings Market Opportunity: Innovation in Specialty and Health-Oriented Shortenings
Innovation in specialty and health-oriented shortenings presents a substantial opportunity for the animal shortenings market. There is a growing market for specialty shortenings that cater to specific dietary needs and preferences, such as low-sodium, low-cholesterol, and keto-friendly options. Additionally, there is potential for developing shortenings enriched with functional ingredients like omega-3 fatty acids or fortified with vitamins and minerals. By focusing on these innovative and health-oriented product developments, manufacturers can meet the evolving demands of health-conscious consumers and differentiate their offerings in a competitive market. This approach not only broadens the consumer base but also opens up new revenue streams in the premium and health food segments.
Animal Shortenings Market Share Analysis: Solid Shortenings segment generated the highest revenue share in the industry
The Solid Shortenings segment emerges as the largest in the Animal Shortenings Market, showcasing substantial growth and widespread usage. Solid shortenings, made from animal fats or vegetable oils, are a key ingredient in various food products, including baked goods, pastries, confections, and fried foods. This segment dominates the market due to several key factors. Firstly, solid shortenings offer versatility in culinary applications, providing structure, texture, and moisture retention properties to a wide range of food items. They are particularly popular in bakery and pastry production, where they contribute to the flakiness, tenderness, and shelf stability of baked goods. Additionally, solid shortenings have a higher melting point compared to liquid shortenings, making them suitable for frying and high-temperature cooking applications. The Solid Shortenings segment also benefits from its ability to enhance flavor delivery and mouthfeel in food products, meeting consumer preferences for indulgent and satisfying culinary experiences. With the growing demand for convenience foods, bakery products, and fried snacks, the Solid Shortenings segment is positioned to maintain its market leadership and drive significant growth in the Animal Shortenings Market.
Animal Shortenings Market Share Analysis: Bakery Products is the fastest growing segment over the forecast period to 2032
The Bakery Products segment within the Animal Shortenings Market is poised for rapid growth leading up to 2032. This segment's accelerated expansion is driven by several key factors. Firstly, there's a growing global demand for bakery products, including bread, pastries, cakes, and biscuits, driven by changing consumer lifestyles, urbanization, and the popularity of convenience foods. Animal shortenings, particularly solid shortenings, play a crucial role in bakery applications by providing texture, structure, and moisture retention properties to baked goods. Further, solid shortenings contribute to the desirable sensory attributes such as flakiness, tenderness, and mouthfeel in pastries and baked items, enhancing their overall quality and consumer appeal. The Bakery Products segment also benefits from innovations in bakery technology, product formulations, and ingredient functionality, allowing for the development of premium baked goods with extended shelf life and improved sensory characteristics. With the continuous evolution of bakery trends, flavor profiles, and product innovations, the Bakery Products segment is positioned to experience exponential growth and emerge as a dominant force within the Animal Shortenings Market by 2032.
Animal Shortenings Market Segmentation
By Type
Solid
Liquid
Cake/Icing
All-purpose
Others
By Application
Bakery products
Confectionery products
Snacks & savory products
Others
Countries Analyzed
North America (US, Canada, Mexico)
Europe (Germany, UK, France, Spain, Italy, Russia, Rest of Europe)
Asia Pacific (China, India, Japan, South Korea, Australia, South East Asia, Rest of Asia)
South America (Brazil, Argentina, Rest of South America)
Middle East and Africa (Saudi Arabia, UAE, Rest of Middle East, South Africa, Egypt, Rest of Africa)
Animal Shortenings Companies Profiled in the Study
AAK AB
Archer Daniels Midland Company (ADM)
Associated British Foods
Bunge Ltd
Cargill Inc
ConAgra Brands
International Foodstuff Company Holdings Ltd
Manildra Group
Ventura Foods LLC
Wilmar International Ltd
*- List Not Exhaustive
Chapter 1. TABLE OF CONTENTS
Chapter 2. Introduction to Animal Shortenings Market
2.1. Market Overview
2.2. Key Statistics and Report Highlights
2.3. Scope of the Comprehensive Study
2.3.1. Market Definition
2.3.2 Countries and Regions Covered
2.3.3 Research Objective
2.3.4 Units, Currency, and Conversions
2.3.5 Industry Value Chain
2.4. Key Market Segments
2.5. Key Companies
2.6. Study Period
Chapter 3. Strategic Analysis Review
3.1. Animal Shortenings Pricing Analysis and Forecast
3.2. Porter’s Five Forces
3.3. Market Ecosystem
3.4. SWOT Analysis
3.5. Regulatory Scenario
3.3. Effects of Inflation, Russia-Ukraine War, moderating economic growth, and other macroeconomic factors
Chapter 4. Competitive Landscape
4.1. Market Share Analysis
4.1.1. Global Animal Shortenings Market Share by Company, 2023
4.1.2. Product Offerings of Leading Animal Shortenings Companies
4.2. Market Entropy
4.2.1. New Product Launches in the Industry
4.2.2. Mergers, Acquisitions, Joint ventures, and Partnerships
4.3. Key Strategies and Best Practices
Chapter 5. Global Market Projections: Best, Reference, and Low Case Scenarios
5.1. Growth Analysis- Case Scenario Definitions
5.2. Low Growth Case Scenario Forecasts
5.3. Reference Growth Case Scenario Forecasts
5.4. High Growth Case Scenario Forecasts
Chapter 6. Market Dynamics
6.1. Animal Shortenings Market Drivers
6.2. Animal Shortenings Market Challenges
6.6. Animal Shortenings Market Opportunities
6.4. Animal Shortenings Market Trends
Chapter 7. Global Animal Shortenings Market Outlook Trends
7.1. Global Animal Shortenings Revenue (USD Million) and CAGR (%) by Type (2021-2032)
7.2. Global Animal Shortenings Revenue (USD Million) and CAGR (%) by Application (2021-2032)
7.3. Global Animal Shortenings Revenue (USD Million) and CAGR (%) by Product (2021-2032)
By Type
Solid
Liquid
Cake/Icing
All-purpose
Others
By Application
Bakery products
Confectionery products
Snacks & savory products
Others
Chapter 8. Global Animal Shortenings Regional Analysis and Outlook
8.1. Global Animal Shortenings Revenue (USD Million) By Regions (2021- 2032)
8.2. North America Animal Shortenings Revenue (USD Million) by Country (2021-2032)
8.2.1. United States Animal Shortenings Regional Analysis and Outlook
8.2.2. Canada Animal Shortenings Regional Analysis and Outlook
8.2.3. Mexico Animal Shortenings Regional Analysis and Outlook
8.3. Europe Animal Shortenings Revenue (USD Million), by Country (2021-2032)
8.3.1. Germany Animal Shortenings Regional Analysis and Outlook
8.3.2. France Animal Shortenings Regional Analysis and Outlook
8.3.3. United Kingdom Animal Shortenings Regional Analysis and Outlook
8.3.4. Spain Animal Shortenings Regional Analysis and Outlook
8.3.5. Italy Animal Shortenings Regional Analysis and Outlook
8.3.6. Russia Animal Shortenings Regional Analysis and Outlook
8.3.7. Rest of Europe Animal Shortenings Regional Analysis and Outlook
8.4. Asia Pacific Animal Shortenings Revenue (USD Million) by Country (2021-2032)
8.4.1. China Animal Shortenings Regional Analysis and Outlook
8.4.2. Japan Animal Shortenings Regional Analysis and Outlook
8.4.3. India Animal Shortenings Regional Analysis and Outlook
8.4.4. South Korea Animal Shortenings Regional Analysis and Outlook
8.4.5. Australia Animal Shortenings Regional Analysis and Outlook
8.4.6. South East Asia Animal Shortenings Regional Analysis and Outlook
8.4.7. Rest of Asia Pacific Animal Shortenings Regional Analysis and Outlook
8.5. South America Animal Shortenings Revenue (USD Million), by Country (2021-2032)
8.5.1. Brazil Animal Shortenings Regional Analysis and Outlook
8.5.2. Argentina Animal Shortenings Regional Analysis and Outlook
8.5.3. Rest of South America Animal Shortenings Regional Analysis and Outlook
8.6. Middle East and Africa Animal Shortenings Revenue (USD Million) by Country (2021-2032)
8.6.1. Middle East Animal Shortenings Regional Analysis and Outlook
8.6.2. Africa Animal Shortenings Regional Analysis and Outlook
Chapter 9. North America Animal Shortenings Analysis and Outlook
9.1. North America Animal Shortenings Revenue (USD Million) by Segments (2021-2032)
9.1.1. North America Animal Shortenings Revenue (USD Million) by Type (2021-2032)
9.1.2. North America Animal Shortenings Revenue (USD Million) by Application (2021-2032)
9.1.3. North America Animal Shortenings Revenue (USD Million) by Product (2021-2032)
By Type
Solid
Liquid
Cake/Icing
All-purpose
Others
By Application
Bakery products
Confectionery products
Snacks & savory products
Others
Chapter 10. Europe Animal Shortenings Analysis and Outlook
10.1. Europe Animal Shortenings Revenue (USD Million), by Segments (USD Million) (2021-2032)
10.1.1. Europe Animal Shortenings Revenue (USD Million) by Type (2021-2032)
10.1.2. Europe Animal Shortenings Revenue (USD Million) by Application (2021-2032)
10.1.3. Europe Animal Shortenings Revenue (USD Million) by Product (2021-2032)
By Type
Solid
Liquid
Cake/Icing
All-purpose
Others
By Application
Bakery products
Confectionery products
Snacks & savory products
Others
Chapter 11. Asia Pacific Animal Shortenings Analysis and Outlook
11.1. Asia Pacific Animal Shortenings Revenue (USD Million), and Revenue (USD Million) by Segments (2021-2032)
11.1.1. Asia Pacific Animal Shortenings Revenue (USD Million) by Type (2021-2032)
11.1.2. Asia Pacific Animal Shortenings Revenue (USD Million) by Application (2021-2032)
11.1.3. Asia Pacific Animal Shortenings Revenue (USD Million) by Product (2021-2032)
By Type
Solid
Liquid
Cake/Icing
All-purpose
Others
By Application
Bakery products
Confectionery products
Snacks & savory products
Others
Chapter 12. South America Animal Shortenings Analysis and Outlook
12.1. South America Animal Shortenings Revenue (USD Million), by Segments (2021-2032)
12.1.1. South America Animal Shortenings Revenue (USD Million) by Type (2021-2032)
12.1.2. South America Animal Shortenings Revenue (USD Million) by Application (2021-2032)
12.1.3. South America Animal Shortenings Revenue (USD Million) by Product (2021-2032)
By Type
Solid
Liquid
Cake/Icing
All-purpose
Others
By Application
Bakery products
Confectionery products
Snacks & savory products
Others
Chapter 13. Middle East and Africa Animal Shortenings Analysis and Outlook
13.1. Middle East and Africa Animal Shortenings Revenue (USD Million), by Segments (2021-2032)
13.1.1. Middle East and Africa Animal Shortenings Revenue (USD Million) by Type (2021-2032)
13.1.2. Middle East and Africa Animal Shortenings Revenue (USD Million) by Application (2021-2032)
13.1.3. Middle East and Africa Animal Shortenings Revenue (USD Million) by Product (2021-2032)
By Type
Solid
Liquid
Cake/Icing
All-purpose
Others
By Application
Bakery products
Confectionery products
Snacks & savory products
Others
Chapter 14. Animal Shortenings Company Profiles
14.1 Business Overview
14.2 Product Profiles
14.3 SWOT Profiles
14.5 Recent Developments
14.6 Financial Profile
List of Companies
AAK AB
Archer Daniels Midland Company (ADM)
Associated British Foods
Bunge Ltd
Cargill Inc
ConAgra Brands
International Foodstuff Company Holdings Ltd
Manildra Group
Ventura Foods LLC
Wilmar International Ltd
15. Methodology and Data Sources
15.1 Customization Offerings
15.2 Subscription Services
15.3 Related Reports
15.4 Publisher Expertise
LIST OF TABLES
Table 1 Market Segmentation Analysis
Table 2 Global Animal Shortenings Market Share of Leading Companies, 2023
Table 3 Product Offerings of Leading Companies
Table 4 Low Growth Scenario Forecasts
Table 5 Reference Case Growth Scenario
Table 6 High Growth Case Scenario
Table 7 Global Animal Shortenings Revenue (USD Million) And CAGR (%) By Type (2021-2032)
Table 8 Global Animal Shortenings Revenue (USD Million) And CAGR (%) By Application (2021-2032)
Table 9 Global Animal Shortenings Revenue (USD Million) And CAGR (%) By Product (2021-2032)
Table 10 Global Animal Shortenings Market Revenue (USD Million) By Regions (2021-2032)
Table 11 Global Animal Shortenings Market Share (%) By Regions (2021-2032)
Table 12 North America Animal Shortenings Revenue (USD Million) By Country (2021-2032)
Table 13 Europe Animal Shortenings Revenue (USD Million) By Country (2021-2032)
Table 14 Asia Pacific Animal Shortenings Revenue (USD Million) By Country (2021-2032)
Table 15 South America Animal Shortenings Revenue (USD Million) By Country (2021-2032)
Table 16 Middle East and Africa Animal Shortenings Revenue (USD Million) By Region (2021-2032)
Table 17 North America Animal Shortenings Revenue (USD Million) By Type (2021-2032)
Table 18 North America Animal Shortenings Revenue (USD Million) By Application (2021-2032)
Table 19 North America Animal Shortenings Revenue (USD Million) By Product (2021-2032)
Table 20 Europe Animal Shortenings Revenue (USD Million) By Type (2021-2032)
Table 21 Europe Animal Shortenings Revenue (USD Million) By Application (2021-2032)
Table 22 Europe Animal Shortenings Revenue (USD Million) By Product (2021-2032)
Table 23 Asia Pacific Animal Shortenings Revenue (USD Million) By Type (2021-2032)
Table 24 Asia Pacific Animal Shortenings Revenue (USD Million) By Application (2021-2032)
Table 25 Asia Pacific Animal Shortenings Revenue (USD Million) By Product (2021-2032)
Table 26 South America Animal Shortenings Revenue (USD Million) By Type (2021-2032)
Table 27 South America Animal Shortenings Revenue (USD Million) By Application (2021-2032)
Table 28 South America Animal Shortenings Revenue (USD Million) By Product (2021-2032)
Table 29 Middle East and Africa Animal Shortenings Revenue (USD Million) By Type (2021-2032)
Table 30 Middle East and Africa Animal Shortenings Revenue (USD Million) By Application (2021-2032)
Table 31 Middle East and Africa Animal Shortenings Revenue (USD Million) By Product (2021-2032)
LIST OF FIGURES
Figure 1. Market Scope
Figure 2. Pricing Forecasts Per Unit, 2023- 2032
Figure 3. Porter’s Five Forces
Figure 4. Global Animal Shortenings Market Revenue (USD Million) By Regions (2021-2032)
Figure 5. Global Animal Shortenings Market Share (%) By Regions (2023)
Figure 6. North America Animal Shortenings Revenue (USD Million) By Country (2021-2032)
Figure 7. United States Animal Shortenings Revenue (USD Million) By Country (2021-2032)
Figure 8. Canada Animal Shortenings Revenue (USD Million) By Country (2021-2032)
Figure 9. Mexico Animal Shortenings Revenue (USD Million) By Country (2021-2032)
Figure 10. Europe Animal Shortenings Revenue (USD Million) By Country (2021-2032)
Figure 11. Germany Animal Shortenings Revenue (USD Million) By Country (2021-2032)
Figure 12. France Animal Shortenings Revenue (USD Million) By Country (2021-2032)
Figure 13. United Kingdom Animal Shortenings Revenue (USD Million) By Country (2021-2032)
Figure 14. Spain Animal Shortenings Revenue (USD Million) By Country (2021-2032)
Figure 15. Italy Animal Shortenings Revenue (USD Million) By Country (2021-2032)
Figure 16. Russia Animal Shortenings Revenue (USD Million) By Country (2021-2032)
Figure 17. Rest of Europe Animal Shortenings Revenue (USD Million) By Country (2021-2032)
Figure 11. Asia Pacific Animal Shortenings Revenue (USD Million) By Country (2021-2032)
Figure 12. China Animal Shortenings Revenue (USD Million) By Country (2021-2032)
Figure 13. Japan Animal Shortenings Revenue (USD Million) By Country (2021-2032)
Figure 14. India Animal Shortenings Revenue (USD Million) By Country (2021-2032)
Figure 15. South Korea Animal Shortenings Revenue (USD Million) By Country (2021-2032)
Figure 16. Australia Animal Shortenings Revenue (USD Million) By Country (2021-2032)
Figure 17. South East Asia Animal Shortenings Revenue (USD Million) By Country (2021-2032)
Figure 18. South America Animal Shortenings Revenue (USD Million) By Country (2021-2032)
Figure 19. Brazil Animal Shortenings Revenue (USD Million) By Country (2021-2032)
Figure 20. Argentina Animal Shortenings Revenue (USD Million) By Country (2021-2032)
Figure 21. Rest of Asia Pacific Animal Shortenings Revenue (USD Million) By Country (2021-2032)
Figure 22. Middle East and Africa Animal Shortenings Revenue (USD Million) By Region (2021-2032)
Figure 23. Saudi Arabia Animal Shortenings Revenue (USD Million) By Region (2021-2032)
Figure 24. The UAE Animal Shortenings Revenue (USD Million) By Region (2021-2032)
Figure 25. Rest of Middle East Animal Shortenings Revenue (USD Million) By Region (2021-2032)
Figure 26. South Africa Animal Shortenings Revenue (USD Million) By Region (2021-2032)
Figure 27. Africa Animal Shortenings Revenue (USD Million) By Region (2021-2032)
Figure 28. North America Animal Shortenings Revenue (USD Million) By Type (2021-2032)
Figure 29. North America Animal Shortenings Revenue (USD Million) By Application (2021-2032)
Figure 30. North America Animal Shortenings Revenue (USD Million) By Product (2021-2032)
Figure 31. Europe Animal Shortenings Revenue (USD Million) By Type (2021-2032)
Figure 32. Europe Animal Shortenings Revenue (USD Million) By Application (2021-2032)
Figure 33. Europe Animal Shortenings Revenue (USD Million) By Product (2021-2032)
Figure 34. Asia Pacific Animal Shortenings Revenue (USD Million) By Type (2021-2032)
Figure 35. Asia Pacific Animal Shortenings Revenue (USD Million) By Application (2021-2032)
Figure 36. Asia Pacific Animal Shortenings Revenue (USD Million) By Product (2021-2032)
Figure 37. South America Animal Shortenings Revenue (USD Million) By Type (2021-2032)
Figure 38. South America Animal Shortenings Revenue (USD Million) By Application (2021-2032)
Figure 39. South America Animal Shortenings Revenue (USD Million) By Product (2021-2032)
Figure 40. Middle East and Africa Animal Shortenings Revenue (USD Million) By Type (2021-2032)
Figure 41. Middle East and Africa Animal Shortenings Revenue (USD Million) By Application (2021-2032)
Figure 42. Middle East and Africa Animal Shortenings Revenue (USD Million) By Product (2021-2032)
By Type
Solid
Liquid
Cake/Icing
All-purpose
Others
By Application
Bakery products
Confectionery products
Snacks & savory products
Others
Countries Analyzed
North America (US, Canada, Mexico)
Europe (Germany, UK, France, Spain, Italy, Russia, Rest of Europe)
Asia Pacific (China, India, Japan, South Korea, Australia, South East Asia, Rest of Asia)
South America (Brazil, Argentina, Rest of South America)
Middle East and Africa (Saudi Arabia, UAE, Rest of Middle East, South Africa, Egypt, Rest of Africa)
