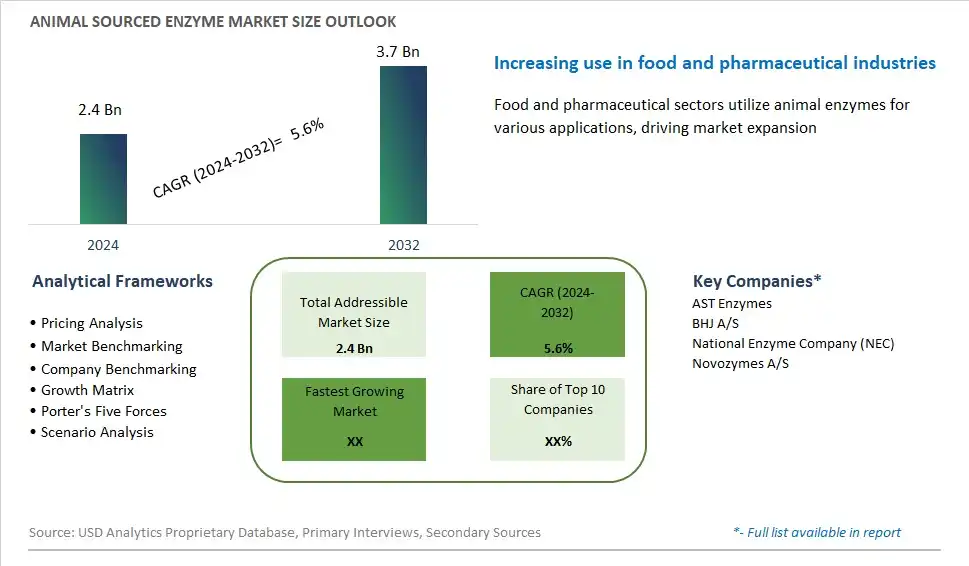
Global Animal Sourced Enzyme Market Size is valued at $2.4 Billion in 2024 and is forecast to register a growth rate (CAGR) of 5.6% to reach $3.7 Billion by 2032.
The global Animal Sourced Enzyme Market Comprehensive Study analyzes and forecasts the market size across 6 regions and 24 countries for diverse segments -By Enzyme (Lysozyme, Pepsin, Rennet, Trypsin, Others), By Source (Food & Beverage, Cosmetics, Pharmaceutical, Dietary supplements, Animal feed, Others), By Application (Pork, Beef, Poultry)
An Introduction to Animal Sourced Enzyme Market
Animal-sourced enzymes are enzymes derived from animal tissues or secretions and used in various industrial applications, including food processing, pharmaceuticals, and biotechnology, in 2024. These enzymes are extracted from sources such as the pancreas, stomach, or intestine of animals and are utilized for their catalytic activity in biochemical reactions. Animal-sourced enzymes play crucial roles in processes such as digestion, fermentation, and protein modification, where they act as catalysts to accelerate chemical reactions and improve process efficiency. Common animal-sourced enzymes include pepsin, trypsin, chymotrypsin, and lipase, each with specific substrate preferences and applications. With advancements in enzyme engineering, purification techniques, and bioprocessing, the market for animal-sourced enzymes is expanding, driven by their diverse industrial applications, regulatory approvals, and demand for sustainable and high-performance enzyme solutions that meet the needs of various industries and market segments.
Animal Sourced Enzyme Competitive Landscape
The market report analyses the leading companies in the industry including AST Enzymes, BHJ A/S, National Enzyme Company (NEC), Novozymes A/S, and Others.
Animal Sourced Enzyme Market Dynamics
Animal Sourced Enzyme Market Trend: Growing Demand for Sustainable and Ethical Sourcing
The market for animal-sourced enzymes is witnessing a significant trend towards sustainable and ethical sourcing practices. With increasing consumer awareness and demand for transparency in supply chains, companies are under pressure to ensure that the enzymes they use are sourced ethically and sustainably. This trend is driven by concerns about animal welfare, environmental sustainability, and the desire for cruelty-free products. As a result, companies in the animal-sourced enzyme market are exploring alternatives such as plant-based or synthetic enzymes to meet consumer demands while maintaining product efficacy.
Market Driver: Expansion in Biotechnology and Pharmaceutical Industries
One of the primary drivers of the animal-sourced enzyme market is the expansion of the biotechnology and pharmaceutical industries. Enzymes sourced from animals play a crucial role in various applications within these industries, including drug development, bioprocessing, and research. The increasing demand for enzymes with specific functionalities, such as proteases, lipases, and amylases, to optimize biotechnological processes is fueling market growth. Moreover, advancements in genetic engineering and enzyme modification techniques are enabling the development of novel enzyme variants with enhanced properties, further driving market expansion.
Market Opportunity: Diversification into Emerging Markets and Applications
An exciting opportunity in the animal-sourced enzyme market lies in diversifying into emerging markets and applications. While traditional applications such as food processing, textile manufacturing, and detergents continue to dominate the market, there is a growing demand for enzymes in new sectors such as biofuel production, waste management, and bioremediation. Additionally, expanding into emerging economies presents opportunities for market penetration and growth, as these regions often have burgeoning biotechnology and pharmaceutical sectors with increasing demand for enzyme-based solutions. By investing in research and development to adapt existing enzymes or develop novel ones for these applications, companies can capitalize on untapped market potential and gain a competitive edge.
Animal Sourced Enzyme Market Share Analysis: Trypsin held the dominant market share in 2024
Trypsin is the largest segment in the animal sourced enzyme market due to its versatile applications across various industries, including pharmaceuticals, food processing, and biotechnology. As a proteolytic enzyme, trypsin plays a crucial role in protein digestion, making it an essential component in animal feeds, particularly in the aquaculture and poultry sectors, to improve nutrient absorption and growth performance. In the pharmaceutical industry, trypsin finds extensive use in cell culture and tissue dissociation processes, contributing to the production of vaccines, antibodies, and therapeutic proteins. Furthermore, trypsin's applications in leather processing, cosmetics, and research laboratories further augment its demand. The wide-ranging utility of trypsin, coupled with advancements in enzyme extraction and purification technologies, sustains its dominance as the largest segment in the animal sourced enzyme market.
Animal Sourced Enzyme Market Share Analysis: Dietary Supplements market is poised to register the fastest growth rae over the forecast period to 2032
The dietary supplements segment is experiencing the fastest growth in the animal sourced enzyme market owing to the rising consumer awareness regarding the importance of digestive health and wellness. Enzyme supplements derived from animal sources, such as pepsin and pancreatin, are increasingly sought after for their ability to aid digestion, alleviate gastrointestinal discomfort, and enhance nutrient absorption. As dietary trends shift towards functional foods and natural remedies, consumers are turning to enzyme supplements to address digestive issues and promote overall well-being. Further, the expanding aging population, coupled with the prevalence of digestive disorders and food intolerances, further fuels the demand for enzyme supplements as part of a proactive approach to health management. Additionally, the growing availability of enzyme supplements in various forms, such as capsules, tablets, and powders, and the proliferation of distribution channels, including online platforms and pharmacies, contribute to the segment's rapid growth trajectory in the animal sourced enzyme market.
Animal Sourced Enzyme Market Share Analysis: Poultry held the dominant market share in 2024
The poultry segment is the largest in the animal sourced enzyme market due to the significant global consumption of poultry products and the intensive nature of poultry production. Enzymes sourced from animals, such as pepsin and trypsin, are widely utilized in poultry feed formulations to enhance nutrient digestion and absorption, thereby promoting optimal growth and performance of poultry birds. With the increasing demand for protein-rich diets and the rising population, poultry meat and eggs have become staple food items worldwide, driving the need for efficient feed additives to support the poultry industry's expansion. Further, advancements in feed technology and the growing focus on improving feed efficiency and sustainability further bolster the demand for animal sourced enzymes in poultry applications. As poultry production continues to grow to meet the escalating consumer demand for affordable and nutritious protein sources, the poultry segment maintains its dominance as the largest in the animal sourced enzyme market.
Animal Sourced Enzyme Market Segmentation
By Enzyme
Lysozyme
Pepsin
Rennet
Trypsin
Others
By Source
Food & Beverage
Cosmetics
Pharmaceutical
Dietary supplements
Animal feed
Others
By Application
Pork
Beef
Poultry
Countries Analyzed
North America (US, Canada, Mexico)
Europe (Germany, UK, France, Spain, Italy, Russia, Rest of Europe)
Asia Pacific (China, India, Japan, South Korea, Australia, South East Asia, Rest of Asia)
South America (Brazil, Argentina, Rest of South America)
Middle East and Africa (Saudi Arabia, UAE, Rest of Middle East, South Africa, Egypt, Rest of Africa)
Animal Sourced Enzyme Companies Profiled in the Study
AST Enzymes
BHJ A/S
National Enzyme Company (NEC)
Novozymes A/S
*- List Not Exhaustive
Chapter 1. TABLE OF CONTENTS
Chapter 2. Introduction to Animal Sourced Enzyme Market
2.1. Market Overview
2.2. Key Statistics and Report Highlights
2.3. Scope of the Comprehensive Study
2.3.1. Market Definition
2.3.2 Countries and Regions Covered
2.3.3 Research Objective
2.3.4 Units, Currency, and Conversions
2.3.5 Industry Value Chain
2.4. Key Market Segments
2.5. Key Companies
2.6. Study Period
Chapter 3. Strategic Analysis Review
3.1. Animal Sourced Enzyme Pricing Analysis and Forecast
3.2. Porter’s Five Forces
3.3. Market Ecosystem
3.4. SWOT Analysis
3.5. Regulatory Scenario
3.3. Effects of Inflation, Russia-Ukraine War, moderating economic growth, and other macroeconomic factors
Chapter 4. Competitive Landscape
4.1. Market Share Analysis
4.1.1. Global Animal Sourced Enzyme Market Share by Company, 2023
4.1.2. Product Offerings of Leading Animal Sourced Enzyme Companies
4.2. Market Entropy
4.2.1. New Product Launches in the Industry
4.2.2. Mergers, Acquisitions, Joint ventures, and Partnerships
4.3. Key Strategies and Best Practices
Chapter 5. Global Market Projections: Best, Reference, and Low Case Scenarios
5.1. Growth Analysis- Case Scenario Definitions
5.2. Low Growth Case Scenario Forecasts
5.3. Reference Growth Case Scenario Forecasts
5.4. High Growth Case Scenario Forecasts
Chapter 6. Market Dynamics
6.1. Animal Sourced Enzyme Market Drivers
6.2. Animal Sourced Enzyme Market Challenges
6.6. Animal Sourced Enzyme Market Opportunities
6.4. Animal Sourced Enzyme Market Trends
Chapter 7. Global Animal Sourced Enzyme Market Outlook Trends
7.1. Global Animal Sourced Enzyme Revenue (USD Million) and CAGR (%) by Type (2021-2032)
7.2. Global Animal Sourced Enzyme Revenue (USD Million) and CAGR (%) by Application (2021-2032)
7.3. Global Animal Sourced Enzyme Revenue (USD Million) and CAGR (%) by Product (2021-2032)
By Enzyme
Lysozyme
Pepsin
Rennet
Trypsin
Others
By Source
Food & Beverage
Cosmetics
Pharmaceutical
Dietary supplements
Animal feed
Others
By Application
Pork
Beef
Poultry
Chapter 8. Global Animal Sourced Enzyme Regional Analysis and Outlook
8.1. Global Animal Sourced Enzyme Revenue (USD Million) By Regions (2021- 2032)
8.2. North America Animal Sourced Enzyme Revenue (USD Million) by Country (2021-2032)
8.2.1. United States Animal Sourced Enzyme Regional Analysis and Outlook
8.2.2. Canada Animal Sourced Enzyme Regional Analysis and Outlook
8.2.3. Mexico Animal Sourced Enzyme Regional Analysis and Outlook
8.3. Europe Animal Sourced Enzyme Revenue (USD Million), by Country (2021-2032)
8.3.1. Germany Animal Sourced Enzyme Regional Analysis and Outlook
8.3.2. France Animal Sourced Enzyme Regional Analysis and Outlook
8.3.3. United Kingdom Animal Sourced Enzyme Regional Analysis and Outlook
8.3.4. Spain Animal Sourced Enzyme Regional Analysis and Outlook
8.3.5. Italy Animal Sourced Enzyme Regional Analysis and Outlook
8.3.6. Russia Animal Sourced Enzyme Regional Analysis and Outlook
8.3.7. Rest of Europe Animal Sourced Enzyme Regional Analysis and Outlook
8.4. Asia Pacific Animal Sourced Enzyme Revenue (USD Million) by Country (2021-2032)
8.4.1. China Animal Sourced Enzyme Regional Analysis and Outlook
8.4.2. Japan Animal Sourced Enzyme Regional Analysis and Outlook
8.4.3. India Animal Sourced Enzyme Regional Analysis and Outlook
8.4.4. South Korea Animal Sourced Enzyme Regional Analysis and Outlook
8.4.5. Australia Animal Sourced Enzyme Regional Analysis and Outlook
8.4.6. South East Asia Animal Sourced Enzyme Regional Analysis and Outlook
8.4.7. Rest of Asia Pacific Animal Sourced Enzyme Regional Analysis and Outlook
8.5. South America Animal Sourced Enzyme Revenue (USD Million), by Country (2021-2032)
8.5.1. Brazil Animal Sourced Enzyme Regional Analysis and Outlook
8.5.2. Argentina Animal Sourced Enzyme Regional Analysis and Outlook
8.5.3. Rest of South America Animal Sourced Enzyme Regional Analysis and Outlook
8.6. Middle East and Africa Animal Sourced Enzyme Revenue (USD Million) by Country (2021-2032)
8.6.1. Middle East Animal Sourced Enzyme Regional Analysis and Outlook
8.6.2. Africa Animal Sourced Enzyme Regional Analysis and Outlook
Chapter 9. North America Animal Sourced Enzyme Analysis and Outlook
9.1. North America Animal Sourced Enzyme Revenue (USD Million) by Segments (2021-2032)
9.1.1. North America Animal Sourced Enzyme Revenue (USD Million) by Type (2021-2032)
9.1.2. North America Animal Sourced Enzyme Revenue (USD Million) by Application (2021-2032)
9.1.3. North America Animal Sourced Enzyme Revenue (USD Million) by Product (2021-2032)
By Enzyme
Lysozyme
Pepsin
Rennet
Trypsin
Others
By Source
Food & Beverage
Cosmetics
Pharmaceutical
Dietary supplements
Animal feed
Others
By Application
Pork
Beef
Poultry
Chapter 10. Europe Animal Sourced Enzyme Analysis and Outlook
10.1. Europe Animal Sourced Enzyme Revenue (USD Million), by Segments (USD Million) (2021-2032)
10.1.1. Europe Animal Sourced Enzyme Revenue (USD Million) by Type (2021-2032)
10.1.2. Europe Animal Sourced Enzyme Revenue (USD Million) by Application (2021-2032)
10.1.3. Europe Animal Sourced Enzyme Revenue (USD Million) by Product (2021-2032)
By Enzyme
Lysozyme
Pepsin
Rennet
Trypsin
Others
By Source
Food & Beverage
Cosmetics
Pharmaceutical
Dietary supplements
Animal feed
Others
By Application
Pork
Beef
Poultry
Chapter 11. Asia Pacific Animal Sourced Enzyme Analysis and Outlook
11.1. Asia Pacific Animal Sourced Enzyme Revenue (USD Million), and Revenue (USD Million) by Segments (2021-2032)
11.1.1. Asia Pacific Animal Sourced Enzyme Revenue (USD Million) by Type (2021-2032)
11.1.2. Asia Pacific Animal Sourced Enzyme Revenue (USD Million) by Application (2021-2032)
11.1.3. Asia Pacific Animal Sourced Enzyme Revenue (USD Million) by Product (2021-2032)
By Enzyme
Lysozyme
Pepsin
Rennet
Trypsin
Others
By Source
Food & Beverage
Cosmetics
Pharmaceutical
Dietary supplements
Animal feed
Others
By Application
Pork
Beef
Poultry
Chapter 12. South America Animal Sourced Enzyme Analysis and Outlook
12.1. South America Animal Sourced Enzyme Revenue (USD Million), by Segments (2021-2032)
12.1.1. South America Animal Sourced Enzyme Revenue (USD Million) by Type (2021-2032)
12.1.2. South America Animal Sourced Enzyme Revenue (USD Million) by Application (2021-2032)
12.1.3. South America Animal Sourced Enzyme Revenue (USD Million) by Product (2021-2032)
By Enzyme
Lysozyme
Pepsin
Rennet
Trypsin
Others
By Source
Food & Beverage
Cosmetics
Pharmaceutical
Dietary supplements
Animal feed
Others
By Application
Pork
Beef
Poultry
Chapter 13. Middle East and Africa Animal Sourced Enzyme Analysis and Outlook
13.1. Middle East and Africa Animal Sourced Enzyme Revenue (USD Million), by Segments (2021-2032)
13.1.1. Middle East and Africa Animal Sourced Enzyme Revenue (USD Million) by Type (2021-2032)
13.1.2. Middle East and Africa Animal Sourced Enzyme Revenue (USD Million) by Application (2021-2032)
13.1.3. Middle East and Africa Animal Sourced Enzyme Revenue (USD Million) by Product (2021-2032)
By Enzyme
Lysozyme
Pepsin
Rennet
Trypsin
Others
By Source
Food & Beverage
Cosmetics
Pharmaceutical
Dietary supplements
Animal feed
Others
By Application
Pork
Beef
Poultry
Chapter 14. Animal Sourced Enzyme Company Profiles
14.1 Business Overview
14.2 Product Profiles
14.3 SWOT Profiles
14.5 Recent Developments
14.6 Financial Profile
List of Companies
AST Enzymes
BHJ A/S
National Enzyme Company (NEC)
Novozymes A/S
15. Methodology and Data Sources
15.1 Customization Offerings
15.2 Subscription Services
15.3 Related Reports
15.4 Publisher Expertise
LIST OF TABLES
Table 1 Market Segmentation Analysis
Table 2 Global Animal Sourced Enzyme Market Share of Leading Companies, 2023
Table 3 Product Offerings of Leading Companies
Table 4 Low Growth Scenario Forecasts
Table 5 Reference Case Growth Scenario
Table 6 High Growth Case Scenario
Table 7 Global Animal Sourced Enzyme Revenue (USD Million) And CAGR (%) By Type (2021-2032)
Table 8 Global Animal Sourced Enzyme Revenue (USD Million) And CAGR (%) By Application (2021-2032)
Table 9 Global Animal Sourced Enzyme Revenue (USD Million) And CAGR (%) By Product (2021-2032)
Table 10 Global Animal Sourced Enzyme Market Revenue (USD Million) By Regions (2021-2032)
Table 11 Global Animal Sourced Enzyme Market Share (%) By Regions (2021-2032)
Table 12 North America Animal Sourced Enzyme Revenue (USD Million) By Country (2021-2032)
Table 13 Europe Animal Sourced Enzyme Revenue (USD Million) By Country (2021-2032)
Table 14 Asia Pacific Animal Sourced Enzyme Revenue (USD Million) By Country (2021-2032)
Table 15 South America Animal Sourced Enzyme Revenue (USD Million) By Country (2021-2032)
Table 16 Middle East and Africa Animal Sourced Enzyme Revenue (USD Million) By Region (2021-2032)
Table 17 North America Animal Sourced Enzyme Revenue (USD Million) By Type (2021-2032)
Table 18 North America Animal Sourced Enzyme Revenue (USD Million) By Application (2021-2032)
Table 19 North America Animal Sourced Enzyme Revenue (USD Million) By Product (2021-2032)
Table 20 Europe Animal Sourced Enzyme Revenue (USD Million) By Type (2021-2032)
Table 21 Europe Animal Sourced Enzyme Revenue (USD Million) By Application (2021-2032)
Table 22 Europe Animal Sourced Enzyme Revenue (USD Million) By Product (2021-2032)
Table 23 Asia Pacific Animal Sourced Enzyme Revenue (USD Million) By Type (2021-2032)
Table 24 Asia Pacific Animal Sourced Enzyme Revenue (USD Million) By Application (2021-2032)
Table 25 Asia Pacific Animal Sourced Enzyme Revenue (USD Million) By Product (2021-2032)
Table 26 South America Animal Sourced Enzyme Revenue (USD Million) By Type (2021-2032)
Table 27 South America Animal Sourced Enzyme Revenue (USD Million) By Application (2021-2032)
Table 28 South America Animal Sourced Enzyme Revenue (USD Million) By Product (2021-2032)
Table 29 Middle East and Africa Animal Sourced Enzyme Revenue (USD Million) By Type (2021-2032)
Table 30 Middle East and Africa Animal Sourced Enzyme Revenue (USD Million) By Application (2021-2032)
Table 31 Middle East and Africa Animal Sourced Enzyme Revenue (USD Million) By Product (2021-2032)
LIST OF FIGURES
Figure 1. Market Scope
Figure 2. Pricing Forecasts Per Unit, 2023- 2032
Figure 3. Porter’s Five Forces
Figure 4. Global Animal Sourced Enzyme Market Revenue (USD Million) By Regions (2021-2032)
Figure 5. Global Animal Sourced Enzyme Market Share (%) By Regions (2023)
Figure 6. North America Animal Sourced Enzyme Revenue (USD Million) By Country (2021-2032)
Figure 7. United States Animal Sourced Enzyme Revenue (USD Million) By Country (2021-2032)
Figure 8. Canada Animal Sourced Enzyme Revenue (USD Million) By Country (2021-2032)
Figure 9. Mexico Animal Sourced Enzyme Revenue (USD Million) By Country (2021-2032)
Figure 10. Europe Animal Sourced Enzyme Revenue (USD Million) By Country (2021-2032)
Figure 11. Germany Animal Sourced Enzyme Revenue (USD Million) By Country (2021-2032)
Figure 12. France Animal Sourced Enzyme Revenue (USD Million) By Country (2021-2032)
Figure 13. United Kingdom Animal Sourced Enzyme Revenue (USD Million) By Country (2021-2032)
Figure 14. Spain Animal Sourced Enzyme Revenue (USD Million) By Country (2021-2032)
Figure 15. Italy Animal Sourced Enzyme Revenue (USD Million) By Country (2021-2032)
Figure 16. Russia Animal Sourced Enzyme Revenue (USD Million) By Country (2021-2032)
Figure 17. Rest of Europe Animal Sourced Enzyme Revenue (USD Million) By Country (2021-2032)
Figure 11. Asia Pacific Animal Sourced Enzyme Revenue (USD Million) By Country (2021-2032)
Figure 12. China Animal Sourced Enzyme Revenue (USD Million) By Country (2021-2032)
Figure 13. Japan Animal Sourced Enzyme Revenue (USD Million) By Country (2021-2032)
Figure 14. India Animal Sourced Enzyme Revenue (USD Million) By Country (2021-2032)
Figure 15. South Korea Animal Sourced Enzyme Revenue (USD Million) By Country (2021-2032)
Figure 16. Australia Animal Sourced Enzyme Revenue (USD Million) By Country (2021-2032)
Figure 17. South East Asia Animal Sourced Enzyme Revenue (USD Million) By Country (2021-2032)
Figure 18. South America Animal Sourced Enzyme Revenue (USD Million) By Country (2021-2032)
Figure 19. Brazil Animal Sourced Enzyme Revenue (USD Million) By Country (2021-2032)
Figure 20. Argentina Animal Sourced Enzyme Revenue (USD Million) By Country (2021-2032)
Figure 21. Rest of Asia Pacific Animal Sourced Enzyme Revenue (USD Million) By Country (2021-2032)
Figure 22. Middle East and Africa Animal Sourced Enzyme Revenue (USD Million) By Region (2021-2032)
Figure 23. Saudi Arabia Animal Sourced Enzyme Revenue (USD Million) By Region (2021-2032)
Figure 24. The UAE Animal Sourced Enzyme Revenue (USD Million) By Region (2021-2032)
Figure 25. Rest of Middle East Animal Sourced Enzyme Revenue (USD Million) By Region (2021-2032)
Figure 26. South Africa Animal Sourced Enzyme Revenue (USD Million) By Region (2021-2032)
Figure 27. Africa Animal Sourced Enzyme Revenue (USD Million) By Region (2021-2032)
Figure 28. North America Animal Sourced Enzyme Revenue (USD Million) By Type (2021-2032)
Figure 29. North America Animal Sourced Enzyme Revenue (USD Million) By Application (2021-2032)
Figure 30. North America Animal Sourced Enzyme Revenue (USD Million) By Product (2021-2032)
Figure 31. Europe Animal Sourced Enzyme Revenue (USD Million) By Type (2021-2032)
Figure 32. Europe Animal Sourced Enzyme Revenue (USD Million) By Application (2021-2032)
Figure 33. Europe Animal Sourced Enzyme Revenue (USD Million) By Product (2021-2032)
Figure 34. Asia Pacific Animal Sourced Enzyme Revenue (USD Million) By Type (2021-2032)
Figure 35. Asia Pacific Animal Sourced Enzyme Revenue (USD Million) By Application (2021-2032)
Figure 36. Asia Pacific Animal Sourced Enzyme Revenue (USD Million) By Product (2021-2032)
Figure 37. South America Animal Sourced Enzyme Revenue (USD Million) By Type (2021-2032)
Figure 38. South America Animal Sourced Enzyme Revenue (USD Million) By Application (2021-2032)
Figure 39. South America Animal Sourced Enzyme Revenue (USD Million) By Product (2021-2032)
Figure 40. Middle East and Africa Animal Sourced Enzyme Revenue (USD Million) By Type (2021-2032)
Figure 41. Middle East and Africa Animal Sourced Enzyme Revenue (USD Million) By Application (2021-2032)
Figure 42. Middle East and Africa Animal Sourced Enzyme Revenue (USD Million) By Product (2021-2032)
By Enzyme
Lysozyme
Pepsin
Rennet
Trypsin
Others
By Source
Food & Beverage
Cosmetics
Pharmaceutical
Dietary supplements
Animal feed
Others
By Application
Pork
Beef
Poultry
Countries Analyzed
North America (US, Canada, Mexico)
Europe (Germany, UK, France, Spain, Italy, Russia, Rest of Europe)
Asia Pacific (China, India, Japan, South Korea, Australia, South East Asia, Rest of Asia)
South America (Brazil, Argentina, Rest of South America)
Middle East and Africa (Saudi Arabia, UAE, Rest of Middle East, South Africa, Egypt, Rest of Africa)
