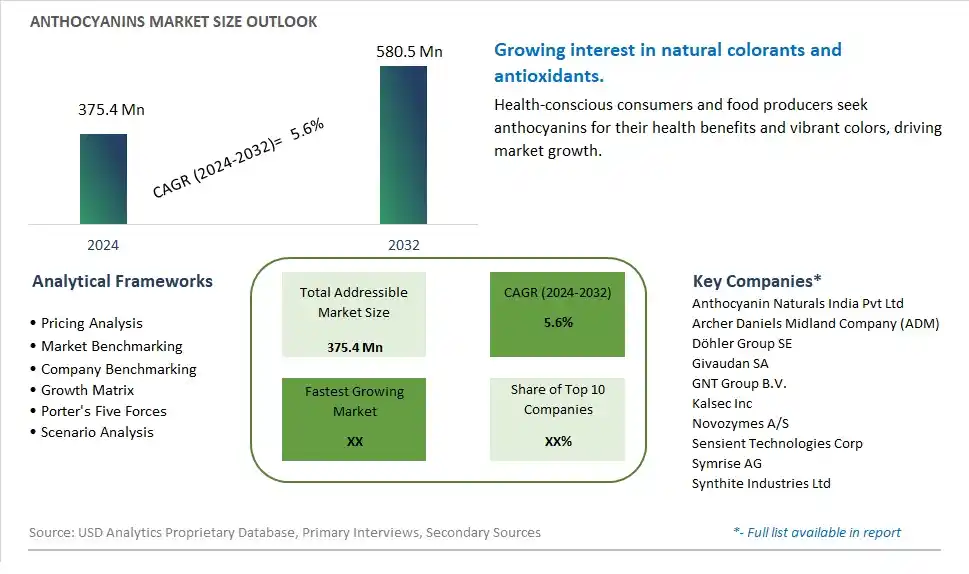
Global Anthocyanins Market Size is valued at $375.4 Million in 2024 and is forecast to register a growth rate (CAGR) of 5.6% to reach $580.5 Million by 2032.
The global Anthocyanins Market Comprehensive Study analyzes and forecasts the market size across 6 regions and 24 countries for diverse segments -By Type (Cyanidin, Malvidin, Delphinidin, Peonidin, Others), By Application (Food & Beverage, Pharmaceutical, Personal Care, Animal Feed)
An Introduction to Anthocyanins Market
The Anthocyanins market in 2024 is growing robustly, driven by the increasing demand for natural colorants and health-promoting ingredients in the food, beverage, and dietary supplement industries. Anthocyanins, plant pigments responsible for red, purple, and blue colors in fruits and vegetables, are valued for their antioxidant properties and potential health benefits. The market is supported by the rising consumer preference for clean-label and natural products. Advances in extraction and stabilization technologies are enhancing the application versatility and stability of anthocyanins. The market is also benefiting from the growing interest in functional foods and beverages that offer both nutritional and aesthetic appeal.
Anthocyanins Competitive Landscape
The market report analyses the leading companies in the industry including Anthocyanin Naturals India Pvt Ltd, Archer Daniels Midland Company (ADM), Döhler Group SE, Givaudan SA, GNT Group B.V., Kalsec Inc, Novozymes A/S, Sensient Technologies Corp, Symrise AG, Synthite Industries Ltd, and Others.
Anthocyanins Market Dynamics
Anthocyanins Market Trend: Increasing Demand for Natural Colorants
The Anthocyanins market is witnessing a significant trend towards the increasing demand for natural colorants. As consumers and manufacturers move away from synthetic additives due to health concerns and regulatory pressures, anthocyanins, derived from fruits and vegetables, are becoming the preferred choice for food and beverage coloration. This trend is driven by the growing consumer preference for clean-label products that emphasize natural ingredients. The vibrant colors provided by anthocyanins, along with their additional antioxidant benefits, make them an attractive option for enhancing the visual appeal and nutritional value of a wide range of products, from beverages to confectioneries.
Anthocyanins Market Driver: Rising Awareness of Health Benefits
A major driver for the Anthocyanins market is the rising awareness of the health benefits associated with these compounds. Anthocyanins are known for their potent antioxidant properties, which can help in reducing oxidative stress and inflammation, improving cardiovascular health, and potentially offering protective effects against certain chronic diseases. As consumers become more health-conscious and seek functional foods that provide added health benefits, the demand for anthocyanin-rich products is increasing. This driver is further supported by scientific research and health claims that highlight the positive impacts of anthocyanins on overall well-being.
Anthocyanins Market Opportunity: Expansion into Nutraceuticals and Functional Foods
Expansion into the nutraceuticals and functional foods sector presents a substantial opportunity for the Anthocyanins market. With the growing trend towards preventive healthcare and the use of food as medicine, there is significant potential for anthocyanins to be incorporated into dietary supplements, functional beverages, and health-focused food products. By developing innovative formulations and highlighting the scientifically-backed health benefits of anthocyanins, manufacturers can cater to the increasing demand for products that support health and wellness. This approach not only broadens the market reach but also positions anthocyanins as a key ingredient in the rapidly expanding nutraceuticals and functional foods market.
Anthocyanins Market Share Analysis: Malvidin segment generated the highest revenue share in the industry
The Malvidin segment emerges as the largest in the Anthocyanins Market, showcasing substantial growth and widespread utilization. Malvidin is a type of anthocyanin, a natural pigment responsible for the vibrant red, purple, and blue colors found in various fruits, vegetables, and flowers. This segment dominates the market for several reasons. Firstly, malvidin is widely recognized for its potent antioxidant properties, which contribute to its numerous health benefits, including anti-inflammatory, cardiovascular, and anti-aging effects. Further, malvidin is commonly found in berries such as blueberries, blackberries, and grapes, which are popular ingredients in the food and beverage industry. The increasing consumer demand for natural and functional ingredients in food products has fueled the adoption of malvidin as a natural colorant and health-promoting agent. Additionally, advancements in extraction technologies have made it easier to isolate and concentrate malvidin from plant sources, further driving its availability and utilization in various industries. With the growing emphasis on natural and healthy food products, the Malvidin segment is positioned to maintain its market leadership and drive significant growth in the Anthocyanins Market.
Anthocyanins Market Share Analysis: Food & Beverage is the fastest growing segment over the forecast period to 2032
The Food & Beverage segment within the Anthocyanins Market is poised for rapid growth leading up to 2032. This segment encompasses a wide range of applications in the food and beverage industry, including natural colorants, flavor enhancers, and health-promoting additives. The Food & Beverage segment's accelerated expansion is driven by several key factors. Firstly, there's a growing consumer preference for natural and clean-label ingredients in food and beverage products, leading manufacturers to seek natural colorants like anthocyanins, which are derived from fruits, vegetables, and flowers. Anthocyanins, including popular types like malvidin, cyanidin, and delphinidin, offer vibrant colors ranging from red to purple to blue, making them attractive options for enhancing the visual appeal of various food and beverage items. Further, anthocyanins are known for their antioxidant properties and potential health benefits, further driving their inclusion in functional and wellness-focused products. The Food & Beverage segment also benefits from technological advancements in extraction and formulation processes, making it easier for manufacturers to incorporate anthocyanins into a wide range of food and beverage formulations. With the increasing demand for natural and healthy food products, the Food & Beverage segment is well-positioned to experience significant growth and emerge as a dominant force in the Anthocyanins Market.
Anthocyanins Market Segmentation
By Type
Cyanidin
Malvidin
Delphinidin
Peonidin
Others
By Application
Food & Beverage
Pharmaceutical
Personal Care
Animal Feed
Countries Analyzed
North America (US, Canada, Mexico)
Europe (Germany, UK, France, Spain, Italy, Russia, Rest of Europe)
Asia Pacific (China, India, Japan, South Korea, Australia, South East Asia, Rest of Asia)
South America (Brazil, Argentina, Rest of South America)
Middle East and Africa (Saudi Arabia, UAE, Rest of Middle East, South Africa, Egypt, Rest of Africa)
Anthocyanins Companies Profiled in the Study
Anthocyanin Naturals India Pvt Ltd
Archer Daniels Midland Company (ADM)
Döhler Group SE
Givaudan SA
GNT Group B.V.
Kalsec Inc
Novozymes A/S
Sensient Technologies Corp
Symrise AG
Synthite Industries Ltd
*- List Not Exhaustive
Chapter 1. TABLE OF CONTENTS
Chapter 2. Introduction to Anthocyanins Market
2.1. Market Overview
2.2. Key Statistics and Report Highlights
2.3. Scope of the Comprehensive Study
2.3.1. Market Definition
2.3.2 Countries and Regions Covered
2.3.3 Research Objective
2.3.4 Units, Currency, and Conversions
2.3.5 Industry Value Chain
2.4. Key Market Segments
2.5. Key Companies
2.6. Study Period
Chapter 3. Strategic Analysis Review
3.1. Anthocyanins Pricing Analysis and Forecast
3.2. Porter’s Five Forces
3.3. Market Ecosystem
3.4. SWOT Analysis
3.5. Regulatory Scenario
3.3. Effects of Inflation, Russia-Ukraine War, moderating economic growth, and other macroeconomic factors
Chapter 4. Competitive Landscape
4.1. Market Share Analysis
4.1.1. Global Anthocyanins Market Share by Company, 2023
4.1.2. Product Offerings of Leading Anthocyanins Companies
4.2. Market Entropy
4.2.1. New Product Launches in the Industry
4.2.2. Mergers, Acquisitions, Joint ventures, and Partnerships
4.3. Key Strategies and Best Practices
Chapter 5. Global Market Projections: Best, Reference, and Low Case Scenarios
5.1. Growth Analysis- Case Scenario Definitions
5.2. Low Growth Case Scenario Forecasts
5.3. Reference Growth Case Scenario Forecasts
5.4. High Growth Case Scenario Forecasts
Chapter 6. Market Dynamics
6.1. Anthocyanins Market Drivers
6.2. Anthocyanins Market Challenges
6.6. Anthocyanins Market Opportunities
6.4. Anthocyanins Market Trends
Chapter 7. Global Anthocyanins Market Outlook Trends
7.1. Global Anthocyanins Revenue (USD Million) and CAGR (%) by Type (2021-2032)
7.2. Global Anthocyanins Revenue (USD Million) and CAGR (%) by Application (2021-2032)
7.3. Global Anthocyanins Revenue (USD Million) and CAGR (%) by Product (2021-2032)
By Type
Cyanidin
Malvidin
Delphinidin
Peonidin
Others
By Application
Food & Beverage
Pharmaceutical
Personal Care
Animal Feed
Chapter 8. Global Anthocyanins Regional Analysis and Outlook
8.1. Global Anthocyanins Revenue (USD Million) By Regions (2021- 2032)
8.2. North America Anthocyanins Revenue (USD Million) by Country (2021-2032)
8.2.1. United States Anthocyanins Regional Analysis and Outlook
8.2.2. Canada Anthocyanins Regional Analysis and Outlook
8.2.3. Mexico Anthocyanins Regional Analysis and Outlook
8.3. Europe Anthocyanins Revenue (USD Million), by Country (2021-2032)
8.3.1. Germany Anthocyanins Regional Analysis and Outlook
8.3.2. France Anthocyanins Regional Analysis and Outlook
8.3.3. United Kingdom Anthocyanins Regional Analysis and Outlook
8.3.4. Spain Anthocyanins Regional Analysis and Outlook
8.3.5. Italy Anthocyanins Regional Analysis and Outlook
8.3.6. Russia Anthocyanins Regional Analysis and Outlook
8.3.7. Rest of Europe Anthocyanins Regional Analysis and Outlook
8.4. Asia Pacific Anthocyanins Revenue (USD Million) by Country (2021-2032)
8.4.1. China Anthocyanins Regional Analysis and Outlook
8.4.2. Japan Anthocyanins Regional Analysis and Outlook
8.4.3. India Anthocyanins Regional Analysis and Outlook
8.4.4. South Korea Anthocyanins Regional Analysis and Outlook
8.4.5. Australia Anthocyanins Regional Analysis and Outlook
8.4.6. South East Asia Anthocyanins Regional Analysis and Outlook
8.4.7. Rest of Asia Pacific Anthocyanins Regional Analysis and Outlook
8.5. South America Anthocyanins Revenue (USD Million), by Country (2021-2032)
8.5.1. Brazil Anthocyanins Regional Analysis and Outlook
8.5.2. Argentina Anthocyanins Regional Analysis and Outlook
8.5.3. Rest of South America Anthocyanins Regional Analysis and Outlook
8.6. Middle East and Africa Anthocyanins Revenue (USD Million) by Country (2021-2032)
8.6.1. Middle East Anthocyanins Regional Analysis and Outlook
8.6.2. Africa Anthocyanins Regional Analysis and Outlook
Chapter 9. North America Anthocyanins Analysis and Outlook
9.1. North America Anthocyanins Revenue (USD Million) by Segments (2021-2032)
9.1.1. North America Anthocyanins Revenue (USD Million) by Type (2021-2032)
9.1.2. North America Anthocyanins Revenue (USD Million) by Application (2021-2032)
9.1.3. North America Anthocyanins Revenue (USD Million) by Product (2021-2032)
By Type
Cyanidin
Malvidin
Delphinidin
Peonidin
Others
By Application
Food & Beverage
Pharmaceutical
Personal Care
Animal Feed
Chapter 10. Europe Anthocyanins Analysis and Outlook
10.1. Europe Anthocyanins Revenue (USD Million), by Segments (USD Million) (2021-2032)
10.1.1. Europe Anthocyanins Revenue (USD Million) by Type (2021-2032)
10.1.2. Europe Anthocyanins Revenue (USD Million) by Application (2021-2032)
10.1.3. Europe Anthocyanins Revenue (USD Million) by Product (2021-2032)
By Type
Cyanidin
Malvidin
Delphinidin
Peonidin
Others
By Application
Food & Beverage
Pharmaceutical
Personal Care
Animal Feed
Chapter 11. Asia Pacific Anthocyanins Analysis and Outlook
11.1. Asia Pacific Anthocyanins Revenue (USD Million), and Revenue (USD Million) by Segments (2021-2032)
11.1.1. Asia Pacific Anthocyanins Revenue (USD Million) by Type (2021-2032)
11.1.2. Asia Pacific Anthocyanins Revenue (USD Million) by Application (2021-2032)
11.1.3. Asia Pacific Anthocyanins Revenue (USD Million) by Product (2021-2032)
By Type
Cyanidin
Malvidin
Delphinidin
Peonidin
Others
By Application
Food & Beverage
Pharmaceutical
Personal Care
Animal Feed
Chapter 12. South America Anthocyanins Analysis and Outlook
12.1. South America Anthocyanins Revenue (USD Million), by Segments (2021-2032)
12.1.1. South America Anthocyanins Revenue (USD Million) by Type (2021-2032)
12.1.2. South America Anthocyanins Revenue (USD Million) by Application (2021-2032)
12.1.3. South America Anthocyanins Revenue (USD Million) by Product (2021-2032)
By Type
Cyanidin
Malvidin
Delphinidin
Peonidin
Others
By Application
Food & Beverage
Pharmaceutical
Personal Care
Animal Feed
Chapter 13. Middle East and Africa Anthocyanins Analysis and Outlook
13.1. Middle East and Africa Anthocyanins Revenue (USD Million), by Segments (2021-2032)
13.1.1. Middle East and Africa Anthocyanins Revenue (USD Million) by Type (2021-2032)
13.1.2. Middle East and Africa Anthocyanins Revenue (USD Million) by Application (2021-2032)
13.1.3. Middle East and Africa Anthocyanins Revenue (USD Million) by Product (2021-2032)
By Type
Cyanidin
Malvidin
Delphinidin
Peonidin
Others
By Application
Food & Beverage
Pharmaceutical
Personal Care
Animal Feed
Chapter 14. Anthocyanins Company Profiles
14.1 Business Overview
14.2 Product Profiles
14.3 SWOT Profiles
14.5 Recent Developments
14.6 Financial Profile
List of Companies
Anthocyanin Naturals India Pvt Ltd
Archer Daniels Midland Company (ADM)
Döhler Group SE
Givaudan SA
GNT Group B.V.
Kalsec Inc
Novozymes A/S
Sensient Technologies Corp
Symrise AG
Synthite Industries Ltd
15. Methodology and Data Sources
15.1 Customization Offerings
15.2 Subscription Services
15.3 Related Reports
15.4 Publisher Expertise
LIST OF TABLES
Table 1 Market Segmentation Analysis
Table 2 Global Anthocyanins Market Share of Leading Companies, 2023
Table 3 Product Offerings of Leading Companies
Table 4 Low Growth Scenario Forecasts
Table 5 Reference Case Growth Scenario
Table 6 High Growth Case Scenario
Table 7 Global Anthocyanins Revenue (USD Million) And CAGR (%) By Type (2021-2032)
Table 8 Global Anthocyanins Revenue (USD Million) And CAGR (%) By Application (2021-2032)
Table 9 Global Anthocyanins Revenue (USD Million) And CAGR (%) By Product (2021-2032)
Table 10 Global Anthocyanins Market Revenue (USD Million) By Regions (2021-2032)
Table 11 Global Anthocyanins Market Share (%) By Regions (2021-2032)
Table 12 North America Anthocyanins Revenue (USD Million) By Country (2021-2032)
Table 13 Europe Anthocyanins Revenue (USD Million) By Country (2021-2032)
Table 14 Asia Pacific Anthocyanins Revenue (USD Million) By Country (2021-2032)
Table 15 South America Anthocyanins Revenue (USD Million) By Country (2021-2032)
Table 16 Middle East and Africa Anthocyanins Revenue (USD Million) By Region (2021-2032)
Table 17 North America Anthocyanins Revenue (USD Million) By Type (2021-2032)
Table 18 North America Anthocyanins Revenue (USD Million) By Application (2021-2032)
Table 19 North America Anthocyanins Revenue (USD Million) By Product (2021-2032)
Table 20 Europe Anthocyanins Revenue (USD Million) By Type (2021-2032)
Table 21 Europe Anthocyanins Revenue (USD Million) By Application (2021-2032)
Table 22 Europe Anthocyanins Revenue (USD Million) By Product (2021-2032)
Table 23 Asia Pacific Anthocyanins Revenue (USD Million) By Type (2021-2032)
Table 24 Asia Pacific Anthocyanins Revenue (USD Million) By Application (2021-2032)
Table 25 Asia Pacific Anthocyanins Revenue (USD Million) By Product (2021-2032)
Table 26 South America Anthocyanins Revenue (USD Million) By Type (2021-2032)
Table 27 South America Anthocyanins Revenue (USD Million) By Application (2021-2032)
Table 28 South America Anthocyanins Revenue (USD Million) By Product (2021-2032)
Table 29 Middle East and Africa Anthocyanins Revenue (USD Million) By Type (2021-2032)
Table 30 Middle East and Africa Anthocyanins Revenue (USD Million) By Application (2021-2032)
Table 31 Middle East and Africa Anthocyanins Revenue (USD Million) By Product (2021-2032)
LIST OF FIGURES
Figure 1. Market Scope
Figure 2. Pricing Forecasts Per Unit, 2023- 2032
Figure 3. Porter’s Five Forces
Figure 4. Global Anthocyanins Market Revenue (USD Million) By Regions (2021-2032)
Figure 5. Global Anthocyanins Market Share (%) By Regions (2023)
Figure 6. North America Anthocyanins Revenue (USD Million) By Country (2021-2032)
Figure 7. United States Anthocyanins Revenue (USD Million) By Country (2021-2032)
Figure 8. Canada Anthocyanins Revenue (USD Million) By Country (2021-2032)
Figure 9. Mexico Anthocyanins Revenue (USD Million) By Country (2021-2032)
Figure 10. Europe Anthocyanins Revenue (USD Million) By Country (2021-2032)
Figure 11. Germany Anthocyanins Revenue (USD Million) By Country (2021-2032)
Figure 12. France Anthocyanins Revenue (USD Million) By Country (2021-2032)
Figure 13. United Kingdom Anthocyanins Revenue (USD Million) By Country (2021-2032)
Figure 14. Spain Anthocyanins Revenue (USD Million) By Country (2021-2032)
Figure 15. Italy Anthocyanins Revenue (USD Million) By Country (2021-2032)
Figure 16. Russia Anthocyanins Revenue (USD Million) By Country (2021-2032)
Figure 17. Rest of Europe Anthocyanins Revenue (USD Million) By Country (2021-2032)
Figure 11. Asia Pacific Anthocyanins Revenue (USD Million) By Country (2021-2032)
Figure 12. China Anthocyanins Revenue (USD Million) By Country (2021-2032)
Figure 13. Japan Anthocyanins Revenue (USD Million) By Country (2021-2032)
Figure 14. India Anthocyanins Revenue (USD Million) By Country (2021-2032)
Figure 15. South Korea Anthocyanins Revenue (USD Million) By Country (2021-2032)
Figure 16. Australia Anthocyanins Revenue (USD Million) By Country (2021-2032)
Figure 17. South East Asia Anthocyanins Revenue (USD Million) By Country (2021-2032)
Figure 18. South America Anthocyanins Revenue (USD Million) By Country (2021-2032)
Figure 19. Brazil Anthocyanins Revenue (USD Million) By Country (2021-2032)
Figure 20. Argentina Anthocyanins Revenue (USD Million) By Country (2021-2032)
Figure 21. Rest of Asia Pacific Anthocyanins Revenue (USD Million) By Country (2021-2032)
Figure 22. Middle East and Africa Anthocyanins Revenue (USD Million) By Region (2021-2032)
Figure 23. Saudi Arabia Anthocyanins Revenue (USD Million) By Region (2021-2032)
Figure 24. The UAE Anthocyanins Revenue (USD Million) By Region (2021-2032)
Figure 25. Rest of Middle East Anthocyanins Revenue (USD Million) By Region (2021-2032)
Figure 26. South Africa Anthocyanins Revenue (USD Million) By Region (2021-2032)
Figure 27. Africa Anthocyanins Revenue (USD Million) By Region (2021-2032)
Figure 28. North America Anthocyanins Revenue (USD Million) By Type (2021-2032)
Figure 29. North America Anthocyanins Revenue (USD Million) By Application (2021-2032)
Figure 30. North America Anthocyanins Revenue (USD Million) By Product (2021-2032)
Figure 31. Europe Anthocyanins Revenue (USD Million) By Type (2021-2032)
Figure 32. Europe Anthocyanins Revenue (USD Million) By Application (2021-2032)
Figure 33. Europe Anthocyanins Revenue (USD Million) By Product (2021-2032)
Figure 34. Asia Pacific Anthocyanins Revenue (USD Million) By Type (2021-2032)
Figure 35. Asia Pacific Anthocyanins Revenue (USD Million) By Application (2021-2032)
Figure 36. Asia Pacific Anthocyanins Revenue (USD Million) By Product (2021-2032)
Figure 37. South America Anthocyanins Revenue (USD Million) By Type (2021-2032)
Figure 38. South America Anthocyanins Revenue (USD Million) By Application (2021-2032)
Figure 39. South America Anthocyanins Revenue (USD Million) By Product (2021-2032)
Figure 40. Middle East and Africa Anthocyanins Revenue (USD Million) By Type (2021-2032)
Figure 41. Middle East and Africa Anthocyanins Revenue (USD Million) By Application (2021-2032)
Figure 42. Middle East and Africa Anthocyanins Revenue (USD Million) By Product (2021-2032)
By Type
Cyanidin
Malvidin
Delphinidin
Peonidin
Others
By Application
Food & Beverage
Pharmaceutical
Personal Care
Animal Feed
Countries Analyzed
North America (US, Canada, Mexico)
Europe (Germany, UK, France, Spain, Italy, Russia, Rest of Europe)
Asia Pacific (China, India, Japan, South Korea, Australia, South East Asia, Rest of Asia)
South America (Brazil, Argentina, Rest of South America)
Middle East and Africa (Saudi Arabia, UAE, Rest of Middle East, South Africa, Egypt, Rest of Africa)
