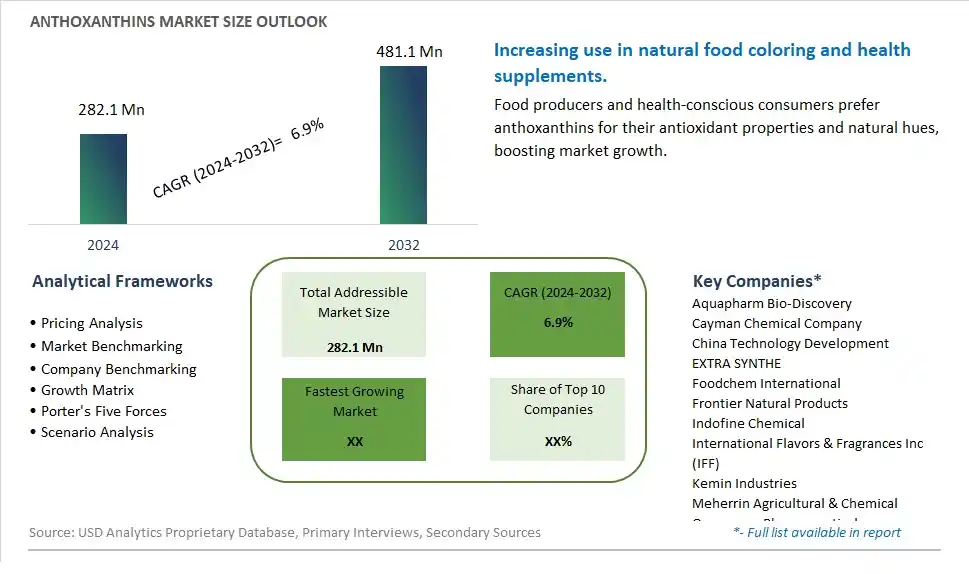
Global Anthoxanthins Market Size is valued at $282.1 Million in 2024 and is forecast to register a growth rate (CAGR) of 6.9% to reach $481.1 Million by 2032.
The global Anthoxanthins Market Comprehensive Study analyzes and forecasts the market size across 6 regions and 24 countries for diverse segments -By Type (Food Grade, Pharmaceutical Grade), By Application (Food and Beverages, Pharmaceutical, Animal Feed Additives, Nutraceuticals, Others)
An Introduction to Anthoxanthins Market
In 2024, the Anthoxanthins market is expanding, driven by their use as natural colorants and bioactive compounds in the food, beverage, and nutraceutical industries. Anthoxanthins, responsible for the yellow and white pigments in plants, are valued for their antioxidant properties and potential health benefits, including anti-inflammatory and cardiovascular protective effects. The market is supported by the increasing demand for natural and plant-based ingredients. Advances in extraction and formulation techniques are improving the stability and efficacy of anthoxanthins. The market is also benefiting from the trend towards clean-label products and the growing interest in functional ingredients that contribute to both health and product appeal.
Anthoxanthins Competitive Landscape
The market report analyses the leading companies in the industry including Aquapharm Bio-Discovery, Cayman Chemical Company, China Technology Development, EXTRA SYNTHE, Foodchem International, Frontier Natural Products, Indofine Chemical, International Flavors & Fragrances Inc (IFF), Kemin Industries, Meherrin Agricultural & Chemical, Quercegen Pharmaceuticals, SV Agrofood, Toroma Organics, and Others.
Anthoxanthins Market Dynamics
Anthoxanthins Market Trend: Growing Preference for Natural Food Additives
The Anthoxanthins market is experiencing a significant trend towards the growing preference for natural food additives. As consumers become increasingly wary of artificial ingredients and their potential health risks, there is a strong shift towards using natural compounds for food coloring and preservation. Anthoxanthins, found in various plant sources like onions, cauliflower, and potatoes, provide natural yellow to creamy white pigmentation and are being embraced for their safety and health benefits. This trend is particularly evident in the clean-label movement, where transparency and natural ingredients are prioritized, driving manufacturers to replace synthetic additives with anthoxanthins.
Anthoxanthins Market Driver: Rising Demand for Functional Foods
A major driver for the Anthoxanthins market is the rising demand for functional foods that offer health benefits beyond basic nutrition. Anthoxanthins, known for their antioxidant and anti-inflammatory properties, are increasingly incorporated into functional foods to enhance their health profiles. The growing awareness of the role of diet in disease prevention and health maintenance is leading consumers to seek out foods that contribute to overall well-being. This demand for functional foods enriched with natural ingredients like anthoxanthins is driving market growth, as manufacturers innovate to meet the health-conscious consumer's needs.
Anthoxanthins Market Opportunity: Expansion in the Cosmetic and Pharmaceutical Industries
Expansion in the cosmetic and pharmaceutical industries presents a substantial opportunity for the Anthoxanthins market. Beyond their application in food products, anthoxanthins are being explored for their potential benefits in skincare and medicinal products due to their antioxidant properties. In cosmetics, they can be used in formulations aimed at reducing inflammation and protecting against oxidative damage, appealing to consumers looking for natural and effective skincare solutions. In pharmaceuticals, anthoxanthins hold promise for developing supplements and treatments that leverage their health benefits. By targeting these industries, manufacturers can diversify their product offerings and tap into new, lucrative markets.
Anthoxanthins Market Share Analysis: Food Grade segment generated the highest revenue share in the industry
The Food Grade segment emerges as the largest in the Anthoxanthins Market, showcasing substantial growth and widespread utilization. Anthoxanthins are a group of plant compounds known for their colorless or pale yellow appearance and are found in various fruits, vegetables, and grains. This segment dominates the market for several reasons. Firstly, the Food Grade anthoxanthins are widely used in the food industry as natural colorants and flavor enhancers. They are particularly favored for their ability to add a subtle yellow hue to food products without altering the taste or texture significantly. Additionally, Food Grade anthoxanthins are preferred by manufacturers seeking clean-label ingredients and natural alternatives to synthetic additives. They are commonly used in a wide range of food applications, including beverages, dairy products, baked goods, and confectionery items. Further, the growing consumer demand for natural and healthy food options has propelled the adoption of Food Grade anthoxanthins in food formulations. With stringent regulations promoting clean-label products and the increasing awareness of the benefits of natural ingredients, the Food Grade segment is poised to maintain its market leadership and experience continuous growth in the Anthoxanthins Market.
Anthoxanthins Market Share Analysis: Nutraceuticals is the fastest growing segment over the forecast period to 2032
The Nutraceuticals segment within the Anthoxanthins Market is poised for rapid growth leading up to 2032. This segment encompasses the use of anthoxanthins in nutraceutical products, which are supplements or functional foods with purported health benefits beyond basic nutrition. The Nutraceuticals segment's accelerated expansion is driven by several key factors. Firstly, there's a growing consumer interest in health and wellness, leading to an increased demand for natural and plant-based ingredients with potential health-promoting properties. Anthoxanthins, such as those found in fruits like lemons and bananas, are recognized for their antioxidant and anti-inflammatory properties, making them attractive ingredients for nutraceutical formulations. Additionally, anthoxanthins have been studied for their potential roles in supporting cardiovascular health, cognitive function, and overall well-being, further driving their incorporation into nutraceutical products. The Nutraceuticals segment also benefits from advancements in extraction technologies and formulation techniques, allowing for the development of innovative and effective anthoxanthin-based nutraceuticals. With the rising consumer awareness of preventive healthcare and the demand for natural solutions, the Nutraceuticals segment is well-positioned to experience significant growth and emerge as a key driver in the Anthoxanthins Market.
Anthoxanthins Market Segmentation
By Type
Food Grade
Pharmaceutical Grade
By Application
Food and Beverages
Pharmaceutical
Animal Feed Additives
Nutraceuticals
Others
Countries Analyzed
North America (US, Canada, Mexico)
Europe (Germany, UK, France, Spain, Italy, Russia, Rest of Europe)
Asia Pacific (China, India, Japan, South Korea, Australia, South East Asia, Rest of Asia)
South America (Brazil, Argentina, Rest of South America)
Middle East and Africa (Saudi Arabia, UAE, Rest of Middle East, South Africa, Egypt, Rest of Africa)
Anthoxanthins Companies Profiled in the Study
Aquapharm Bio-Discovery
Cayman Chemical Company
China Technology Development
EXTRA SYNTHE
Foodchem International
Frontier Natural Products
Indofine Chemical
International Flavors & Fragrances Inc (IFF)
Kemin Industries
Meherrin Agricultural & Chemical
Quercegen Pharmaceuticals
SV Agrofood
Toroma Organics
*- List Not Exhaustive
Chapter 1. TABLE OF CONTENTS
Chapter 2. Introduction to Anthoxanthins Market
2.1. Market Overview
2.2. Key Statistics and Report Highlights
2.3. Scope of the Comprehensive Study
2.3.1. Market Definition
2.3.2 Countries and Regions Covered
2.3.3 Research Objective
2.3.4 Units, Currency, and Conversions
2.3.5 Industry Value Chain
2.4. Key Market Segments
2.5. Key Companies
2.6. Study Period
Chapter 3. Strategic Analysis Review
3.1. Anthoxanthins Pricing Analysis and Forecast
3.2. Porter’s Five Forces
3.3. Market Ecosystem
3.4. SWOT Analysis
3.5. Regulatory Scenario
3.3. Effects of Inflation, Russia-Ukraine War, moderating economic growth, and other macroeconomic factors
Chapter 4. Competitive Landscape
4.1. Market Share Analysis
4.1.1. Global Anthoxanthins Market Share by Company, 2023
4.1.2. Product Offerings of Leading Anthoxanthins Companies
4.2. Market Entropy
4.2.1. New Product Launches in the Industry
4.2.2. Mergers, Acquisitions, Joint ventures, and Partnerships
4.3. Key Strategies and Best Practices
Chapter 5. Global Market Projections: Best, Reference, and Low Case Scenarios
5.1. Growth Analysis- Case Scenario Definitions
5.2. Low Growth Case Scenario Forecasts
5.3. Reference Growth Case Scenario Forecasts
5.4. High Growth Case Scenario Forecasts
Chapter 6. Market Dynamics
6.1. Anthoxanthins Market Drivers
6.2. Anthoxanthins Market Challenges
6.6. Anthoxanthins Market Opportunities
6.4. Anthoxanthins Market Trends
Chapter 7. Global Anthoxanthins Market Outlook Trends
7.1. Global Anthoxanthins Revenue (USD Million) and CAGR (%) by Type (2021-2032)
7.2. Global Anthoxanthins Revenue (USD Million) and CAGR (%) by Application (2021-2032)
7.3. Global Anthoxanthins Revenue (USD Million) and CAGR (%) by Product (2021-2032)
By Type
Food Grade
Pharmaceutical Grade
By Application
Food and Beverages
Pharmaceutical
Animal Feed Additives
Nutraceuticals
Others
Chapter 8. Global Anthoxanthins Regional Analysis and Outlook
8.1. Global Anthoxanthins Revenue (USD Million) By Regions (2021- 2032)
8.2. North America Anthoxanthins Revenue (USD Million) by Country (2021-2032)
8.2.1. United States Anthoxanthins Regional Analysis and Outlook
8.2.2. Canada Anthoxanthins Regional Analysis and Outlook
8.2.3. Mexico Anthoxanthins Regional Analysis and Outlook
8.3. Europe Anthoxanthins Revenue (USD Million), by Country (2021-2032)
8.3.1. Germany Anthoxanthins Regional Analysis and Outlook
8.3.2. France Anthoxanthins Regional Analysis and Outlook
8.3.3. United Kingdom Anthoxanthins Regional Analysis and Outlook
8.3.4. Spain Anthoxanthins Regional Analysis and Outlook
8.3.5. Italy Anthoxanthins Regional Analysis and Outlook
8.3.6. Russia Anthoxanthins Regional Analysis and Outlook
8.3.7. Rest of Europe Anthoxanthins Regional Analysis and Outlook
8.4. Asia Pacific Anthoxanthins Revenue (USD Million) by Country (2021-2032)
8.4.1. China Anthoxanthins Regional Analysis and Outlook
8.4.2. Japan Anthoxanthins Regional Analysis and Outlook
8.4.3. India Anthoxanthins Regional Analysis and Outlook
8.4.4. South Korea Anthoxanthins Regional Analysis and Outlook
8.4.5. Australia Anthoxanthins Regional Analysis and Outlook
8.4.6. South East Asia Anthoxanthins Regional Analysis and Outlook
8.4.7. Rest of Asia Pacific Anthoxanthins Regional Analysis and Outlook
8.5. South America Anthoxanthins Revenue (USD Million), by Country (2021-2032)
8.5.1. Brazil Anthoxanthins Regional Analysis and Outlook
8.5.2. Argentina Anthoxanthins Regional Analysis and Outlook
8.5.3. Rest of South America Anthoxanthins Regional Analysis and Outlook
8.6. Middle East and Africa Anthoxanthins Revenue (USD Million) by Country (2021-2032)
8.6.1. Middle East Anthoxanthins Regional Analysis and Outlook
8.6.2. Africa Anthoxanthins Regional Analysis and Outlook
Chapter 9. North America Anthoxanthins Analysis and Outlook
9.1. North America Anthoxanthins Revenue (USD Million) by Segments (2021-2032)
9.1.1. North America Anthoxanthins Revenue (USD Million) by Type (2021-2032)
9.1.2. North America Anthoxanthins Revenue (USD Million) by Application (2021-2032)
9.1.3. North America Anthoxanthins Revenue (USD Million) by Product (2021-2032)
By Type
Food Grade
Pharmaceutical Grade
By Application
Food and Beverages
Pharmaceutical
Animal Feed Additives
Nutraceuticals
Others
Chapter 10. Europe Anthoxanthins Analysis and Outlook
10.1. Europe Anthoxanthins Revenue (USD Million), by Segments (USD Million) (2021-2032)
10.1.1. Europe Anthoxanthins Revenue (USD Million) by Type (2021-2032)
10.1.2. Europe Anthoxanthins Revenue (USD Million) by Application (2021-2032)
10.1.3. Europe Anthoxanthins Revenue (USD Million) by Product (2021-2032)
By Type
Food Grade
Pharmaceutical Grade
By Application
Food and Beverages
Pharmaceutical
Animal Feed Additives
Nutraceuticals
Others
Chapter 11. Asia Pacific Anthoxanthins Analysis and Outlook
11.1. Asia Pacific Anthoxanthins Revenue (USD Million), and Revenue (USD Million) by Segments (2021-2032)
11.1.1. Asia Pacific Anthoxanthins Revenue (USD Million) by Type (2021-2032)
11.1.2. Asia Pacific Anthoxanthins Revenue (USD Million) by Application (2021-2032)
11.1.3. Asia Pacific Anthoxanthins Revenue (USD Million) by Product (2021-2032)
By Type
Food Grade
Pharmaceutical Grade
By Application
Food and Beverages
Pharmaceutical
Animal Feed Additives
Nutraceuticals
Others
Chapter 12. South America Anthoxanthins Analysis and Outlook
12.1. South America Anthoxanthins Revenue (USD Million), by Segments (2021-2032)
12.1.1. South America Anthoxanthins Revenue (USD Million) by Type (2021-2032)
12.1.2. South America Anthoxanthins Revenue (USD Million) by Application (2021-2032)
12.1.3. South America Anthoxanthins Revenue (USD Million) by Product (2021-2032)
By Type
Food Grade
Pharmaceutical Grade
By Application
Food and Beverages
Pharmaceutical
Animal Feed Additives
Nutraceuticals
Others
Chapter 13. Middle East and Africa Anthoxanthins Analysis and Outlook
13.1. Middle East and Africa Anthoxanthins Revenue (USD Million), by Segments (2021-2032)
13.1.1. Middle East and Africa Anthoxanthins Revenue (USD Million) by Type (2021-2032)
13.1.2. Middle East and Africa Anthoxanthins Revenue (USD Million) by Application (2021-2032)
13.1.3. Middle East and Africa Anthoxanthins Revenue (USD Million) by Product (2021-2032)
By Type
Food Grade
Pharmaceutical Grade
By Application
Food and Beverages
Pharmaceutical
Animal Feed Additives
Nutraceuticals
Others
Chapter 14. Anthoxanthins Company Profiles
14.1 Business Overview
14.2 Product Profiles
14.3 SWOT Profiles
14.5 Recent Developments
14.6 Financial Profile
List of Companies
Aquapharm Bio-Discovery
Cayman Chemical Company
China Technology Development
EXTRA SYNTHE
Foodchem International
Frontier Natural Products
Indofine Chemical
International Flavors & Fragrances Inc (IFF)
Kemin Industries
Meherrin Agricultural & Chemical
Quercegen Pharmaceuticals
SV Agrofood
Toroma Organics
15. Methodology and Data Sources
15.1 Customization Offerings
15.2 Subscription Services
15.3 Related Reports
15.4 Publisher Expertise
LIST OF TABLES
Table 1 Market Segmentation Analysis
Table 2 Global Anthoxanthins Market Share of Leading Companies, 2023
Table 3 Product Offerings of Leading Companies
Table 4 Low Growth Scenario Forecasts
Table 5 Reference Case Growth Scenario
Table 6 High Growth Case Scenario
Table 7 Global Anthoxanthins Revenue (USD Million) And CAGR (%) By Type (2021-2032)
Table 8 Global Anthoxanthins Revenue (USD Million) And CAGR (%) By Application (2021-2032)
Table 9 Global Anthoxanthins Revenue (USD Million) And CAGR (%) By Product (2021-2032)
Table 10 Global Anthoxanthins Market Revenue (USD Million) By Regions (2021-2032)
Table 11 Global Anthoxanthins Market Share (%) By Regions (2021-2032)
Table 12 North America Anthoxanthins Revenue (USD Million) By Country (2021-2032)
Table 13 Europe Anthoxanthins Revenue (USD Million) By Country (2021-2032)
Table 14 Asia Pacific Anthoxanthins Revenue (USD Million) By Country (2021-2032)
Table 15 South America Anthoxanthins Revenue (USD Million) By Country (2021-2032)
Table 16 Middle East and Africa Anthoxanthins Revenue (USD Million) By Region (2021-2032)
Table 17 North America Anthoxanthins Revenue (USD Million) By Type (2021-2032)
Table 18 North America Anthoxanthins Revenue (USD Million) By Application (2021-2032)
Table 19 North America Anthoxanthins Revenue (USD Million) By Product (2021-2032)
Table 20 Europe Anthoxanthins Revenue (USD Million) By Type (2021-2032)
Table 21 Europe Anthoxanthins Revenue (USD Million) By Application (2021-2032)
Table 22 Europe Anthoxanthins Revenue (USD Million) By Product (2021-2032)
Table 23 Asia Pacific Anthoxanthins Revenue (USD Million) By Type (2021-2032)
Table 24 Asia Pacific Anthoxanthins Revenue (USD Million) By Application (2021-2032)
Table 25 Asia Pacific Anthoxanthins Revenue (USD Million) By Product (2021-2032)
Table 26 South America Anthoxanthins Revenue (USD Million) By Type (2021-2032)
Table 27 South America Anthoxanthins Revenue (USD Million) By Application (2021-2032)
Table 28 South America Anthoxanthins Revenue (USD Million) By Product (2021-2032)
Table 29 Middle East and Africa Anthoxanthins Revenue (USD Million) By Type (2021-2032)
Table 30 Middle East and Africa Anthoxanthins Revenue (USD Million) By Application (2021-2032)
Table 31 Middle East and Africa Anthoxanthins Revenue (USD Million) By Product (2021-2032)
LIST OF FIGURES
Figure 1. Market Scope
Figure 2. Pricing Forecasts Per Unit, 2023- 2032
Figure 3. Porter’s Five Forces
Figure 4. Global Anthoxanthins Market Revenue (USD Million) By Regions (2021-2032)
Figure 5. Global Anthoxanthins Market Share (%) By Regions (2023)
Figure 6. North America Anthoxanthins Revenue (USD Million) By Country (2021-2032)
Figure 7. United States Anthoxanthins Revenue (USD Million) By Country (2021-2032)
Figure 8. Canada Anthoxanthins Revenue (USD Million) By Country (2021-2032)
Figure 9. Mexico Anthoxanthins Revenue (USD Million) By Country (2021-2032)
Figure 10. Europe Anthoxanthins Revenue (USD Million) By Country (2021-2032)
Figure 11. Germany Anthoxanthins Revenue (USD Million) By Country (2021-2032)
Figure 12. France Anthoxanthins Revenue (USD Million) By Country (2021-2032)
Figure 13. United Kingdom Anthoxanthins Revenue (USD Million) By Country (2021-2032)
Figure 14. Spain Anthoxanthins Revenue (USD Million) By Country (2021-2032)
Figure 15. Italy Anthoxanthins Revenue (USD Million) By Country (2021-2032)
Figure 16. Russia Anthoxanthins Revenue (USD Million) By Country (2021-2032)
Figure 17. Rest of Europe Anthoxanthins Revenue (USD Million) By Country (2021-2032)
Figure 11. Asia Pacific Anthoxanthins Revenue (USD Million) By Country (2021-2032)
Figure 12. China Anthoxanthins Revenue (USD Million) By Country (2021-2032)
Figure 13. Japan Anthoxanthins Revenue (USD Million) By Country (2021-2032)
Figure 14. India Anthoxanthins Revenue (USD Million) By Country (2021-2032)
Figure 15. South Korea Anthoxanthins Revenue (USD Million) By Country (2021-2032)
Figure 16. Australia Anthoxanthins Revenue (USD Million) By Country (2021-2032)
Figure 17. South East Asia Anthoxanthins Revenue (USD Million) By Country (2021-2032)
Figure 18. South America Anthoxanthins Revenue (USD Million) By Country (2021-2032)
Figure 19. Brazil Anthoxanthins Revenue (USD Million) By Country (2021-2032)
Figure 20. Argentina Anthoxanthins Revenue (USD Million) By Country (2021-2032)
Figure 21. Rest of Asia Pacific Anthoxanthins Revenue (USD Million) By Country (2021-2032)
Figure 22. Middle East and Africa Anthoxanthins Revenue (USD Million) By Region (2021-2032)
Figure 23. Saudi Arabia Anthoxanthins Revenue (USD Million) By Region (2021-2032)
Figure 24. The UAE Anthoxanthins Revenue (USD Million) By Region (2021-2032)
Figure 25. Rest of Middle East Anthoxanthins Revenue (USD Million) By Region (2021-2032)
Figure 26. South Africa Anthoxanthins Revenue (USD Million) By Region (2021-2032)
Figure 27. Africa Anthoxanthins Revenue (USD Million) By Region (2021-2032)
Figure 28. North America Anthoxanthins Revenue (USD Million) By Type (2021-2032)
Figure 29. North America Anthoxanthins Revenue (USD Million) By Application (2021-2032)
Figure 30. North America Anthoxanthins Revenue (USD Million) By Product (2021-2032)
Figure 31. Europe Anthoxanthins Revenue (USD Million) By Type (2021-2032)
Figure 32. Europe Anthoxanthins Revenue (USD Million) By Application (2021-2032)
Figure 33. Europe Anthoxanthins Revenue (USD Million) By Product (2021-2032)
Figure 34. Asia Pacific Anthoxanthins Revenue (USD Million) By Type (2021-2032)
Figure 35. Asia Pacific Anthoxanthins Revenue (USD Million) By Application (2021-2032)
Figure 36. Asia Pacific Anthoxanthins Revenue (USD Million) By Product (2021-2032)
Figure 37. South America Anthoxanthins Revenue (USD Million) By Type (2021-2032)
Figure 38. South America Anthoxanthins Revenue (USD Million) By Application (2021-2032)
Figure 39. South America Anthoxanthins Revenue (USD Million) By Product (2021-2032)
Figure 40. Middle East and Africa Anthoxanthins Revenue (USD Million) By Type (2021-2032)
Figure 41. Middle East and Africa Anthoxanthins Revenue (USD Million) By Application (2021-2032)
Figure 42. Middle East and Africa Anthoxanthins Revenue (USD Million) By Product (2021-2032)
By Type
Food Grade
Pharmaceutical Grade
By Application
Food and Beverages
Pharmaceutical
Animal Feed Additives
Nutraceuticals
Others
Countries Analyzed
North America (US, Canada, Mexico)
Europe (Germany, UK, France, Spain, Italy, Russia, Rest of Europe)
Asia Pacific (China, India, Japan, South Korea, Australia, South East Asia, Rest of Asia)
South America (Brazil, Argentina, Rest of South America)
Middle East and Africa (Saudi Arabia, UAE, Rest of Middle East, South Africa, Egypt, Rest of Africa)
