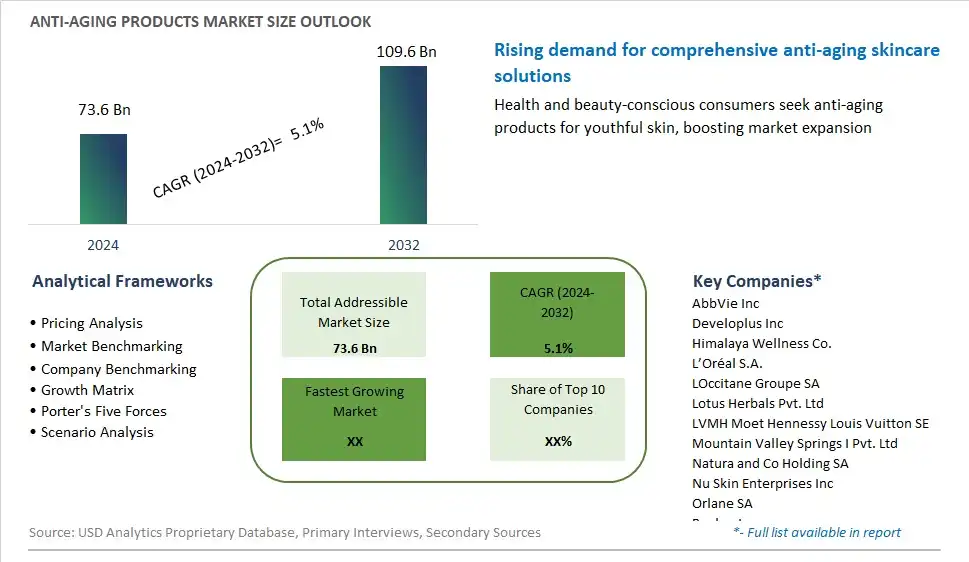
Global Anti-Aging Products Market Size is valued at $73.6 Billion in 2024 and is forecast to register a growth rate (CAGR) of 5.1% to reach $109.6 Billion by 2032.
The global Anti-Aging Products Market Comprehensive Study analyzes and forecasts the market size across 6 regions and 24 countries for diverse segments -By End-User (Skincare, Hair care, Others), By Distribution Channel (Supermarkets/Hypermarkets, Online, Drug stores, Specialty stores)
An Introduction to Anti-Aging Products Market
The Anti-Aging Products Market focuses on the production and sale of skincare and personal care products designed to reduce the signs of aging, such as wrinkles, fine lines, and age spots. These products include creams, serums, masks, and supplements enriched with anti-aging ingredients like retinol, hyaluronic acid, and antioxidants. The market is driven by the increasing aging population, rising consumer demand for youthful appearance, and advancements in anti-aging formulations. Additionally, growing awareness about skincare and the expansion of the beauty and personal care industry support market growth.
Anti Aging Products Competitive Landscape
The market report analyses the leading companies in the industry including AbbVie Inc, Developlus Inc, Himalaya Wellness Co., L’Oréal S.A., LOccitane Groupe SA, Lotus Herbals Pvt. Ltd, LVMH Moet Hennessy Louis Vuitton SE, Mountain Valley Springs I Pvt. Ltd, Natura and Co Holding SA, Nu Skin Enterprises Inc, Orlane SA, Revlon Inc, The Estee Lauder Companies Inc, The Procter & Gamble Company (P&G), Unilever Plc, and Others.
Anti Aging Products Market Dynamics
Market Trend: Rise of Personalized Skincare
The most prominent trend in the Anti-Aging Products Market is the rise of personalized skincare. Consumers are increasingly seeking products that are tailored to their specific skin types and concerns. This trend is driven by advancements in technology and a better understanding of individual skin needs. Personalized skincare products, which are formulated based on genetic testing, skin analysis, and lifestyle factors, are gaining popularity as they offer more effective and targeted solutions for anti-aging
Market Driver: Increasing Consumer Awareness
Increasing consumer awareness about the signs of aging and the benefits of early intervention is a major driver of the Anti-Aging Products Market. With more information available through digital media, consumers are becoming proactive in their approach to skincare. They are investing in products that promise to prevent or reduce the appearance of fine lines, wrinkles, and age spots. This growing awareness and the desire to maintain youthful skin are driving the demand for a wide range of anti-aging products
Market Opportunity: Expansion into Emerging Markets
A significant opportunity in the Anti-Aging Products Market lies in the expansion into emerging markets. Regions such as Asia-Pacific and Latin America are experiencing rapid economic growth and an increasing middle-class population. As disposable incomes rise, consumers in these markets are becoming more interested in premium skincare products, including anti-aging solutions. By targeting these emerging markets with products that cater to local preferences and needs, companies can tap into a large and growing consumer base
Largest Segment in the Anti-Aging Products Market by End-User- Skincare
The skincare segment is the largest segment in the Anti-Aging Products Market by end-user. Skincare products are highly popular among consumers seeking to address signs of aging, such as wrinkles, fine lines, and age spots, and to maintain a youthful appearance. The demand for anti-aging skincare products is driven by the increasing focus on skin health and the growing awareness of the benefits of proactive skincare. Additionally, advancements in skincare formulations and the inclusion of active ingredients, such as retinoids, peptides, and antioxidants, enhance the efficacy of anti-aging products, further boosting their popularity. The expansion of product offerings and the increasing availability of anti-aging skincare products in various retail channels support the dominance of the skincare segment.
Fastest Growing Segment in the Anti-Aging Products Market by Distribution Channel- Online
The online distribution channel is expected to be the fastest-growing segment in the Anti-Aging Products Market by distribution channel over the next 10 years. The convenience and accessibility of online shopping, combined with the growing consumer preference for e-commerce, drive the rapid growth of this segment. Online platforms offer a wide variety of anti-aging products, detailed product descriptions, and customer reviews, making it easier for consumers to make informed purchasing decisions. The COVID-19 pandemic has further accelerated the shift towards online shopping, as consumers seek contactless and convenient ways to purchase their favorite products. Subscription services and direct-to-consumer models also contribute to the segment's expansion, providing consumers with regular deliveries of their preferred anti-aging products.
Anti Aging Products Market Segmentation
By End-User
Skincare
Hair care
Others
By Distribution Channel
Supermarkets/Hypermarkets
Online
Drug stores
Specialty stores
Countries Analyzed
North America (US, Canada, Mexico)
Europe (Germany, UK, France, Spain, Italy, Russia, Rest of Europe)
Asia Pacific (China, India, Japan, South Korea, Australia, South East Asia, Rest of Asia)
South America (Brazil, Argentina, Rest of South America)
Middle East and Africa (Saudi Arabia, UAE, Rest of Middle East, South Africa, Egypt, Rest of Africa)
Anti Aging Products Companies Profiled in the Study
AbbVie Inc
Developlus Inc
Himalaya Wellness Co.
L’Oréal S.A.
LOccitane Groupe SA
Lotus Herbals Pvt. Ltd
LVMH Moet Hennessy Louis Vuitton SE
Mountain Valley Springs I Pvt. Ltd
Natura and Co Holding SA
Nu Skin Enterprises Inc
Orlane SA
Revlon Inc
The Estee Lauder Companies Inc
The Procter & Gamble Company (P&G)
Unilever Plc
*- List Not Exhaustive
Chapter 1. TABLE OF CONTENTS
Chapter 2. Introduction to Anti Aging Products Market
2.1. Market Overview
2.2. Key Statistics and Report Highlights
2.3. Scope of the Comprehensive Study
2.3.1. Market Definition
2.3.2 Countries and Regions Covered
2.3.3 Research Objective
2.3.4 Units, Currency, and Conversions
2.3.5 Industry Value Chain
2.4. Key Market Segments
2.5. Key Companies
2.6. Study Period
Chapter 3. Strategic Analysis Review
3.1. Anti Aging Products Pricing Analysis and Forecast
3.2. Porter’s Five Forces
3.3. Market Ecosystem
3.4. SWOT Analysis
3.5. Regulatory Scenario
3.3. Effects of Inflation, Russia-Ukraine War, moderating economic growth, and other macroeconomic factors
Chapter 4. Competitive Landscape
4.1. Market Share Analysis
4.1.1. Global Anti Aging Products Market Share by Company, 2023
4.1.2. Product Offerings of Leading Anti Aging Products Companies
4.2. Market Entropy
4.2.1. New Product Launches in the Industry
4.2.2. Mergers, Acquisitions, Joint ventures, and Partnerships
4.3. Key Strategies and Best Practices
Chapter 5. Global Market Projections: Best, Reference, and Low Case Scenarios
5.1. Growth Analysis- Case Scenario Definitions
5.2. Low Growth Case Scenario Forecasts
5.3. Reference Growth Case Scenario Forecasts
5.4. High Growth Case Scenario Forecasts
Chapter 6. Market Dynamics
6.1. Anti Aging Products Market Drivers
6.2. Anti Aging Products Market Challenges
6.6. Anti Aging Products Market Opportunities
6.4. Anti Aging Products Market Trends
Chapter 7. Global Anti Aging Products Market Outlook Trends
7.1. Global Anti Aging Products Revenue (USD Million) and CAGR (%) by Type (2021-2032)
7.2. Global Anti Aging Products Revenue (USD Million) and CAGR (%) by Application (2021-2032)
7.3. Global Anti Aging Products Revenue (USD Million) and CAGR (%) by Product (2021-2032)
By End-User
Skincare
Hair care
Others
By Distribution Channel
Supermarkets/Hypermarkets
Online
Drug stores
Specialty stores
Chapter 8. Global Anti Aging Products Regional Analysis and Outlook
8.1. Global Anti Aging Products Revenue (USD Million) By Regions (2021- 2032)
8.2. North America Anti Aging Products Revenue (USD Million) by Country (2021-2032)
8.2.1. United States Anti Aging Products Regional Analysis and Outlook
8.2.2. Canada Anti Aging Products Regional Analysis and Outlook
8.2.3. Mexico Anti Aging Products Regional Analysis and Outlook
8.3. Europe Anti Aging Products Revenue (USD Million), by Country (2021-2032)
8.3.1. Germany Anti Aging Products Regional Analysis and Outlook
8.3.2. France Anti Aging Products Regional Analysis and Outlook
8.3.3. United Kingdom Anti Aging Products Regional Analysis and Outlook
8.3.4. Spain Anti Aging Products Regional Analysis and Outlook
8.3.5. Italy Anti Aging Products Regional Analysis and Outlook
8.3.6. Russia Anti Aging Products Regional Analysis and Outlook
8.3.7. Rest of Europe Anti Aging Products Regional Analysis and Outlook
8.4. Asia Pacific Anti Aging Products Revenue (USD Million) by Country (2021-2032)
8.4.1. China Anti Aging Products Regional Analysis and Outlook
8.4.2. Japan Anti Aging Products Regional Analysis and Outlook
8.4.3. India Anti Aging Products Regional Analysis and Outlook
8.4.4. South Korea Anti Aging Products Regional Analysis and Outlook
8.4.5. Australia Anti Aging Products Regional Analysis and Outlook
8.4.6. South East Asia Anti Aging Products Regional Analysis and Outlook
8.4.7. Rest of Asia Pacific Anti Aging Products Regional Analysis and Outlook
8.5. South America Anti Aging Products Revenue (USD Million), by Country (2021-2032)
8.5.1. Brazil Anti Aging Products Regional Analysis and Outlook
8.5.2. Argentina Anti Aging Products Regional Analysis and Outlook
8.5.3. Rest of South America Anti Aging Products Regional Analysis and Outlook
8.6. Middle East and Africa Anti Aging Products Revenue (USD Million) by Country (2021-2032)
8.6.1. Middle East Anti Aging Products Regional Analysis and Outlook
8.6.2. Africa Anti Aging Products Regional Analysis and Outlook
Chapter 9. North America Anti Aging Products Analysis and Outlook
9.1. North America Anti Aging Products Revenue (USD Million) by Segments (2021-2032)
9.1.1. North America Anti Aging Products Revenue (USD Million) by Type (2021-2032)
9.1.2. North America Anti Aging Products Revenue (USD Million) by Application (2021-2032)
9.1.3. North America Anti Aging Products Revenue (USD Million) by Product (2021-2032)
By End-User
Skincare
Hair care
Others
By Distribution Channel
Supermarkets/Hypermarkets
Online
Drug stores
Specialty stores
Chapter 10. Europe Anti Aging Products Analysis and Outlook
10.1. Europe Anti Aging Products Revenue (USD Million), by Segments (USD Million) (2021-2032)
10.1.1. Europe Anti Aging Products Revenue (USD Million) by Type (2021-2032)
10.1.2. Europe Anti Aging Products Revenue (USD Million) by Application (2021-2032)
10.1.3. Europe Anti Aging Products Revenue (USD Million) by Product (2021-2032)
By End-User
Skincare
Hair care
Others
By Distribution Channel
Supermarkets/Hypermarkets
Online
Drug stores
Specialty stores
Chapter 11. Asia Pacific Anti Aging Products Analysis and Outlook
11.1. Asia Pacific Anti Aging Products Revenue (USD Million), and Revenue (USD Million) by Segments (2021-2032)
11.1.1. Asia Pacific Anti Aging Products Revenue (USD Million) by Type (2021-2032)
11.1.2. Asia Pacific Anti Aging Products Revenue (USD Million) by Application (2021-2032)
11.1.3. Asia Pacific Anti Aging Products Revenue (USD Million) by Product (2021-2032)
By End-User
Skincare
Hair care
Others
By Distribution Channel
Supermarkets/Hypermarkets
Online
Drug stores
Specialty stores
Chapter 12. South America Anti Aging Products Analysis and Outlook
12.1. South America Anti Aging Products Revenue (USD Million), by Segments (2021-2032)
12.1.1. South America Anti Aging Products Revenue (USD Million) by Type (2021-2032)
12.1.2. South America Anti Aging Products Revenue (USD Million) by Application (2021-2032)
12.1.3. South America Anti Aging Products Revenue (USD Million) by Product (2021-2032)
By End-User
Skincare
Hair care
Others
By Distribution Channel
Supermarkets/Hypermarkets
Online
Drug stores
Specialty stores
Chapter 13. Middle East and Africa Anti Aging Products Analysis and Outlook
13.1. Middle East and Africa Anti Aging Products Revenue (USD Million), by Segments (2021-2032)
13.1.1. Middle East and Africa Anti Aging Products Revenue (USD Million) by Type (2021-2032)
13.1.2. Middle East and Africa Anti Aging Products Revenue (USD Million) by Application (2021-2032)
13.1.3. Middle East and Africa Anti Aging Products Revenue (USD Million) by Product (2021-2032)
By End-User
Skincare
Hair care
Others
By Distribution Channel
Supermarkets/Hypermarkets
Online
Drug stores
Specialty stores
Chapter 14. Anti Aging Products Company Profiles
14.1 Business Overview
14.2 Product Profiles
14.3 SWOT Profiles
14.5 Recent Developments
14.6 Financial Profile
List of Companies
AbbVie Inc
Developlus Inc
Himalaya Wellness Co.
L’Oréal S.A.
LOccitane Groupe SA
Lotus Herbals Pvt. Ltd
LVMH Moet Hennessy Louis Vuitton SE
Mountain Valley Springs I Pvt. Ltd
Natura and Co Holding SA
Nu Skin Enterprises Inc
Orlane SA
Revlon Inc
The Estee Lauder Companies Inc
The Procter & Gamble Company (P&G)
Unilever Plc
15. Methodology and Data Sources
15.1 Customization Offerings
15.2 Subscription Services
15.3 Related Reports
15.4 Publisher Expertise
LIST OF TABLES
Table 1 Market Segmentation Analysis
Table 2 Global Anti Aging Products Market Share of Leading Companies, 2023
Table 3 Product Offerings of Leading Companies
Table 4 Low Growth Scenario Forecasts
Table 5 Reference Case Growth Scenario
Table 6 High Growth Case Scenario
Table 7 Global Anti Aging Products Revenue (USD Million) And CAGR (%) By Type (2021-2032)
Table 8 Global Anti Aging Products Revenue (USD Million) And CAGR (%) By Application (2021-2032)
Table 9 Global Anti Aging Products Revenue (USD Million) And CAGR (%) By Product (2021-2032)
Table 10 Global Anti Aging Products Market Revenue (USD Million) By Regions (2021-2032)
Table 11 Global Anti Aging Products Market Share (%) By Regions (2021-2032)
Table 12 North America Anti Aging Products Revenue (USD Million) By Country (2021-2032)
Table 13 Europe Anti Aging Products Revenue (USD Million) By Country (2021-2032)
Table 14 Asia Pacific Anti Aging Products Revenue (USD Million) By Country (2021-2032)
Table 15 South America Anti Aging Products Revenue (USD Million) By Country (2021-2032)
Table 16 Middle East and Africa Anti Aging Products Revenue (USD Million) By Region (2021-2032)
Table 17 North America Anti Aging Products Revenue (USD Million) By Type (2021-2032)
Table 18 North America Anti Aging Products Revenue (USD Million) By Application (2021-2032)
Table 19 North America Anti Aging Products Revenue (USD Million) By Product (2021-2032)
Table 20 Europe Anti Aging Products Revenue (USD Million) By Type (2021-2032)
Table 21 Europe Anti Aging Products Revenue (USD Million) By Application (2021-2032)
Table 22 Europe Anti Aging Products Revenue (USD Million) By Product (2021-2032)
Table 23 Asia Pacific Anti Aging Products Revenue (USD Million) By Type (2021-2032)
Table 24 Asia Pacific Anti Aging Products Revenue (USD Million) By Application (2021-2032)
Table 25 Asia Pacific Anti Aging Products Revenue (USD Million) By Product (2021-2032)
Table 26 South America Anti Aging Products Revenue (USD Million) By Type (2021-2032)
Table 27 South America Anti Aging Products Revenue (USD Million) By Application (2021-2032)
Table 28 South America Anti Aging Products Revenue (USD Million) By Product (2021-2032)
Table 29 Middle East and Africa Anti Aging Products Revenue (USD Million) By Type (2021-2032)
Table 30 Middle East and Africa Anti Aging Products Revenue (USD Million) By Application (2021-2032)
Table 31 Middle East and Africa Anti Aging Products Revenue (USD Million) By Product (2021-2032)
LIST OF FIGURES
Figure 1. Market Scope
Figure 2. Pricing Forecasts Per Unit, 2023- 2032
Figure 3. Porter’s Five Forces
Figure 4. Global Anti Aging Products Market Revenue (USD Million) By Regions (2021-2032)
Figure 5. Global Anti Aging Products Market Share (%) By Regions (2023)
Figure 6. North America Anti Aging Products Revenue (USD Million) By Country (2021-2032)
Figure 7. United States Anti Aging Products Revenue (USD Million) By Country (2021-2032)
Figure 8. Canada Anti Aging Products Revenue (USD Million) By Country (2021-2032)
Figure 9. Mexico Anti Aging Products Revenue (USD Million) By Country (2021-2032)
Figure 10. Europe Anti Aging Products Revenue (USD Million) By Country (2021-2032)
Figure 11. Germany Anti Aging Products Revenue (USD Million) By Country (2021-2032)
Figure 12. France Anti Aging Products Revenue (USD Million) By Country (2021-2032)
Figure 13. United Kingdom Anti Aging Products Revenue (USD Million) By Country (2021-2032)
Figure 14. Spain Anti Aging Products Revenue (USD Million) By Country (2021-2032)
Figure 15. Italy Anti Aging Products Revenue (USD Million) By Country (2021-2032)
Figure 16. Russia Anti Aging Products Revenue (USD Million) By Country (2021-2032)
Figure 17. Rest of Europe Anti Aging Products Revenue (USD Million) By Country (2021-2032)
Figure 11. Asia Pacific Anti Aging Products Revenue (USD Million) By Country (2021-2032)
Figure 12. China Anti Aging Products Revenue (USD Million) By Country (2021-2032)
Figure 13. Japan Anti Aging Products Revenue (USD Million) By Country (2021-2032)
Figure 14. India Anti Aging Products Revenue (USD Million) By Country (2021-2032)
Figure 15. South Korea Anti Aging Products Revenue (USD Million) By Country (2021-2032)
Figure 16. Australia Anti Aging Products Revenue (USD Million) By Country (2021-2032)
Figure 17. South East Asia Anti Aging Products Revenue (USD Million) By Country (2021-2032)
Figure 18. South America Anti Aging Products Revenue (USD Million) By Country (2021-2032)
Figure 19. Brazil Anti Aging Products Revenue (USD Million) By Country (2021-2032)
Figure 20. Argentina Anti Aging Products Revenue (USD Million) By Country (2021-2032)
Figure 21. Rest of Asia Pacific Anti Aging Products Revenue (USD Million) By Country (2021-2032)
Figure 22. Middle East and Africa Anti Aging Products Revenue (USD Million) By Region (2021-2032)
Figure 23. Saudi Arabia Anti Aging Products Revenue (USD Million) By Region (2021-2032)
Figure 24. The UAE Anti Aging Products Revenue (USD Million) By Region (2021-2032)
Figure 25. Rest of Middle East Anti Aging Products Revenue (USD Million) By Region (2021-2032)
Figure 26. South Africa Anti Aging Products Revenue (USD Million) By Region (2021-2032)
Figure 27. Africa Anti Aging Products Revenue (USD Million) By Region (2021-2032)
Figure 28. North America Anti Aging Products Revenue (USD Million) By Type (2021-2032)
Figure 29. North America Anti Aging Products Revenue (USD Million) By Application (2021-2032)
Figure 30. North America Anti Aging Products Revenue (USD Million) By Product (2021-2032)
Figure 31. Europe Anti Aging Products Revenue (USD Million) By Type (2021-2032)
Figure 32. Europe Anti Aging Products Revenue (USD Million) By Application (2021-2032)
Figure 33. Europe Anti Aging Products Revenue (USD Million) By Product (2021-2032)
Figure 34. Asia Pacific Anti Aging Products Revenue (USD Million) By Type (2021-2032)
Figure 35. Asia Pacific Anti Aging Products Revenue (USD Million) By Application (2021-2032)
Figure 36. Asia Pacific Anti Aging Products Revenue (USD Million) By Product (2021-2032)
Figure 37. South America Anti Aging Products Revenue (USD Million) By Type (2021-2032)
Figure 38. South America Anti Aging Products Revenue (USD Million) By Application (2021-2032)
Figure 39. South America Anti Aging Products Revenue (USD Million) By Product (2021-2032)
Figure 40. Middle East and Africa Anti Aging Products Revenue (USD Million) By Type (2021-2032)
Figure 41. Middle East and Africa Anti Aging Products Revenue (USD Million) By Application (2021-2032)
Figure 42. Middle East and Africa Anti Aging Products Revenue (USD Million) By Product (2021-2032)
By End-User
Skincare
Hair care
Others
By Distribution Channel
Supermarkets/Hypermarkets
Online
Drug stores
Specialty stores
Countries Analyzed
North America (US, Canada, Mexico)
Europe (Germany, UK, France, Spain, Italy, Russia, Rest of Europe)
Asia Pacific (China, India, Japan, South Korea, Australia, South East Asia, Rest of Asia)
South America (Brazil, Argentina, Rest of South America)
Middle East and Africa (Saudi Arabia, UAE, Rest of Middle East, South Africa, Egypt, Rest of Africa)
