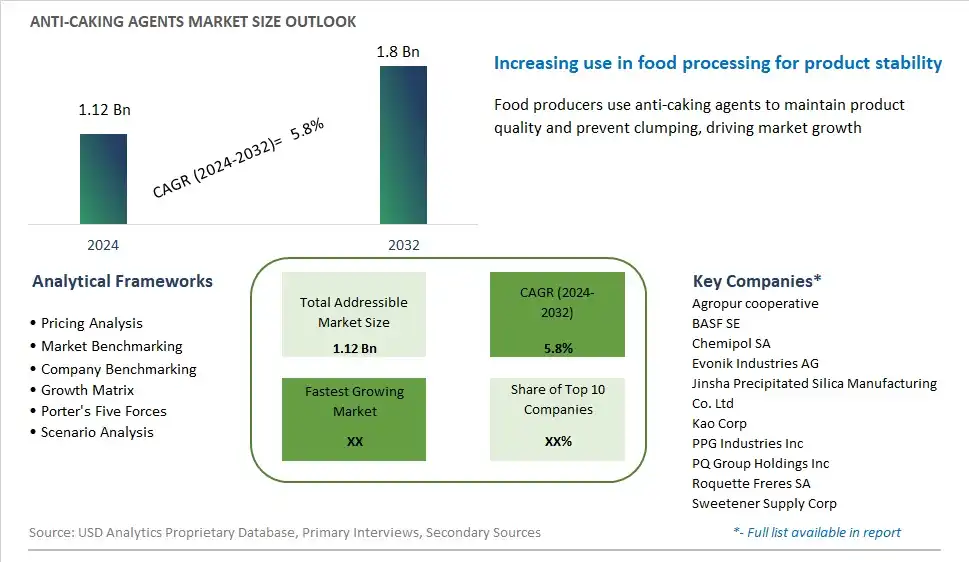
Global Anti-Caking Agents Market Size is valued at $1.12 Billion in 2024 and is forecast to register a growth rate (CAGR) of 5.8% to reach $1.8 Billion by 2032.
The global Anti-Caking Agents Market Comprehensive Study analyzes and forecasts the market size across 6 regions and 24 countries for diverse segments -By Source (Natural, Synthetic), By Type (Calcium Compounds, Sodium Compounds, Others), By Application (Bakery, Seasonings and Condiments, Others, Dairy)
An Introduction to Anti-Caking Agents Market
The Anti-Caking Agents Market involves the production and sale of additives used to prevent clumping and improve the flowability of powdered and granulated products. These agents are widely used in the food, pharmaceutical, and chemical industries. The market is driven by the increasing demand for convenience foods, rising use of powdered products, and advancements in food processing technologies. Additionally, stringent quality standards and the growth of various end-use industries support market growth.
Anti Caking Agents Competitive Landscape
The market report analyses the leading companies in the industry including Agropur cooperative, BASF SE, Chemipol SA, Evonik Industries AG, Jinsha Precipitated Silica Manufacturing Co. Ltd, Kao Corp, PPG Industries Inc, PQ Group Holdings Inc, Roquette Freres SA, Sweetener Supply Corp, and Others.
Anti Caking Agents Market Dynamics
Market Trend: Increasing Demand for Processed Foods
The most prominent trend in the Anti-Caking Agents Market is the increasing demand for processed foods. As consumers seek convenience and longer shelf life in their food products, the use of anti-caking agents in food processing is rising. This trend is driven by the growing popularity of ready-to-eat meals, snacks, and other processed food items. Anti-caking agents help maintain the free-flowing properties of powdered and granulated foods, ensuring product quality and consistency
Market Driver: Growth of the Food and Beverage Industry
The growth of the food and beverage industry is a major driver of the Anti-Caking Agents Market. As the industry expands, there is an increasing need for ingredients that enhance product stability and shelf life. Anti-caking agents are essential in preventing clumping and ensuring the smooth texture of a wide range of food products. The ongoing innovation and development in the food and beverage sector are driving the demand for effective anti-caking solutions
Market Opportunity: Development of Natural Anti-Caking Agents
A significant opportunity in the Anti-Caking Agents Market lies in the development of natural anti-caking agents. With the growing consumer preference for clean label products, there is a rising demand for food ingredients that are free from synthetic additives. Companies can capitalize on this trend by developing anti-caking agents derived from natural sources, such as plant extracts and minerals. By offering natural alternatives, companies can meet consumer demand for healthier and more transparent food products
Anti-Caking Agents Market Share Analysis: Source (Natural, Synthetic)
The natural segment is expected to be the fastest-growing in the Anti-Caking Agents Market by source to 2032. The demand for natural anti-caking agents is driven by the increasing consumer preference for clean label and naturally derived food additives. Natural anti-caking agents are perceived as safer and healthier alternatives to synthetic additives, aligning with the growing trend of health and wellness. Additionally, advancements in food processing technologies and the development of high-quality natural anti-caking agents contribute to the segment's rapid growth. The expansion of the food and beverage industry and the increasing use of natural anti-caking agents in various applications, including bakery, dairy, and seasoning products, support the growth of this segment.
Anti-Caking Agents Market Share Analysis: Type (Calcium Compounds, Sodium Compounds, Others)
The calcium compounds segment is anticipated to be the fastest-growing in the Anti-Caking Agents Market by type to 2032. Calcium compounds, such as calcium silicate and calcium carbonate, are widely used as anti-caking agents due to their effectiveness in preventing clumping and improving the flowability of powdered and granulated products. The demand for calcium compounds is driven by their versatility and wide range of applications in the food and beverage industry. Additionally, the increasing focus on product quality and consistency contributes to the segment's rapid growth. The expansion of the food processing industry and the increasing use of calcium compounds in various products, including bakery, dairy, and seasoning products, support the growth of this segment.
Anti-Caking Agents Market Share Analysis: Application (Bakery, Seasonings and Condiments, Dairy, Others)
The bakery segment is expected to be the fastest-growing in the Anti-Caking Agents Market by application to 2032. The demand for anti-caking agents in the bakery industry is driven by the need to improve the quality and shelf life of bakery products. Anti-caking agents help prevent clumping and ensure the smooth flow of ingredients, such as flour, sugar, and baking powder, enhancing the overall quality of baked goods. Additionally, the increasing consumer preference for high-quality and convenient bakery products contributes to the segment's rapid growth. The expansion of the bakery industry and the rising trend of home baking further support the growth of the bakery segment in the anti-caking agents market.
Anti Caking Agents Market Segmentation
By Source
Natural
Synthetic
By Type
Calcium Compounds
Sodium Compounds
Others
By Application
Bakery
Seasonings and Condiments
Others
Dairy
Countries Analyzed
North America (US, Canada, Mexico)
Europe (Germany, UK, France, Spain, Italy, Russia, Rest of Europe)
Asia Pacific (China, India, Japan, South Korea, Australia, South East Asia, Rest of Asia)
South America (Brazil, Argentina, Rest of South America)
Middle East and Africa (Saudi Arabia, UAE, Rest of Middle East, South Africa, Egypt, Rest of Africa)
Anti Caking Agents Companies Profiled in the Study
Agropur cooperative
BASF SE
Chemipol SA
Evonik Industries AG
Jinsha Precipitated Silica Manufacturing Co. Ltd
Kao Corp
PPG Industries Inc
PQ Group Holdings Inc
Roquette Freres SA
Sweetener Supply Corp
*- List Not Exhaustive
Chapter 1. TABLE OF CONTENTS
Chapter 2. Introduction to Anti Caking Agents Market
2.1. Market Overview
2.2. Key Statistics and Report Highlights
2.3. Scope of the Comprehensive Study
2.3.1. Market Definition
2.3.2 Countries and Regions Covered
2.3.3 Research Objective
2.3.4 Units, Currency, and Conversions
2.3.5 Industry Value Chain
2.4. Key Market Segments
2.5. Key Companies
2.6. Study Period
Chapter 3. Strategic Analysis Review
3.1. Anti Caking Agents Pricing Analysis and Forecast
3.2. Porter’s Five Forces
3.3. Market Ecosystem
3.4. SWOT Analysis
3.5. Regulatory Scenario
3.3. Effects of Inflation, Russia-Ukraine War, moderating economic growth, and other macroeconomic factors
Chapter 4. Competitive Landscape
4.1. Market Share Analysis
4.1.1. Global Anti Caking Agents Market Share by Company, 2023
4.1.2. Product Offerings of Leading Anti Caking Agents Companies
4.2. Market Entropy
4.2.1. New Product Launches in the Industry
4.2.2. Mergers, Acquisitions, Joint ventures, and Partnerships
4.3. Key Strategies and Best Practices
Chapter 5. Global Market Projections: Best, Reference, and Low Case Scenarios
5.1. Growth Analysis- Case Scenario Definitions
5.2. Low Growth Case Scenario Forecasts
5.3. Reference Growth Case Scenario Forecasts
5.4. High Growth Case Scenario Forecasts
Chapter 6. Market Dynamics
6.1. Anti Caking Agents Market Drivers
6.2. Anti Caking Agents Market Challenges
6.6. Anti Caking Agents Market Opportunities
6.4. Anti Caking Agents Market Trends
Chapter 7. Global Anti Caking Agents Market Outlook Trends
7.1. Global Anti Caking Agents Revenue (USD Million) and CAGR (%) by Type (2021-2032)
7.2. Global Anti Caking Agents Revenue (USD Million) and CAGR (%) by Application (2021-2032)
7.3. Global Anti Caking Agents Revenue (USD Million) and CAGR (%) by Product (2021-2032)
By Source
Natural
Synthetic
By Type
Calcium Compounds
Sodium Compounds
Others
By Application
Bakery
Seasonings and Condiments
Others
Dairy
Chapter 8. Global Anti Caking Agents Regional Analysis and Outlook
8.1. Global Anti Caking Agents Revenue (USD Million) By Regions (2021- 2032)
8.2. North America Anti Caking Agents Revenue (USD Million) by Country (2021-2032)
8.2.1. United States Anti Caking Agents Regional Analysis and Outlook
8.2.2. Canada Anti Caking Agents Regional Analysis and Outlook
8.2.3. Mexico Anti Caking Agents Regional Analysis and Outlook
8.3. Europe Anti Caking Agents Revenue (USD Million), by Country (2021-2032)
8.3.1. Germany Anti Caking Agents Regional Analysis and Outlook
8.3.2. France Anti Caking Agents Regional Analysis and Outlook
8.3.3. United Kingdom Anti Caking Agents Regional Analysis and Outlook
8.3.4. Spain Anti Caking Agents Regional Analysis and Outlook
8.3.5. Italy Anti Caking Agents Regional Analysis and Outlook
8.3.6. Russia Anti Caking Agents Regional Analysis and Outlook
8.3.7. Rest of Europe Anti Caking Agents Regional Analysis and Outlook
8.4. Asia Pacific Anti Caking Agents Revenue (USD Million) by Country (2021-2032)
8.4.1. China Anti Caking Agents Regional Analysis and Outlook
8.4.2. Japan Anti Caking Agents Regional Analysis and Outlook
8.4.3. India Anti Caking Agents Regional Analysis and Outlook
8.4.4. South Korea Anti Caking Agents Regional Analysis and Outlook
8.4.5. Australia Anti Caking Agents Regional Analysis and Outlook
8.4.6. South East Asia Anti Caking Agents Regional Analysis and Outlook
8.4.7. Rest of Asia Pacific Anti Caking Agents Regional Analysis and Outlook
8.5. South America Anti Caking Agents Revenue (USD Million), by Country (2021-2032)
8.5.1. Brazil Anti Caking Agents Regional Analysis and Outlook
8.5.2. Argentina Anti Caking Agents Regional Analysis and Outlook
8.5.3. Rest of South America Anti Caking Agents Regional Analysis and Outlook
8.6. Middle East and Africa Anti Caking Agents Revenue (USD Million) by Country (2021-2032)
8.6.1. Middle East Anti Caking Agents Regional Analysis and Outlook
8.6.2. Africa Anti Caking Agents Regional Analysis and Outlook
Chapter 9. North America Anti Caking Agents Analysis and Outlook
9.1. North America Anti Caking Agents Revenue (USD Million) by Segments (2021-2032)
9.1.1. North America Anti Caking Agents Revenue (USD Million) by Type (2021-2032)
9.1.2. North America Anti Caking Agents Revenue (USD Million) by Application (2021-2032)
9.1.3. North America Anti Caking Agents Revenue (USD Million) by Product (2021-2032)
By Source
Natural
Synthetic
By Type
Calcium Compounds
Sodium Compounds
Others
By Application
Bakery
Seasonings and Condiments
Others
Dairy
Chapter 10. Europe Anti Caking Agents Analysis and Outlook
10.1. Europe Anti Caking Agents Revenue (USD Million), by Segments (USD Million) (2021-2032)
10.1.1. Europe Anti Caking Agents Revenue (USD Million) by Type (2021-2032)
10.1.2. Europe Anti Caking Agents Revenue (USD Million) by Application (2021-2032)
10.1.3. Europe Anti Caking Agents Revenue (USD Million) by Product (2021-2032)
By Source
Natural
Synthetic
By Type
Calcium Compounds
Sodium Compounds
Others
By Application
Bakery
Seasonings and Condiments
Others
Dairy
Chapter 11. Asia Pacific Anti Caking Agents Analysis and Outlook
11.1. Asia Pacific Anti Caking Agents Revenue (USD Million), and Revenue (USD Million) by Segments (2021-2032)
11.1.1. Asia Pacific Anti Caking Agents Revenue (USD Million) by Type (2021-2032)
11.1.2. Asia Pacific Anti Caking Agents Revenue (USD Million) by Application (2021-2032)
11.1.3. Asia Pacific Anti Caking Agents Revenue (USD Million) by Product (2021-2032)
By Source
Natural
Synthetic
By Type
Calcium Compounds
Sodium Compounds
Others
By Application
Bakery
Seasonings and Condiments
Others
Dairy
Chapter 12. South America Anti Caking Agents Analysis and Outlook
12.1. South America Anti Caking Agents Revenue (USD Million), by Segments (2021-2032)
12.1.1. South America Anti Caking Agents Revenue (USD Million) by Type (2021-2032)
12.1.2. South America Anti Caking Agents Revenue (USD Million) by Application (2021-2032)
12.1.3. South America Anti Caking Agents Revenue (USD Million) by Product (2021-2032)
By Source
Natural
Synthetic
By Type
Calcium Compounds
Sodium Compounds
Others
By Application
Bakery
Seasonings and Condiments
Others
Dairy
Chapter 13. Middle East and Africa Anti Caking Agents Analysis and Outlook
13.1. Middle East and Africa Anti Caking Agents Revenue (USD Million), by Segments (2021-2032)
13.1.1. Middle East and Africa Anti Caking Agents Revenue (USD Million) by Type (2021-2032)
13.1.2. Middle East and Africa Anti Caking Agents Revenue (USD Million) by Application (2021-2032)
13.1.3. Middle East and Africa Anti Caking Agents Revenue (USD Million) by Product (2021-2032)
By Source
Natural
Synthetic
By Type
Calcium Compounds
Sodium Compounds
Others
By Application
Bakery
Seasonings and Condiments
Others
Dairy
Chapter 14. Anti Caking Agents Company Profiles
14.1 Business Overview
14.2 Product Profiles
14.3 SWOT Profiles
14.5 Recent Developments
14.6 Financial Profile
List of Companies
Agropur cooperative
BASF SE
Chemipol SA
Evonik Industries AG
Jinsha Precipitated Silica Manufacturing Co. Ltd
Kao Corp
PPG Industries Inc
PQ Group Holdings Inc
Roquette Freres SA
Sweetener Supply Corp
15. Methodology and Data Sources
15.1 Customization Offerings
15.2 Subscription Services
15.3 Related Reports
15.4 Publisher Expertise
LIST OF TABLES
Table 1 Market Segmentation Analysis
Table 2 Global Anti Caking Agents Market Share of Leading Companies, 2023
Table 3 Product Offerings of Leading Companies
Table 4 Low Growth Scenario Forecasts
Table 5 Reference Case Growth Scenario
Table 6 High Growth Case Scenario
Table 7 Global Anti Caking Agents Revenue (USD Million) And CAGR (%) By Type (2021-2032)
Table 8 Global Anti Caking Agents Revenue (USD Million) And CAGR (%) By Application (2021-2032)
Table 9 Global Anti Caking Agents Revenue (USD Million) And CAGR (%) By Product (2021-2032)
Table 10 Global Anti Caking Agents Market Revenue (USD Million) By Regions (2021-2032)
Table 11 Global Anti Caking Agents Market Share (%) By Regions (2021-2032)
Table 12 North America Anti Caking Agents Revenue (USD Million) By Country (2021-2032)
Table 13 Europe Anti Caking Agents Revenue (USD Million) By Country (2021-2032)
Table 14 Asia Pacific Anti Caking Agents Revenue (USD Million) By Country (2021-2032)
Table 15 South America Anti Caking Agents Revenue (USD Million) By Country (2021-2032)
Table 16 Middle East and Africa Anti Caking Agents Revenue (USD Million) By Region (2021-2032)
Table 17 North America Anti Caking Agents Revenue (USD Million) By Type (2021-2032)
Table 18 North America Anti Caking Agents Revenue (USD Million) By Application (2021-2032)
Table 19 North America Anti Caking Agents Revenue (USD Million) By Product (2021-2032)
Table 20 Europe Anti Caking Agents Revenue (USD Million) By Type (2021-2032)
Table 21 Europe Anti Caking Agents Revenue (USD Million) By Application (2021-2032)
Table 22 Europe Anti Caking Agents Revenue (USD Million) By Product (2021-2032)
Table 23 Asia Pacific Anti Caking Agents Revenue (USD Million) By Type (2021-2032)
Table 24 Asia Pacific Anti Caking Agents Revenue (USD Million) By Application (2021-2032)
Table 25 Asia Pacific Anti Caking Agents Revenue (USD Million) By Product (2021-2032)
Table 26 South America Anti Caking Agents Revenue (USD Million) By Type (2021-2032)
Table 27 South America Anti Caking Agents Revenue (USD Million) By Application (2021-2032)
Table 28 South America Anti Caking Agents Revenue (USD Million) By Product (2021-2032)
Table 29 Middle East and Africa Anti Caking Agents Revenue (USD Million) By Type (2021-2032)
Table 30 Middle East and Africa Anti Caking Agents Revenue (USD Million) By Application (2021-2032)
Table 31 Middle East and Africa Anti Caking Agents Revenue (USD Million) By Product (2021-2032)
LIST OF FIGURES
Figure 1. Market Scope
Figure 2. Pricing Forecasts Per Unit, 2023- 2032
Figure 3. Porter’s Five Forces
Figure 4. Global Anti Caking Agents Market Revenue (USD Million) By Regions (2021-2032)
Figure 5. Global Anti Caking Agents Market Share (%) By Regions (2023)
Figure 6. North America Anti Caking Agents Revenue (USD Million) By Country (2021-2032)
Figure 7. United States Anti Caking Agents Revenue (USD Million) By Country (2021-2032)
Figure 8. Canada Anti Caking Agents Revenue (USD Million) By Country (2021-2032)
Figure 9. Mexico Anti Caking Agents Revenue (USD Million) By Country (2021-2032)
Figure 10. Europe Anti Caking Agents Revenue (USD Million) By Country (2021-2032)
Figure 11. Germany Anti Caking Agents Revenue (USD Million) By Country (2021-2032)
Figure 12. France Anti Caking Agents Revenue (USD Million) By Country (2021-2032)
Figure 13. United Kingdom Anti Caking Agents Revenue (USD Million) By Country (2021-2032)
Figure 14. Spain Anti Caking Agents Revenue (USD Million) By Country (2021-2032)
Figure 15. Italy Anti Caking Agents Revenue (USD Million) By Country (2021-2032)
Figure 16. Russia Anti Caking Agents Revenue (USD Million) By Country (2021-2032)
Figure 17. Rest of Europe Anti Caking Agents Revenue (USD Million) By Country (2021-2032)
Figure 11. Asia Pacific Anti Caking Agents Revenue (USD Million) By Country (2021-2032)
Figure 12. China Anti Caking Agents Revenue (USD Million) By Country (2021-2032)
Figure 13. Japan Anti Caking Agents Revenue (USD Million) By Country (2021-2032)
Figure 14. India Anti Caking Agents Revenue (USD Million) By Country (2021-2032)
Figure 15. South Korea Anti Caking Agents Revenue (USD Million) By Country (2021-2032)
Figure 16. Australia Anti Caking Agents Revenue (USD Million) By Country (2021-2032)
Figure 17. South East Asia Anti Caking Agents Revenue (USD Million) By Country (2021-2032)
Figure 18. South America Anti Caking Agents Revenue (USD Million) By Country (2021-2032)
Figure 19. Brazil Anti Caking Agents Revenue (USD Million) By Country (2021-2032)
Figure 20. Argentina Anti Caking Agents Revenue (USD Million) By Country (2021-2032)
Figure 21. Rest of Asia Pacific Anti Caking Agents Revenue (USD Million) By Country (2021-2032)
Figure 22. Middle East and Africa Anti Caking Agents Revenue (USD Million) By Region (2021-2032)
Figure 23. Saudi Arabia Anti Caking Agents Revenue (USD Million) By Region (2021-2032)
Figure 24. The UAE Anti Caking Agents Revenue (USD Million) By Region (2021-2032)
Figure 25. Rest of Middle East Anti Caking Agents Revenue (USD Million) By Region (2021-2032)
Figure 26. South Africa Anti Caking Agents Revenue (USD Million) By Region (2021-2032)
Figure 27. Africa Anti Caking Agents Revenue (USD Million) By Region (2021-2032)
Figure 28. North America Anti Caking Agents Revenue (USD Million) By Type (2021-2032)
Figure 29. North America Anti Caking Agents Revenue (USD Million) By Application (2021-2032)
Figure 30. North America Anti Caking Agents Revenue (USD Million) By Product (2021-2032)
Figure 31. Europe Anti Caking Agents Revenue (USD Million) By Type (2021-2032)
Figure 32. Europe Anti Caking Agents Revenue (USD Million) By Application (2021-2032)
Figure 33. Europe Anti Caking Agents Revenue (USD Million) By Product (2021-2032)
Figure 34. Asia Pacific Anti Caking Agents Revenue (USD Million) By Type (2021-2032)
Figure 35. Asia Pacific Anti Caking Agents Revenue (USD Million) By Application (2021-2032)
Figure 36. Asia Pacific Anti Caking Agents Revenue (USD Million) By Product (2021-2032)
Figure 37. South America Anti Caking Agents Revenue (USD Million) By Type (2021-2032)
Figure 38. South America Anti Caking Agents Revenue (USD Million) By Application (2021-2032)
Figure 39. South America Anti Caking Agents Revenue (USD Million) By Product (2021-2032)
Figure 40. Middle East and Africa Anti Caking Agents Revenue (USD Million) By Type (2021-2032)
Figure 41. Middle East and Africa Anti Caking Agents Revenue (USD Million) By Application (2021-2032)
Figure 42. Middle East and Africa Anti Caking Agents Revenue (USD Million) By Product (2021-2032)
By Source
Natural
Synthetic
By Type
Calcium Compounds
Sodium Compounds
Others
By Application
Bakery
Seasonings and Condiments
Others
Dairy
Countries Analyzed
North America (US, Canada, Mexico)
Europe (Germany, UK, France, Spain, Italy, Russia, Rest of Europe)
Asia Pacific (China, India, Japan, South Korea, Australia, South East Asia, Rest of Asia)
South America (Brazil, Argentina, Rest of South America)
Middle East and Africa (Saudi Arabia, UAE, Rest of Middle East, South Africa, Egypt, Rest of Africa)
