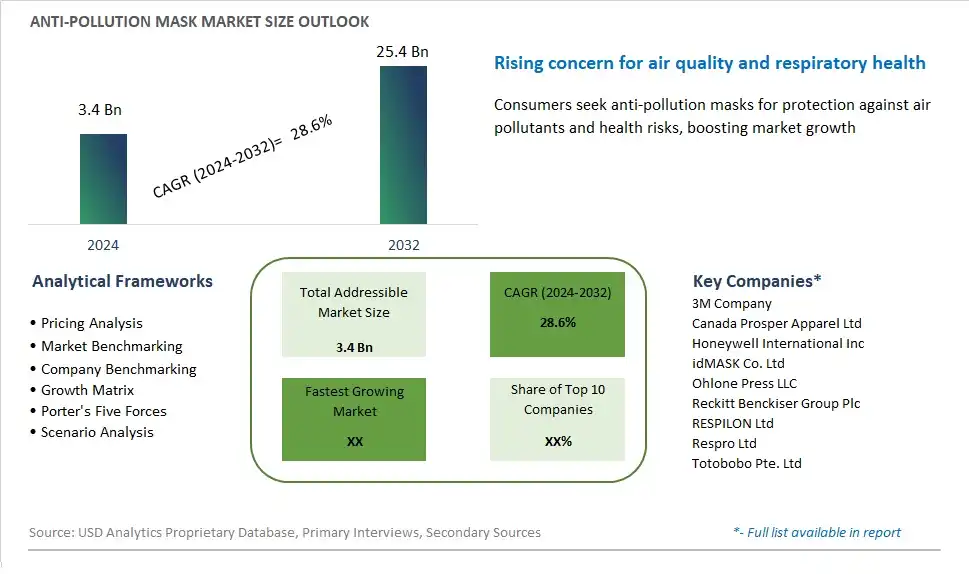
Global Anti-Pollution Mask Market Size is valued at $3.4 Billion in 2024 and is forecast to register a growth rate (CAGR) of 28.6% to reach $25.4 Billion by 2032.
The global Anti-Pollution Mask Market Comprehensive Study analyzes and forecasts the market size across 6 regions and 24 countries for diverse segments -By Type (Reusable, Disposable), By Filter (Particulate Filter, Gas and Odor Filter, Combination Filter), By Distribution Channel (Supermarkets/Hypermarkets, Pharmacy/Drug Stores, Online Channels, Others)
An Introduction to Anti-Pollution Mask Market
The market for anti-pollution masks is expanding rapidly as urbanization, industrialization, and environmental concerns drive demand for respiratory protection solutions. Anti-pollution masks, also known as particulate respirators or pollution masks, are designed to filter out harmful airborne particles, pollutants, and allergens, providing wearers with cleaner and healthier air to breathe. With growing awareness of the adverse health effects of air pollution, including respiratory diseases, allergies, and cardiovascular issues, consumers are increasingly incorporating anti-pollution masks into their daily routines, especially in densely populated cities and areas with high levels of pollution. Moreover, advancements in mask technology, such as multi-layer filtration systems, adjustable straps, and comfortable designs, are enhancing user comfort and effectiveness, further fueling adoption in the market.
Anti Pollution Mask Competitive Landscape
The market report analyses the leading companies in the industry including 3M Company, Canada Prosper Apparel Ltd, Honeywell International Inc, idMASK Co. Ltd, Ohlone Press LLC, Reckitt Benckiser Group Plc, RESPILON Ltd, Respro Ltd, Totobobo Pte. Ltd, and Others.
Anti Pollution Mask Market Dynamics
Market Trend: Increased Focus on Air Quality
The most prominent trend in the Anti-Pollution Mask Market is the increased focus on air quality. As concerns about air pollution and its health impacts rise, there is a growing demand for protective measures, including anti-pollution masks. This trend is driven by heightened awareness of respiratory diseases, urbanization, and frequent pollution episodes in many cities worldwide
Market Driver: Government Regulations and Health Guidelines
Government regulations and health guidelines are major drivers of the Anti-Pollution Mask Market. Regulatory bodies in many countries are implementing stricter air quality standards and recommending the use of protective gear during high pollution events. These regulations and guidelines are driving the adoption of anti-pollution masks among the general population, as well as in occupational settings where workers are exposed to harmful air pollutants
Market Opportunity: Innovation in Mask Design and Filtration Technology
A significant opportunity in the Anti-Pollution Mask Market lies in innovation in mask design and filtration technology. Companies can differentiate their products by developing masks that offer better comfort, fit, and filtration efficiency. Features such as adjustable straps, breathable materials, and advanced filtration layers can enhance user experience and attract more consumers. Additionally, smart masks with sensors that monitor air quality and provide real-time data can appeal to tech-savvy users
Anti-Pollution Mask Market Share Analysis: Type (Reusable, Disposable)
The reusable segment is expected to be the fastest-growing in the Anti-Pollution Mask Market by type to 2032. Reusable anti-pollution masks offer several advantages, including cost-effectiveness, durability, and environmental sustainability, making them a preferred choice among consumers. The demand for reusable masks is driven by the increasing awareness of air pollution and its health impacts, as well as the growing preference for sustainable and eco-friendly products. Additionally, advancements in mask design and filtration technology enhance the effectiveness and comfort of reusable masks, further boosting their popularity. The expansion of product offerings and the increasing availability of reusable anti-pollution masks in various retail channels support the growth of this segment.
Anti-Pollution Mask Market Share Analysis: Filter (Particulate Filter, Gas and Odor Filter, Combination Filter)
The combination filter segment is anticipated to be the fastest-growing in the Anti-Pollution Mask Market by filter to 2032. Combination filters offer comprehensive protection against a wide range of pollutants, including particulate matter, gases, and odors, making them a preferred choice among consumers. The demand for combination filters is driven by the increasing awareness of air pollution and its health impacts, as well as the growing need for effective and versatile filtration solutions. Additionally, advancements in filtration technology and the development of high-performance combination filters contribute to the segment's rapid growth. The expansion of product offerings and the increasing availability of combination filter anti-pollution masks in various retail channels support the growth of this segment.
Anti-Pollution Mask Market Share Analysis: Distribution Channel (Supermarkets/Hypermarkets, Online, Pharmacies, Specialty Stores)
The online distribution channel is expected to be the fastest-growing segment in the Anti-Pollution Mask Market by distribution channel to 2032. The convenience and accessibility of online shopping, combined with the growing consumer preference for e-commerce, drive the rapid growth of this segment. Online platforms offer a wide variety of anti-pollution masks, detailed product descriptions, and customer reviews, making it easier for consumers to make informed purchasing decisions. The COVID-19 pandemic has further accelerated the shift towards online shopping, as consumers seek contactless and convenient ways to purchase their preferred protective products. Subscription services and direct-to-consumer models also contribute to the segment's expansion, providing consumers with regular deliveries of their preferred anti-pollution masks.
Anti Pollution Mask Market Segmentation
By Type
Reusable
Disposable
By Filter
Particulate Filter
Gas and Odor Filter
Combination Filter
By Distribution Channel
Supermarkets/Hypermarkets
Pharmacy/Drug Stores
Online Channels
Others
Countries Analyzed
North America (US, Canada, Mexico)
Europe (Germany, UK, France, Spain, Italy, Russia, Rest of Europe)
Asia Pacific (China, India, Japan, South Korea, Australia, South East Asia, Rest of Asia)
South America (Brazil, Argentina, Rest of South America)
Middle East and Africa (Saudi Arabia, UAE, Rest of Middle East, South Africa, Egypt, Rest of Africa)
Anti Pollution Mask Companies Profiled in the Study
3M Company
Canada Prosper Apparel Ltd
Honeywell International Inc
idMASK Co. Ltd
Ohlone Press LLC
Reckitt Benckiser Group Plc
RESPILON Ltd
Respro Ltd
Totobobo Pte. Ltd
*- List Not Exhaustive
Chapter 1. TABLE OF CONTENTS
Chapter 2. Introduction to Anti Pollution Mask Market
2.1. Market Overview
2.2. Key Statistics and Report Highlights
2.3. Scope of the Comprehensive Study
2.3.1. Market Definition
2.3.2 Countries and Regions Covered
2.3.3 Research Objective
2.3.4 Units, Currency, and Conversions
2.3.5 Industry Value Chain
2.4. Key Market Segments
2.5. Key Companies
2.6. Study Period
Chapter 3. Strategic Analysis Review
3.1. Anti Pollution Mask Pricing Analysis and Forecast
3.2. Porter’s Five Forces
3.3. Market Ecosystem
3.4. SWOT Analysis
3.5. Regulatory Scenario
3.3. Effects of Inflation, Russia-Ukraine War, moderating economic growth, and other macroeconomic factors
Chapter 4. Competitive Landscape
4.1. Market Share Analysis
4.1.1. Global Anti Pollution Mask Market Share by Company, 2023
4.1.2. Product Offerings of Leading Anti Pollution Mask Companies
4.2. Market Entropy
4.2.1. New Product Launches in the Industry
4.2.2. Mergers, Acquisitions, Joint ventures, and Partnerships
4.3. Key Strategies and Best Practices
Chapter 5. Global Market Projections: Best, Reference, and Low Case Scenarios
5.1. Growth Analysis- Case Scenario Definitions
5.2. Low Growth Case Scenario Forecasts
5.3. Reference Growth Case Scenario Forecasts
5.4. High Growth Case Scenario Forecasts
Chapter 6. Market Dynamics
6.1. Anti Pollution Mask Market Drivers
6.2. Anti Pollution Mask Market Challenges
6.6. Anti Pollution Mask Market Opportunities
6.4. Anti Pollution Mask Market Trends
Chapter 7. Global Anti Pollution Mask Market Outlook Trends
7.1. Global Anti Pollution Mask Revenue (USD Million) and CAGR (%) by Type (2021-2032)
7.2. Global Anti Pollution Mask Revenue (USD Million) and CAGR (%) by Application (2021-2032)
7.3. Global Anti Pollution Mask Revenue (USD Million) and CAGR (%) by Product (2021-2032)
By Type
Reusable
Disposable
By Filter
Particulate Filter
Gas and Odor Filter
Combination Filter
By Distribution Channel
Supermarkets/Hypermarkets
Pharmacy/Drug Stores
Online Channels
Others
Chapter 8. Global Anti Pollution Mask Regional Analysis and Outlook
8.1. Global Anti Pollution Mask Revenue (USD Million) By Regions (2021- 2032)
8.2. North America Anti Pollution Mask Revenue (USD Million) by Country (2021-2032)
8.2.1. United States Anti Pollution Mask Regional Analysis and Outlook
8.2.2. Canada Anti Pollution Mask Regional Analysis and Outlook
8.2.3. Mexico Anti Pollution Mask Regional Analysis and Outlook
8.3. Europe Anti Pollution Mask Revenue (USD Million), by Country (2021-2032)
8.3.1. Germany Anti Pollution Mask Regional Analysis and Outlook
8.3.2. France Anti Pollution Mask Regional Analysis and Outlook
8.3.3. United Kingdom Anti Pollution Mask Regional Analysis and Outlook
8.3.4. Spain Anti Pollution Mask Regional Analysis and Outlook
8.3.5. Italy Anti Pollution Mask Regional Analysis and Outlook
8.3.6. Russia Anti Pollution Mask Regional Analysis and Outlook
8.3.7. Rest of Europe Anti Pollution Mask Regional Analysis and Outlook
8.4. Asia Pacific Anti Pollution Mask Revenue (USD Million) by Country (2021-2032)
8.4.1. China Anti Pollution Mask Regional Analysis and Outlook
8.4.2. Japan Anti Pollution Mask Regional Analysis and Outlook
8.4.3. India Anti Pollution Mask Regional Analysis and Outlook
8.4.4. South Korea Anti Pollution Mask Regional Analysis and Outlook
8.4.5. Australia Anti Pollution Mask Regional Analysis and Outlook
8.4.6. South East Asia Anti Pollution Mask Regional Analysis and Outlook
8.4.7. Rest of Asia Pacific Anti Pollution Mask Regional Analysis and Outlook
8.5. South America Anti Pollution Mask Revenue (USD Million), by Country (2021-2032)
8.5.1. Brazil Anti Pollution Mask Regional Analysis and Outlook
8.5.2. Argentina Anti Pollution Mask Regional Analysis and Outlook
8.5.3. Rest of South America Anti Pollution Mask Regional Analysis and Outlook
8.6. Middle East and Africa Anti Pollution Mask Revenue (USD Million) by Country (2021-2032)
8.6.1. Middle East Anti Pollution Mask Regional Analysis and Outlook
8.6.2. Africa Anti Pollution Mask Regional Analysis and Outlook
Chapter 9. North America Anti Pollution Mask Analysis and Outlook
9.1. North America Anti Pollution Mask Revenue (USD Million) by Segments (2021-2032)
9.1.1. North America Anti Pollution Mask Revenue (USD Million) by Type (2021-2032)
9.1.2. North America Anti Pollution Mask Revenue (USD Million) by Application (2021-2032)
9.1.3. North America Anti Pollution Mask Revenue (USD Million) by Product (2021-2032)
By Type
Reusable
Disposable
By Filter
Particulate Filter
Gas and Odor Filter
Combination Filter
By Distribution Channel
Supermarkets/Hypermarkets
Pharmacy/Drug Stores
Online Channels
Others
Chapter 10. Europe Anti Pollution Mask Analysis and Outlook
10.1. Europe Anti Pollution Mask Revenue (USD Million), by Segments (USD Million) (2021-2032)
10.1.1. Europe Anti Pollution Mask Revenue (USD Million) by Type (2021-2032)
10.1.2. Europe Anti Pollution Mask Revenue (USD Million) by Application (2021-2032)
10.1.3. Europe Anti Pollution Mask Revenue (USD Million) by Product (2021-2032)
By Type
Reusable
Disposable
By Filter
Particulate Filter
Gas and Odor Filter
Combination Filter
By Distribution Channel
Supermarkets/Hypermarkets
Pharmacy/Drug Stores
Online Channels
Others
Chapter 11. Asia Pacific Anti Pollution Mask Analysis and Outlook
11.1. Asia Pacific Anti Pollution Mask Revenue (USD Million), and Revenue (USD Million) by Segments (2021-2032)
11.1.1. Asia Pacific Anti Pollution Mask Revenue (USD Million) by Type (2021-2032)
11.1.2. Asia Pacific Anti Pollution Mask Revenue (USD Million) by Application (2021-2032)
11.1.3. Asia Pacific Anti Pollution Mask Revenue (USD Million) by Product (2021-2032)
By Type
Reusable
Disposable
By Filter
Particulate Filter
Gas and Odor Filter
Combination Filter
By Distribution Channel
Supermarkets/Hypermarkets
Pharmacy/Drug Stores
Online Channels
Others
Chapter 12. South America Anti Pollution Mask Analysis and Outlook
12.1. South America Anti Pollution Mask Revenue (USD Million), by Segments (2021-2032)
12.1.1. South America Anti Pollution Mask Revenue (USD Million) by Type (2021-2032)
12.1.2. South America Anti Pollution Mask Revenue (USD Million) by Application (2021-2032)
12.1.3. South America Anti Pollution Mask Revenue (USD Million) by Product (2021-2032)
By Type
Reusable
Disposable
By Filter
Particulate Filter
Gas and Odor Filter
Combination Filter
By Distribution Channel
Supermarkets/Hypermarkets
Pharmacy/Drug Stores
Online Channels
Others
Chapter 13. Middle East and Africa Anti Pollution Mask Analysis and Outlook
13.1. Middle East and Africa Anti Pollution Mask Revenue (USD Million), by Segments (2021-2032)
13.1.1. Middle East and Africa Anti Pollution Mask Revenue (USD Million) by Type (2021-2032)
13.1.2. Middle East and Africa Anti Pollution Mask Revenue (USD Million) by Application (2021-2032)
13.1.3. Middle East and Africa Anti Pollution Mask Revenue (USD Million) by Product (2021-2032)
By Type
Reusable
Disposable
By Filter
Particulate Filter
Gas and Odor Filter
Combination Filter
By Distribution Channel
Supermarkets/Hypermarkets
Pharmacy/Drug Stores
Online Channels
Others
Chapter 14. Anti Pollution Mask Company Profiles
14.1 Business Overview
14.2 Product Profiles
14.3 SWOT Profiles
14.5 Recent Developments
14.6 Financial Profile
List of Companies
3M Company
Canada Prosper Apparel Ltd
Honeywell International Inc
idMASK Co. Ltd
Ohlone Press LLC
Reckitt Benckiser Group Plc
RESPILON Ltd
Respro Ltd
Totobobo Pte. Ltd
15. Methodology and Data Sources
15.1 Customization Offerings
15.2 Subscription Services
15.3 Related Reports
15.4 Publisher Expertise
LIST OF TABLES
Table 1 Market Segmentation Analysis
Table 2 Global Anti Pollution Mask Market Share of Leading Companies, 2023
Table 3 Product Offerings of Leading Companies
Table 4 Low Growth Scenario Forecasts
Table 5 Reference Case Growth Scenario
Table 6 High Growth Case Scenario
Table 7 Global Anti Pollution Mask Revenue (USD Million) And CAGR (%) By Type (2021-2032)
Table 8 Global Anti Pollution Mask Revenue (USD Million) And CAGR (%) By Application (2021-2032)
Table 9 Global Anti Pollution Mask Revenue (USD Million) And CAGR (%) By Product (2021-2032)
Table 10 Global Anti Pollution Mask Market Revenue (USD Million) By Regions (2021-2032)
Table 11 Global Anti Pollution Mask Market Share (%) By Regions (2021-2032)
Table 12 North America Anti Pollution Mask Revenue (USD Million) By Country (2021-2032)
Table 13 Europe Anti Pollution Mask Revenue (USD Million) By Country (2021-2032)
Table 14 Asia Pacific Anti Pollution Mask Revenue (USD Million) By Country (2021-2032)
Table 15 South America Anti Pollution Mask Revenue (USD Million) By Country (2021-2032)
Table 16 Middle East and Africa Anti Pollution Mask Revenue (USD Million) By Region (2021-2032)
Table 17 North America Anti Pollution Mask Revenue (USD Million) By Type (2021-2032)
Table 18 North America Anti Pollution Mask Revenue (USD Million) By Application (2021-2032)
Table 19 North America Anti Pollution Mask Revenue (USD Million) By Product (2021-2032)
Table 20 Europe Anti Pollution Mask Revenue (USD Million) By Type (2021-2032)
Table 21 Europe Anti Pollution Mask Revenue (USD Million) By Application (2021-2032)
Table 22 Europe Anti Pollution Mask Revenue (USD Million) By Product (2021-2032)
Table 23 Asia Pacific Anti Pollution Mask Revenue (USD Million) By Type (2021-2032)
Table 24 Asia Pacific Anti Pollution Mask Revenue (USD Million) By Application (2021-2032)
Table 25 Asia Pacific Anti Pollution Mask Revenue (USD Million) By Product (2021-2032)
Table 26 South America Anti Pollution Mask Revenue (USD Million) By Type (2021-2032)
Table 27 South America Anti Pollution Mask Revenue (USD Million) By Application (2021-2032)
Table 28 South America Anti Pollution Mask Revenue (USD Million) By Product (2021-2032)
Table 29 Middle East and Africa Anti Pollution Mask Revenue (USD Million) By Type (2021-2032)
Table 30 Middle East and Africa Anti Pollution Mask Revenue (USD Million) By Application (2021-2032)
Table 31 Middle East and Africa Anti Pollution Mask Revenue (USD Million) By Product (2021-2032)
LIST OF FIGURES
Figure 1. Market Scope
Figure 2. Pricing Forecasts Per Unit, 2023- 2032
Figure 3. Porter’s Five Forces
Figure 4. Global Anti Pollution Mask Market Revenue (USD Million) By Regions (2021-2032)
Figure 5. Global Anti Pollution Mask Market Share (%) By Regions (2023)
Figure 6. North America Anti Pollution Mask Revenue (USD Million) By Country (2021-2032)
Figure 7. United States Anti Pollution Mask Revenue (USD Million) By Country (2021-2032)
Figure 8. Canada Anti Pollution Mask Revenue (USD Million) By Country (2021-2032)
Figure 9. Mexico Anti Pollution Mask Revenue (USD Million) By Country (2021-2032)
Figure 10. Europe Anti Pollution Mask Revenue (USD Million) By Country (2021-2032)
Figure 11. Germany Anti Pollution Mask Revenue (USD Million) By Country (2021-2032)
Figure 12. France Anti Pollution Mask Revenue (USD Million) By Country (2021-2032)
Figure 13. United Kingdom Anti Pollution Mask Revenue (USD Million) By Country (2021-2032)
Figure 14. Spain Anti Pollution Mask Revenue (USD Million) By Country (2021-2032)
Figure 15. Italy Anti Pollution Mask Revenue (USD Million) By Country (2021-2032)
Figure 16. Russia Anti Pollution Mask Revenue (USD Million) By Country (2021-2032)
Figure 17. Rest of Europe Anti Pollution Mask Revenue (USD Million) By Country (2021-2032)
Figure 11. Asia Pacific Anti Pollution Mask Revenue (USD Million) By Country (2021-2032)
Figure 12. China Anti Pollution Mask Revenue (USD Million) By Country (2021-2032)
Figure 13. Japan Anti Pollution Mask Revenue (USD Million) By Country (2021-2032)
Figure 14. India Anti Pollution Mask Revenue (USD Million) By Country (2021-2032)
Figure 15. South Korea Anti Pollution Mask Revenue (USD Million) By Country (2021-2032)
Figure 16. Australia Anti Pollution Mask Revenue (USD Million) By Country (2021-2032)
Figure 17. South East Asia Anti Pollution Mask Revenue (USD Million) By Country (2021-2032)
Figure 18. South America Anti Pollution Mask Revenue (USD Million) By Country (2021-2032)
Figure 19. Brazil Anti Pollution Mask Revenue (USD Million) By Country (2021-2032)
Figure 20. Argentina Anti Pollution Mask Revenue (USD Million) By Country (2021-2032)
Figure 21. Rest of Asia Pacific Anti Pollution Mask Revenue (USD Million) By Country (2021-2032)
Figure 22. Middle East and Africa Anti Pollution Mask Revenue (USD Million) By Region (2021-2032)
Figure 23. Saudi Arabia Anti Pollution Mask Revenue (USD Million) By Region (2021-2032)
Figure 24. The UAE Anti Pollution Mask Revenue (USD Million) By Region (2021-2032)
Figure 25. Rest of Middle East Anti Pollution Mask Revenue (USD Million) By Region (2021-2032)
Figure 26. South Africa Anti Pollution Mask Revenue (USD Million) By Region (2021-2032)
Figure 27. Africa Anti Pollution Mask Revenue (USD Million) By Region (2021-2032)
Figure 28. North America Anti Pollution Mask Revenue (USD Million) By Type (2021-2032)
Figure 29. North America Anti Pollution Mask Revenue (USD Million) By Application (2021-2032)
Figure 30. North America Anti Pollution Mask Revenue (USD Million) By Product (2021-2032)
Figure 31. Europe Anti Pollution Mask Revenue (USD Million) By Type (2021-2032)
Figure 32. Europe Anti Pollution Mask Revenue (USD Million) By Application (2021-2032)
Figure 33. Europe Anti Pollution Mask Revenue (USD Million) By Product (2021-2032)
Figure 34. Asia Pacific Anti Pollution Mask Revenue (USD Million) By Type (2021-2032)
Figure 35. Asia Pacific Anti Pollution Mask Revenue (USD Million) By Application (2021-2032)
Figure 36. Asia Pacific Anti Pollution Mask Revenue (USD Million) By Product (2021-2032)
Figure 37. South America Anti Pollution Mask Revenue (USD Million) By Type (2021-2032)
Figure 38. South America Anti Pollution Mask Revenue (USD Million) By Application (2021-2032)
Figure 39. South America Anti Pollution Mask Revenue (USD Million) By Product (2021-2032)
Figure 40. Middle East and Africa Anti Pollution Mask Revenue (USD Million) By Type (2021-2032)
Figure 41. Middle East and Africa Anti Pollution Mask Revenue (USD Million) By Application (2021-2032)
Figure 42. Middle East and Africa Anti Pollution Mask Revenue (USD Million) By Product (2021-2032)
By Type
Reusable
Disposable
By Filter
Particulate Filter
Gas and Odor Filter
Combination Filter
By Distribution Channel
Supermarkets/Hypermarkets
Pharmacy/Drug Stores
Online Channels
Others
Countries Analyzed
North America (US, Canada, Mexico)
Europe (Germany, UK, France, Spain, Italy, Russia, Rest of Europe)
Asia Pacific (China, India, Japan, South Korea, Australia, South East Asia, Rest of Asia)
South America (Brazil, Argentina, Rest of South America)
Middle East and Africa (Saudi Arabia, UAE, Rest of Middle East, South Africa, Egypt, Rest of Africa)
