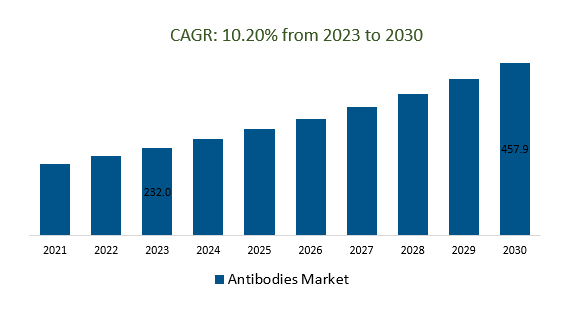
The global Antibodies Market Size is estimated to be US$ 232.0 Billion in 2023 and is poised to register 10.2% growth over the forecast period from 2023 to 2030 to reach US $ 457.9 billion in 2030.
The market growth is driven by trend toward personalized medicine has led to the development of antibody-based treatments that can be tailored to individual patients based on their genetic and molecular characteristics. Further, Antibodies have been extensively studied and developed for various applications, particularly in the fields of immunology and oncology. The rising prevalence of cancer and autoimmune diseases has driven research and development efforts to create targeted antibody therapies.
Leading Companies are Advanced Therapeutic Modalities, Personalized and Precision Medicine, Advanced Antibody Engineering, Collaborations and Partnerships, Regulatory Evolution, and others to boost market shares in the industry.
Market Overview
The antibodies market, also known as the monoclonal antibodies (mAbs) market, is a rapidly growing segment of the biopharmaceutical and biotechnology industries. Antibodies are proteins produced by the immune system in response to foreign substances (antigens), such as pathogens or abnormal cells. Monoclonal antibodies (mAbs) are antibodies that are produced from a single cell line and are highly specific in targeting a particular antigen.
Market Trends- Companies are launching a Growing Demand for Therapeutic Antibodies to attract a consumer base
The escalating demand for therapeutic antibodies is propelling the antibodies market due to their precise targeting of disease-related molecules, efficacy in treating conditions like cancer and autoimmune disorders, alignment with personalized medicine's tailored approach, advancement in immunotherapy, reduced adverse effects compared to traditional treatments, widening scope for neurological and cardiovascular diseases, biological specificity, potential for combination therapies, substantial research and development investment, regulatory approvals boosting confidence, patient-driven demand for targeted therapies, and the emergence of biosimilars for increased accessibility and affordability.
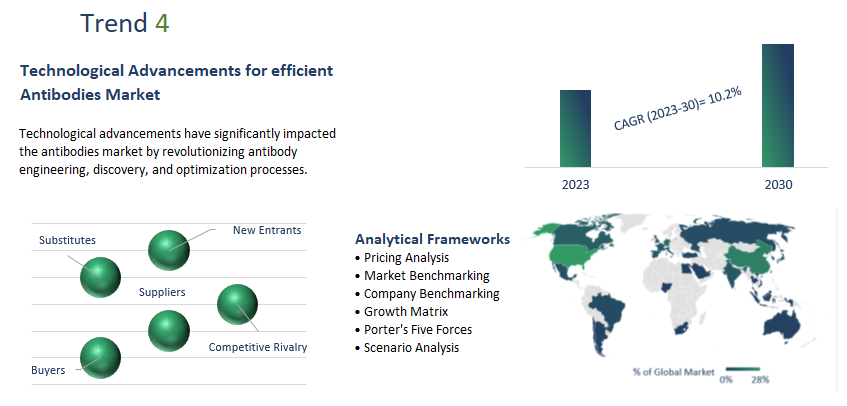
Technological advancements have significantly impacted the antibodies market by revolutionizing antibody engineering, discovery, and optimization processes. These advancements include innovative antibody discovery platforms, high-throughput screening methods, computational modeling for antibody design, and CRISPR-based approaches for antibody optimization. These technologies have accelerated the development of antibodies with improved specificity, reduced immunogenicity, enhanced binding affinity, and better therapeutic properties, fostering the creation of next-generation antibody-based therapies for various diseases.
Advancements in biotechnology have played a pivotal role in shaping the antibodies market, driving breakthroughs in antibody research, development, and production. These advancements encompass cutting-edge techniques such as phage display and hybridoma technology for antibody discovery, high-throughput screening methods for identifying lead candidates, protein engineering for enhancing antibody properties, and glycoengineering to modulate antibody functions.
Monoclonal Antibodies: Monoclonal antibodies (mAbs) have revolutionized the antibodies market by offering targeted therapies with minimal side effects for conditions like cancer and autoimmune diseases. Derived from a single immune cell clone, mAbs' specificity for antigens has transformed diagnostics, research, and treatment. Advancements in mAb engineering further enhance their efficacy and half-life. Serving as a cornerstone of innovation, mAbs continue to shape modern medical interventions.
Flow Cytometry: Flow cytometry has played a pivotal role in the antibodies market by enabling rapid and precise analysis of cells and biomolecules. This technology utilizes fluorescently labeled antibodies to identify and quantify specific cell populations, proteins, and molecules in heterogeneous samples. Flow cytometry's ability to simultaneously analyze multiple parameters in thousands of individual cells has revolutionized immunology, cancer research, and drug development.
Segmentation
By Type
By Technology
- Western Blotting
- Flow Cytometry
- ELISA
- Immunohistochemistry
- Immunofluorescence
- Immunoprecipitation
- Others
By Application
- Proteomics
- Drug Development
- Genomics
By End-User
- Pharmaceutical and Biotechnology Companies
- Academic and Research Institutes
By Region
- North America (United States, Canada, Mexico)
- Europe (Germany, France, United Kingdom, Spain, Italy, Others)
- Asia Pacific (China, India, Japan, South Korea, Australia, Others)
- Latin America (Brazil, Argentina, Others)
- Middle East and Africa (Saudi Arabia, UAE, Kuwait, Other Middle East, South Africa, Nigeria, Other Africa)
Key market Players
Leading companies profiled in the study include-
- Merck KGaA
- Agilent Technologies, Inc.
- Becton, Dickinson and Company
- F. Hoffmann-La Roche Ltd
- Cell Signaling Technology, Inc.
- Bio-Rad Laboratories, Inc.
- Beckman Coulter, Inc.
- Thermo Fisher Scientific, Inc.
- GenScript
- Abcam Plc
- PerkinElmer
- QIAGEN
- Affinity Biologicals, Inc.
- Lonza
- Bio Legend
- Danaher Corporation
Antibodies Market Outlook 2023
1 Market Overview
1.1 Introduction to the Antibodies Market
1.2 Scope of the Study
1.3 Research Objective
1.3.1 Key Market Scope and Segments
1.3.2 Players Covered
1.3.3 Years Considered
2 Executive Summary
2.1 2023 Antibodies Industry- Market Statistics
3 Market Dynamics
3.1 Market Drivers
3.2 Market Challenges
3.3 Market Opportunities
3.4 Market Trends
4 Market Factor Analysis
4.1 Porter’s Five Forces
4.2 Market Entropy
4.2.1 Global Antibodies Market Companies with Area Served
4.2.2 Products Offerings Global Antibodies Market
5 COVID-19 Impact Analysis and Outlook Scenarios
5.1.1 Covid-19 Impact Analysis
5.1.2 Post-COVID-19 Scenario- Low Growth Case
5.1.3 Post-COVID-19 Scenario- Reference Growth Case
5.1.4 Post-COVID-19 Scenario- Low Growth Case
6 Global Antibodies Market Trends
6.1 Global Antibodies Revenue (USD Million) and CAGR (%) by Type (2018-2030)
6.2 Global Antibodies Revenue (USD Million) and CAGR (%) by Applications (2018-2030)
6.3 Global Antibodies Revenue (USD Million) and CAGR (%) by Regions (2018-2030)
7 Global Antibodies Market Revenue (USD Million) by Type, and Applications (2018-2022)
7.1 Global Antibodies Revenue (USD Million) by Type (2018-2022)
7.1.1 Global Antibodies Revenue (USD Million), Market Share (%) by Type (2018-2022)
7.2 Global Antibodies Revenue (USD Million) by Applications (2018-2022)
7.2.1 Global Antibodies Revenue (USD Million), Market Share (%) by Applications (2018-2022)
8 Global Antibodies Development Regional Status and Outlook
8.1 Global Antibodies Revenue (USD Million) By Regions (2018-2022)
8.2 North America Antibodies Revenue (USD Million) by Type, and Application (2018-2022)
8.2.1 North America Antibodies Revenue (USD Million) by Country (2018-2022)
8.2.2 North America Antibodies Revenue (USD Million) by Type (2018-2022)
8.2.3 North America Antibodies Revenue (USD Million) by Applications (2018-2022)
8.3 Europe Antibodies Revenue (USD Million), by Type, and Applications (USD Million) (2018-2022)
8.3.1 Europe Antibodies Revenue (USD Million), by Country (2018-2022)
8.3.2 Europe Antibodies Revenue (USD Million) by Type (2018-2022)
8.3.3 Europe Antibodies Revenue (USD Million) by Applications (2018-2022)
8.4 Asia Pacific Antibodies Revenue (USD Million), and Revenue (USD Million) by Type, and Applications (2018-2022)
8.4.1 Asia Pacific Antibodies Revenue (USD Million) by Country (2018-2022)
8.4.2 Asia Pacific Antibodies Revenue (USD Million) by Type (2018-2022)
8.4.3 Asia Pacific Antibodies Revenue (USD Million) by Applications (2018-2022)
8.5 South America Antibodies Revenue (USD Million), by Type, and Applications (2018-2022)
8.5.1 South America Antibodies Revenue (USD Million), by Country (2018-2022)
8.5.2 South America Antibodies Revenue (USD Million) by Type (2018-2022)
8.5.3 South America Antibodies Revenue (USD Million) by Applications (2018-2022)
8.6 Middle East and Africa Antibodies Revenue (USD Million), by Type, Technology, Application, Thickness (2018-2022)
8.6.1 Middle East and Africa Antibodies Revenue (USD Million) by Country (2018-2022)
8.6.2 Middle East and Africa Antibodies Revenue (USD Million) by Type (2018-2022)
8.6.3 Middle East and Africa Antibodies Revenue (USD Million) by Applications (2018-2022)
9 Company Profiles
10 Global Antibodies Market Revenue (USD Million), by Type, and Applications (2023-2030)
10.1 Global Antibodies Revenue (USD Million) and Market Share (%) by Type (2023-2030)
10.1.1 Global Antibodies Revenue (USD Million), and Market Share (%) by Type (2023-2030)
10.2 Global Antibodies Revenue (USD Million) and Market Share (%) by Applications (2023-2030)
10.2.1 Global Antibodies Revenue (USD Million), and Market Share (%) by Applications (2023-2030)
11 Global Antibodies Development Regional Status and Outlook Forecast
11.1 Global Antibodies Revenue (USD Million) By Regions (2023-2030)
11.2 North America Antibodies Revenue (USD Million) by Type, and Applications (2023-2030)
11.2.1 North America Antibodies Revenue (USD) Million by Country (2023-2030)
11.2.2 North America Antibodies Revenue (USD Million), by Type (2023-2030)
11.2.3 North America Antibodies Revenue (USD Million), Market Share (%) by Applications (2023-2030)
11.3 Europe Antibodies Revenue (USD Million), by Type, and Applications (2023-2030)
11.3.1 Europe Antibodies Revenue (USD Million), by Country (2023-2030)
11.3.2 Europe Antibodies Revenue (USD Million), by Type (2023-2030)
11.3.3 Europe Antibodies Revenue (USD Million), by Applications (2023-2030)
11.4 Asia Pacific Antibodies Revenue (USD Million) by Type, and Applications (2023-2030)
11.4.1 Asia Pacific Antibodies Revenue (USD Million), by Country (2023-2030)
11.4.2 Asia Pacific Antibodies Revenue (USD Million), by Type (2023-2030)
11.4.3 Asia Pacific Antibodies Revenue (USD Million), by Applications (2023-2030)
11.5 South America Antibodies Revenue (USD Million), by Type, and Applications (2023-2030)
11.5.1 South America Antibodies Revenue (USD Million), by Country (2023-2030)
11.5.2 South America Antibodies Revenue (USD Million), by Type (2023-2030)
11.5.3 South America Antibodies Revenue (USD Million), by Applications (2023-2030)
11.6 Middle East and Africa Antibodies Revenue (USD Million), by Type, and Applications (2023-2030)
11.6.1 Middle East and Africa Antibodies Revenue (USD Million), by Region (2023-2030)
11.6.2 Middle East and Africa Antibodies Revenue (USD Million), by Type (2023-2030)
11.6.3 Middle East and Africa Antibodies Revenue (USD Million), by Applications (2023-2030)
12 Methodology and Data Sources
12.1 Methodology/Research Approach
12.1.1 Research Programs/Design
12.1.2 Market Size Estimation
12.1.3 Market Breakdown and Data Triangulation
12.2 Data Sources
12.2.1 Secondary Sources
12.2.2 Primary Sources
12.3 Disclaimer
List Of Tables
Table 1 Market Segmentation Analysis
Table 2 Global Antibodies Market Companies with Areas Served
Table 3 Products Offerings Global Antibodies Market
Table 4 Low Growth Scenario Forecasts
Table 5 Reference Case Growth Scenario
Table 6 High Growth Case Scenario
Table 7 Global Antibodies Revenue (USD Million) And CAGR (%) By Type (2018-2030)
Table 8 Global Antibodies Revenue (USD Million) And CAGR (%) By Applications (2018-2030)
Table 9 Global Antibodies Revenue (USD Million) And CAGR (%) By Regions (2018-2030)
Table 10 Global Antibodies Revenue (USD Million) By Type (2018-2022)
Table 11 Global Antibodies Revenue Market Share (%) By Type (2018-2022)
Table 12 Global Antibodies Revenue (USD Million) By Applications (2018-2022)
Table 13 Global Antibodies Revenue Market Share (%) By Applications (2018-2022)
Table 14 Global Antibodies Market Revenue (USD Million) By Regions (2018-2022)
Table 15 Global Antibodies Market Share (%) By Regions (2018-2022)
Table 16 North America Antibodies Revenue (USD Million) By Country (2018-2022)
Table 17 North America Antibodies Revenue (USD Million) By Type (2018-2022)
Table 18 North America Antibodies Revenue (USD Million) By Applications (2018-2022)
Table 19 Europe Antibodies Revenue (USD Million) By Country (2018-2022)
Table 20 Europe Antibodies Revenue (USD Million) By Type (2018-2022)
Table 21 Europe Antibodies Revenue (USD Million) By Applications (2018-2022)
Table 22 Asia Pacific Antibodies Revenue (USD Million) By Country (2018-2022)
Table 23 Asia Pacific Antibodies Revenue (USD Million) By Type (2018-2022)
Table 24 Asia Pacific Antibodies Revenue (USD Million) By Applications (2018-2022)
Table 25 South America Antibodies Revenue (USD Million) By Country (2018-2022)
Table 26 South America Antibodies Revenue (USD Million) By Type (2018-2022)
Table 27 South America Antibodies Revenue (USD Million) By Applications (2018-2022)
Table 28 Middle East and Africa Antibodies Revenue (USD Million) By Region (2018-2022)
Table 29 Middle East and Africa Antibodies Revenue (USD Million) By Type (2018-2022)
Table 30 Middle East and Africa Antibodies Revenue (USD Million) By Applications (2018-2022)
Table 31 Financial Analysis
Table 32 Global Antibodies Revenue (USD Million) By Type (2023-2030)
Table 33 Global Antibodies Revenue Market Share (%) By Type (2023-2030)
Table 34 Global Antibodies Revenue (USD Million) By Applications (2023-2030)
Table 35 Global Antibodies Revenue Market Share (%) By Applications (2023-2030)
Table 36 Global Antibodies Market Revenue (USD Million), And Revenue (USD Million) By Regions (2023-2030)
Table 37 North America Antibodies Revenue (USD)By Country (2023-2030)
Table 38 North America Antibodies Revenue (USD Million) By Type (2023-2030)
Table 39 North America Antibodies Revenue (USD Million) By Applications (2023-2030)
Table 40 Europe Antibodies Revenue (USD Million) By Country (2023-2030)
Table 41 Europe Antibodies Revenue (USD Million) By Type (2023-2030)
Table 42 Europe Antibodies Revenue (USD Million) By Applications (2023-2030)
Table 43 Asia Pacific Antibodies Revenue (USD Million) By Country (2023-2030)
Table 44 Asia Pacific Antibodies Revenue (USD Million) By Type (2023-2030)
Table 45 Asia Pacific Antibodies Revenue (USD Million) By Applications (2023-2030)
Table 46 South America Antibodies Revenue (USD Million) By Country (2023-2030)
Table 47 South America Antibodies Revenue (USD Million) By Type (2023-2030)
Table 48 South America Antibodies Revenue (USD Million) By Applications (2023-2030)
Table 49 Middle East and Africa Antibodies Revenue (USD Million) By Region (2023-2030)
Table 50 Middle East and Africa Antibodies Revenue (USD Million) By Region (2023-2030)
Table 51 Middle East and Africa Antibodies Revenue (USD Million) By Type (2023-2030)
Table 52 Middle East and Africa Antibodies Revenue (USD Million) By Applications (2023-2030)
Table 53 Research Programs/Design for This Report
Table 54 Key Data Information from Secondary Sources
Table 55 Key Data Information from Primary Sources
List Of Figures
Figure 1 Market Scope
Figure 2 Porter’s Five Forces
Figure 3 Global Antibodies Revenue (USD Million) By Type (2018-2022)
Figure 4 Global Antibodies Revenue Market Share (%) By Type (2022)
Figure 5 Global Antibodies Revenue (USD Million) By Applications (2018-2022)
Figure 6 Global Antibodies Revenue Market Share (%) By Applications (2022)
Figure 7 Global Antibodies Market Revenue (USD Million) By Regions (2018-2022)
Figure 8 Global Antibodies Market Share (%) By Regions (2022)
Figure 9 North America Antibodies Revenue (USD Million) By Country (2018-2022)
Figure 10 North America Antibodies Revenue (USD Million) By Type (2018-2022)
Figure 11 North America Antibodies Revenue (USD Million) By Applications (2018-2022)
Figure 12 Europe Antibodies Revenue (USD Million) By Country (2018-2022)
Figure 13 Europe Antibodies Revenue (USD Million) By Type (2018-2022)
Figure 14 Europe Antibodies Revenue (USD Million) By Applications (2018-2022)
Figure 15 Asia Pacific Antibodies Revenue (USD Million) By Country (2018-2022)
Figure 16 Asia Pacific Antibodies Revenue (USD Million) By Type (2018-2022)
Figure 17 Asia Pacific Antibodies Revenue (USD Million) By Applications (2018-2022)
Figure 18 South America Antibodies Revenue (USD Million) By Country (2018-2022)
Figure 19 South America Antibodies Revenue (USD Million) By Type (2018-2022)
Figure 20 South America Antibodies Revenue (USD Million) By Applications (2018-2022)
Figure 21 Middle East and Africa Antibodies Revenue (USD Million) By Region (2018-2022)
Figure 22 Middle East and Africa Antibodies Revenue (USD Million) By Type (2018-2022)
Figure 23 Middle East and Africa Antibodies Revenue (USD Million) By Applications (2018-2022)
Figure 24 Global Antibodies Revenue (USD Million) By Type (2023-2030)
Figure 25 Global Antibodies Revenue Market Share (%) By Type (2030)
Figure 26 Global Antibodies Revenue (USD Million) By Applications (2023-2030)
Figure 27 Global Antibodies Revenue Market Share (%) By Applications (2030)
Figure 28 Global Antibodies Market Revenue (USD Million) By Regions (2023-2030)
Figure 29 North America Antibodies Revenue (USD Million) By Country (2023-2030)
Figure 30 North America Antibodies Revenue (USD Million) By Type (2023-2030)
Figure 31 North America Antibodies Revenue (USD Million) By Applications (2023-2030)
Figure 32 Europe Antibodies Revenue (USD Million) By Country (2023-2030)
Figure 33 Europe Antibodies Revenue (USD Million) By Type (2023-2030)
Figure 34 Europe Antibodies Revenue (USD Million) By Applications (2023-2030)
Figure 35 Asia Pacific Antibodies Revenue (USD Million) By Country (2023-2030)
Figure 36 Asia Pacific Antibodies Revenue (USD Million) By Type (2023-2030)
Figure 37 Asia Pacific Antibodies Revenue (USD Million) By Applications (2023-2030)
Figure 38 South America Antibodies Revenue (USD Million) By Country (2023-2030)
Figure 39 South America Antibodies Revenue (USD Million) By Type (2023-2030)
Figure 40 South America Antibodies Revenue (USD Million) By Applications (2023-2030)
Figure 41 Middle East and Africa Antibodies Revenue (USD Million) By Region (2023-2030)
Figure 42 Middle East and Africa Antibodies Revenue (USD Million) By Region (2023-2030)
Figure 43 Middle East and Africa Antibodies Revenue (USD Million) By Type (2023-2030)
Figure 44 Middle East and Africa Antibodies Revenue (USD Million) By Applications (2023-2030)
Figure 45 Bottom-Up and Top-Down Approaches For This Report
Figure 46 Data Triangulation
