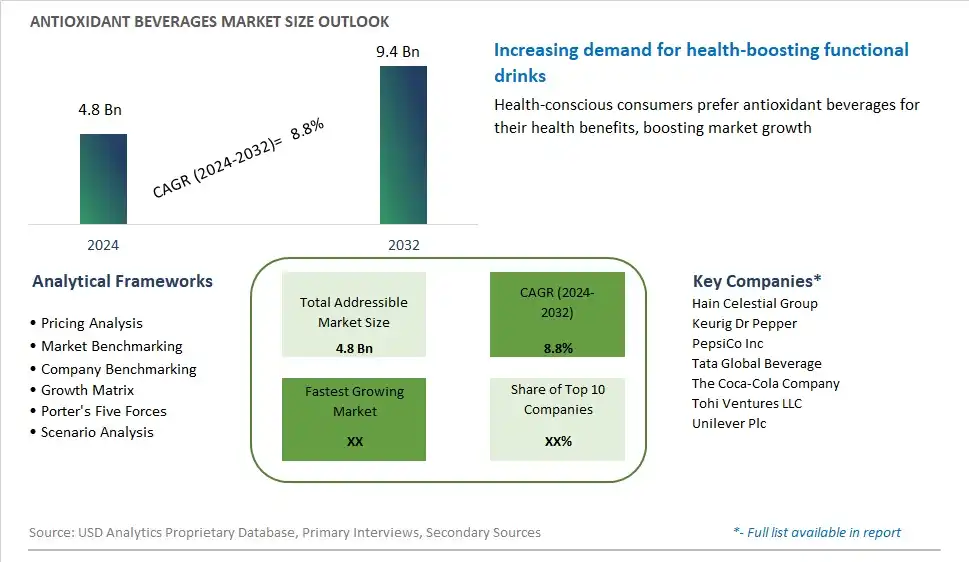
Global Antioxidant Beverages Market Size is valued at $4.8 Billion in 2024 and is forecast to register a growth rate (CAGR) of 8.8% to reach $9.4 Billion by 2032.
The global Antioxidant Beverages Market Comprehensive Study analyzes and forecasts the market size across 6 regions and 24 countries for diverse segments -By Type (Green Tea, Antioxidant-Rich Fruits, Vegetable-Based Beverages, Others), By Distribution Channel (Supermarkets/Hypermarkets, Specialty Stores, Online Retail Stores, Others)
An Introduction to Antioxidant Beverages Market
The antioxidant beverages market in 2024 reflects a growing consumer demand for functional and health-enhancing drinks formulated with natural antioxidants to combat oxidative stress and promote overall well-being. Antioxidants, found abundantly in fruits, vegetables, teas, and herbs, play a crucial role in neutralizing free radicals and reducing the risk of chronic diseases. With increasing health consciousness and interest in preventive nutrition, there's a rising preference for beverages fortified with antioxidant-rich ingredients such as vitamins C and E, polyphenols, flavonoids, and superfoods like berries, pomegranate, and green tea. Manufacturers are innovating with formulations, flavors, and packaging to cater to diverse consumer preferences and lifestyle needs, offering a range of options including ready-to-drink juices, teas, functional waters, and smoothies. Moreover, the convergence of health and sustainability trends is driving demand for organic, non-GMO, and clean-label antioxidant beverages, free from artificial additives and preservatives. As consumers seek convenient and enjoyable ways to support their health goals, the antioxidant beverages market is poised for continued growth and innovation in 2024, with opportunities for product differentiation and market expansion across demographics.
Antioxidant Beverages Competitive Landscape
The market report analyses the leading companies in the industry including Hain Celestial Group, Keurig Dr Pepper, PepsiCo Inc, Tata Global Beverage, The Coca-Cola Company, Tohi Ventures LLC, Unilever Plc, and Others.
Antioxidant Beverages Market Dynamics
Antioxidant Beverages Market Trend: Increasing Consumer Demand for Health and Wellness Products
A significant trend in the antioxidant beverages market is the increasing consumer demand for health and wellness products. As individuals become more health-conscious and seek preventive measures to support their well-being, there is a growing interest in beverages fortified with antioxidants. Antioxidants, such as vitamins C and E, polyphenols, and flavonoids, are known for their potential health benefits, including reducing oxidative stress, supporting immune function, and promoting overall health. This trend is driven by the desire for functional beverages that offer both hydration and nutritional value, as well as the growing awareness of the role of antioxidants in maintaining optimal health and preventing chronic diseases. As consumers prioritize wellness and seek out products that align with their health goals, there is a rising demand for antioxidant beverages across various demographic segments.
Market Driver: Health and Nutritional Benefits
A key driver shaping the antioxidant beverages market is the recognition of their health and nutritional benefits. Antioxidants are compounds that help neutralize harmful free radicals in the body, which can contribute to oxidative damage and increase the risk of chronic diseases such as heart disease, cancer, and aging-related conditions. Beverages fortified with antioxidants offer consumers a convenient and enjoyable way to incorporate these health-promoting compounds into their diet, providing hydration along with potential health benefits. This driver is fueled by increasing consumer awareness of the importance of nutrition in disease prevention and wellness promotion, as well as the influence of health and nutrition trends on purchasing decisions. As consumers seek out functional beverages that offer tangible health benefits, there is a growing demand for antioxidant-rich options in the market.
Market Opportunity: Innovation in Formulations and Flavors
An opportunity for growth in the antioxidant beverages market lies in innovation in formulations and flavors. Manufacturers can capitalize on the demand for antioxidant-rich beverages by developing innovative formulations that offer a combination of antioxidants, vitamins, minerals, and other bioactive compounds known for their health-promoting properties. This includes incorporating a diverse range of antioxidant sources such as berries, citrus fruits, green tea, and botanical extracts into beverage formulations to create unique flavor profiles and functional benefits. Additionally, there is opportunity for innovation in packaging formats, such as ready-to-drink bottles, cans, pouches, and single-serve options, to cater to consumer preferences for convenience and portability. By leveraging innovative ingredients, formulations, and packaging, manufacturers can differentiate their products, appeal to a wider audience, and capture new opportunities in the growing antioxidant beverages market.
Antioxidant Beverages Market Share Analysis: Green Tea held the dominant market share in 2024
The Green Tea segment stands as the largest within the Antioxidant Beverages Market owing to its long-standing reputation as a potent source of antioxidants and its widespread consumption globally. Green tea is rich in polyphenols, particularly catechins such as epigallocatechin gallate (EGCG), which are known for their powerful antioxidant properties. These antioxidants help neutralize free radicals in the body, reducing oxidative stress and supporting overall health. Additionally, green tea has been associated with numerous health benefits, including improved cardiovascular health, enhanced metabolism, and potential cancer-fighting properties. Its popularity as a functional beverage choice further contributes to its dominance in the Antioxidant Beverages Market. Further, with increasing consumer awareness of the health benefits of antioxidants and the growing demand for natural and functional beverages, the Green Tea segment continues to thrive as the preferred choice among health-conscious consumers seeking antioxidant-rich hydration options.
Antioxidant Beverages Market Share Analysis: Online Retail Stores market is poised to register the fastest growth rae over the forecast period to 2032
The Online Retail Stores segment within the Antioxidant Beverages Market is the fastest-growing, fueled by the increasing consumer shift towards e-commerce platforms and the convenience of online shopping. With the rise of digitalization and the proliferation of online shopping options, consumers are increasingly turning to online retail stores to purchase antioxidant beverages. Online channels offer a wide selection of products, including a variety of antioxidant-rich beverages, with the added convenience of doorstep delivery. Additionally, the COVID-19 pandemic has accelerated the adoption of online shopping as consumers prioritize safety and contactless transactions. Furthermore, online retail stores provide opportunities for personalized recommendations, subscription services, and targeted marketing efforts, catering to the diverse preferences of health-conscious consumers seeking convenient and accessible options for antioxidant-rich beverages. As a result, the Online Retail Stores segment of the Antioxidant Beverages Market is experiencing rapid growth, reshaping the landscape of consumer purchasing habits and driving innovation in digital marketing strategies within the functional beverage industry.
Antioxidant Beverages Market Segmentation
By Type
Green Tea
Antioxidant-Rich Fruits
Vegetable-Based Beverages
Others
By Distribution Channel
Supermarkets/Hypermarkets
Specialty Stores
Online Retail Stores
Others
Countries Analyzed
North America (US, Canada, Mexico)
Europe (Germany, UK, France, Spain, Italy, Russia, Rest of Europe)
Asia Pacific (China, India, Japan, South Korea, Australia, South East Asia, Rest of Asia)
South America (Brazil, Argentina, Rest of South America)
Middle East and Africa (Saudi Arabia, UAE, Rest of Middle East, South Africa, Egypt, Rest of Africa)
Antioxidant Beverages Companies Profiled in the Study
Hain Celestial Group
Keurig Dr Pepper
PepsiCo Inc
Tata Global Beverage
The Coca-Cola Company
Tohi Ventures LLC
Unilever Plc
*- List Not Exhaustive
Chapter 1. TABLE OF CONTENTS
Chapter 2. Introduction to Antioxidant Beverages Market
2.1. Market Overview
2.2. Key Statistics and Report Highlights
2.3. Scope of the Comprehensive Study
2.3.1. Market Definition
2.3.2 Countries and Regions Covered
2.3.3 Research Objective
2.3.4 Units, Currency, and Conversions
2.3.5 Industry Value Chain
2.4. Key Market Segments
2.5. Key Companies
2.6. Study Period
Chapter 3. Strategic Analysis Review
3.1. Antioxidant Beverages Pricing Analysis and Forecast
3.2. Porter’s Five Forces
3.3. Market Ecosystem
3.4. SWOT Analysis
3.5. Regulatory Scenario
3.3. Effects of Inflation, Russia-Ukraine War, moderating economic growth, and other macroeconomic factors
Chapter 4. Competitive Landscape
4.1. Market Share Analysis
4.1.1. Global Antioxidant Beverages Market Share by Company, 2023
4.1.2. Product Offerings of Leading Antioxidant Beverages Companies
4.2. Market Entropy
4.2.1. New Product Launches in the Industry
4.2.2. Mergers, Acquisitions, Joint ventures, and Partnerships
4.3. Key Strategies and Best Practices
Chapter 5. Global Market Projections: Best, Reference, and Low Case Scenarios
5.1. Growth Analysis- Case Scenario Definitions
5.2. Low Growth Case Scenario Forecasts
5.3. Reference Growth Case Scenario Forecasts
5.4. High Growth Case Scenario Forecasts
Chapter 6. Market Dynamics
6.1. Antioxidant Beverages Market Drivers
6.2. Antioxidant Beverages Market Challenges
6.6. Antioxidant Beverages Market Opportunities
6.4. Antioxidant Beverages Market Trends
Chapter 7. Global Antioxidant Beverages Market Outlook Trends
7.1. Global Antioxidant Beverages Revenue (USD Million) and CAGR (%) by Type (2021-2032)
7.2. Global Antioxidant Beverages Revenue (USD Million) and CAGR (%) by Application (2021-2032)
7.3. Global Antioxidant Beverages Revenue (USD Million) and CAGR (%) by Product (2021-2032)
By Type
Green Tea
Antioxidant-Rich Fruits
Vegetable-Based Beverages
Others
By Distribution Channel
Supermarkets/Hypermarkets
Specialty Stores
Online Retail Stores
Others
Chapter 8. Global Antioxidant Beverages Regional Analysis and Outlook
8.1. Global Antioxidant Beverages Revenue (USD Million) By Regions (2021- 2032)
8.2. North America Antioxidant Beverages Revenue (USD Million) by Country (2021-2032)
8.2.1. United States Antioxidant Beverages Regional Analysis and Outlook
8.2.2. Canada Antioxidant Beverages Regional Analysis and Outlook
8.2.3. Mexico Antioxidant Beverages Regional Analysis and Outlook
8.3. Europe Antioxidant Beverages Revenue (USD Million), by Country (2021-2032)
8.3.1. Germany Antioxidant Beverages Regional Analysis and Outlook
8.3.2. France Antioxidant Beverages Regional Analysis and Outlook
8.3.3. United Kingdom Antioxidant Beverages Regional Analysis and Outlook
8.3.4. Spain Antioxidant Beverages Regional Analysis and Outlook
8.3.5. Italy Antioxidant Beverages Regional Analysis and Outlook
8.3.6. Russia Antioxidant Beverages Regional Analysis and Outlook
8.3.7. Rest of Europe Antioxidant Beverages Regional Analysis and Outlook
8.4. Asia Pacific Antioxidant Beverages Revenue (USD Million) by Country (2021-2032)
8.4.1. China Antioxidant Beverages Regional Analysis and Outlook
8.4.2. Japan Antioxidant Beverages Regional Analysis and Outlook
8.4.3. India Antioxidant Beverages Regional Analysis and Outlook
8.4.4. South Korea Antioxidant Beverages Regional Analysis and Outlook
8.4.5. Australia Antioxidant Beverages Regional Analysis and Outlook
8.4.6. South East Asia Antioxidant Beverages Regional Analysis and Outlook
8.4.7. Rest of Asia Pacific Antioxidant Beverages Regional Analysis and Outlook
8.5. South America Antioxidant Beverages Revenue (USD Million), by Country (2021-2032)
8.5.1. Brazil Antioxidant Beverages Regional Analysis and Outlook
8.5.2. Argentina Antioxidant Beverages Regional Analysis and Outlook
8.5.3. Rest of South America Antioxidant Beverages Regional Analysis and Outlook
8.6. Middle East and Africa Antioxidant Beverages Revenue (USD Million) by Country (2021-2032)
8.6.1. Middle East Antioxidant Beverages Regional Analysis and Outlook
8.6.2. Africa Antioxidant Beverages Regional Analysis and Outlook
Chapter 9. North America Antioxidant Beverages Analysis and Outlook
9.1. North America Antioxidant Beverages Revenue (USD Million) by Segments (2021-2032)
9.1.1. North America Antioxidant Beverages Revenue (USD Million) by Type (2021-2032)
9.1.2. North America Antioxidant Beverages Revenue (USD Million) by Application (2021-2032)
9.1.3. North America Antioxidant Beverages Revenue (USD Million) by Product (2021-2032)
By Type
Green Tea
Antioxidant-Rich Fruits
Vegetable-Based Beverages
Others
By Distribution Channel
Supermarkets/Hypermarkets
Specialty Stores
Online Retail Stores
Others
Chapter 10. Europe Antioxidant Beverages Analysis and Outlook
10.1. Europe Antioxidant Beverages Revenue (USD Million), by Segments (USD Million) (2021-2032)
10.1.1. Europe Antioxidant Beverages Revenue (USD Million) by Type (2021-2032)
10.1.2. Europe Antioxidant Beverages Revenue (USD Million) by Application (2021-2032)
10.1.3. Europe Antioxidant Beverages Revenue (USD Million) by Product (2021-2032)
By Type
Green Tea
Antioxidant-Rich Fruits
Vegetable-Based Beverages
Others
By Distribution Channel
Supermarkets/Hypermarkets
Specialty Stores
Online Retail Stores
Others
Chapter 11. Asia Pacific Antioxidant Beverages Analysis and Outlook
11.1. Asia Pacific Antioxidant Beverages Revenue (USD Million), and Revenue (USD Million) by Segments (2021-2032)
11.1.1. Asia Pacific Antioxidant Beverages Revenue (USD Million) by Type (2021-2032)
11.1.2. Asia Pacific Antioxidant Beverages Revenue (USD Million) by Application (2021-2032)
11.1.3. Asia Pacific Antioxidant Beverages Revenue (USD Million) by Product (2021-2032)
By Type
Green Tea
Antioxidant-Rich Fruits
Vegetable-Based Beverages
Others
By Distribution Channel
Supermarkets/Hypermarkets
Specialty Stores
Online Retail Stores
Others
Chapter 12. South America Antioxidant Beverages Analysis and Outlook
12.1. South America Antioxidant Beverages Revenue (USD Million), by Segments (2021-2032)
12.1.1. South America Antioxidant Beverages Revenue (USD Million) by Type (2021-2032)
12.1.2. South America Antioxidant Beverages Revenue (USD Million) by Application (2021-2032)
12.1.3. South America Antioxidant Beverages Revenue (USD Million) by Product (2021-2032)
By Type
Green Tea
Antioxidant-Rich Fruits
Vegetable-Based Beverages
Others
By Distribution Channel
Supermarkets/Hypermarkets
Specialty Stores
Online Retail Stores
Others
Chapter 13. Middle East and Africa Antioxidant Beverages Analysis and Outlook
13.1. Middle East and Africa Antioxidant Beverages Revenue (USD Million), by Segments (2021-2032)
13.1.1. Middle East and Africa Antioxidant Beverages Revenue (USD Million) by Type (2021-2032)
13.1.2. Middle East and Africa Antioxidant Beverages Revenue (USD Million) by Application (2021-2032)
13.1.3. Middle East and Africa Antioxidant Beverages Revenue (USD Million) by Product (2021-2032)
By Type
Green Tea
Antioxidant-Rich Fruits
Vegetable-Based Beverages
Others
By Distribution Channel
Supermarkets/Hypermarkets
Specialty Stores
Online Retail Stores
Others
Chapter 14. Antioxidant Beverages Company Profiles
14.1 Business Overview
14.2 Product Profiles
14.3 SWOT Profiles
14.5 Recent Developments
14.6 Financial Profile
List of Companies
Hain Celestial Group
Keurig Dr Pepper
PepsiCo Inc
Tata Global Beverage
The Coca-Cola Company
Tohi Ventures LLC
Unilever Plc
15. Methodology and Data Sources
15.1 Customization Offerings
15.2 Subscription Services
15.3 Related Reports
15.4 Publisher Expertise
LIST OF TABLES
Table 1 Market Segmentation Analysis
Table 2 Global Antioxidant Beverages Market Share of Leading Companies, 2023
Table 3 Product Offerings of Leading Companies
Table 4 Low Growth Scenario Forecasts
Table 5 Reference Case Growth Scenario
Table 6 High Growth Case Scenario
Table 7 Global Antioxidant Beverages Revenue (USD Million) And CAGR (%) By Type (2021-2032)
Table 8 Global Antioxidant Beverages Revenue (USD Million) And CAGR (%) By Application (2021-2032)
Table 9 Global Antioxidant Beverages Revenue (USD Million) And CAGR (%) By Product (2021-2032)
Table 10 Global Antioxidant Beverages Market Revenue (USD Million) By Regions (2021-2032)
Table 11 Global Antioxidant Beverages Market Share (%) By Regions (2021-2032)
Table 12 North America Antioxidant Beverages Revenue (USD Million) By Country (2021-2032)
Table 13 Europe Antioxidant Beverages Revenue (USD Million) By Country (2021-2032)
Table 14 Asia Pacific Antioxidant Beverages Revenue (USD Million) By Country (2021-2032)
Table 15 South America Antioxidant Beverages Revenue (USD Million) By Country (2021-2032)
Table 16 Middle East and Africa Antioxidant Beverages Revenue (USD Million) By Region (2021-2032)
Table 17 North America Antioxidant Beverages Revenue (USD Million) By Type (2021-2032)
Table 18 North America Antioxidant Beverages Revenue (USD Million) By Application (2021-2032)
Table 19 North America Antioxidant Beverages Revenue (USD Million) By Product (2021-2032)
Table 20 Europe Antioxidant Beverages Revenue (USD Million) By Type (2021-2032)
Table 21 Europe Antioxidant Beverages Revenue (USD Million) By Application (2021-2032)
Table 22 Europe Antioxidant Beverages Revenue (USD Million) By Product (2021-2032)
Table 23 Asia Pacific Antioxidant Beverages Revenue (USD Million) By Type (2021-2032)
Table 24 Asia Pacific Antioxidant Beverages Revenue (USD Million) By Application (2021-2032)
Table 25 Asia Pacific Antioxidant Beverages Revenue (USD Million) By Product (2021-2032)
Table 26 South America Antioxidant Beverages Revenue (USD Million) By Type (2021-2032)
Table 27 South America Antioxidant Beverages Revenue (USD Million) By Application (2021-2032)
Table 28 South America Antioxidant Beverages Revenue (USD Million) By Product (2021-2032)
Table 29 Middle East and Africa Antioxidant Beverages Revenue (USD Million) By Type (2021-2032)
Table 30 Middle East and Africa Antioxidant Beverages Revenue (USD Million) By Application (2021-2032)
Table 31 Middle East and Africa Antioxidant Beverages Revenue (USD Million) By Product (2021-2032)
LIST OF FIGURES
Figure 1. Market Scope
Figure 2. Pricing Forecasts Per Unit, 2023- 2032
Figure 3. Porter’s Five Forces
Figure 4. Global Antioxidant Beverages Market Revenue (USD Million) By Regions (2021-2032)
Figure 5. Global Antioxidant Beverages Market Share (%) By Regions (2023)
Figure 6. North America Antioxidant Beverages Revenue (USD Million) By Country (2021-2032)
Figure 7. United States Antioxidant Beverages Revenue (USD Million) By Country (2021-2032)
Figure 8. Canada Antioxidant Beverages Revenue (USD Million) By Country (2021-2032)
Figure 9. Mexico Antioxidant Beverages Revenue (USD Million) By Country (2021-2032)
Figure 10. Europe Antioxidant Beverages Revenue (USD Million) By Country (2021-2032)
Figure 11. Germany Antioxidant Beverages Revenue (USD Million) By Country (2021-2032)
Figure 12. France Antioxidant Beverages Revenue (USD Million) By Country (2021-2032)
Figure 13. United Kingdom Antioxidant Beverages Revenue (USD Million) By Country (2021-2032)
Figure 14. Spain Antioxidant Beverages Revenue (USD Million) By Country (2021-2032)
Figure 15. Italy Antioxidant Beverages Revenue (USD Million) By Country (2021-2032)
Figure 16. Russia Antioxidant Beverages Revenue (USD Million) By Country (2021-2032)
Figure 17. Rest of Europe Antioxidant Beverages Revenue (USD Million) By Country (2021-2032)
Figure 11. Asia Pacific Antioxidant Beverages Revenue (USD Million) By Country (2021-2032)
Figure 12. China Antioxidant Beverages Revenue (USD Million) By Country (2021-2032)
Figure 13. Japan Antioxidant Beverages Revenue (USD Million) By Country (2021-2032)
Figure 14. India Antioxidant Beverages Revenue (USD Million) By Country (2021-2032)
Figure 15. South Korea Antioxidant Beverages Revenue (USD Million) By Country (2021-2032)
Figure 16. Australia Antioxidant Beverages Revenue (USD Million) By Country (2021-2032)
Figure 17. South East Asia Antioxidant Beverages Revenue (USD Million) By Country (2021-2032)
Figure 18. South America Antioxidant Beverages Revenue (USD Million) By Country (2021-2032)
Figure 19. Brazil Antioxidant Beverages Revenue (USD Million) By Country (2021-2032)
Figure 20. Argentina Antioxidant Beverages Revenue (USD Million) By Country (2021-2032)
Figure 21. Rest of Asia Pacific Antioxidant Beverages Revenue (USD Million) By Country (2021-2032)
Figure 22. Middle East and Africa Antioxidant Beverages Revenue (USD Million) By Region (2021-2032)
Figure 23. Saudi Arabia Antioxidant Beverages Revenue (USD Million) By Region (2021-2032)
Figure 24. The UAE Antioxidant Beverages Revenue (USD Million) By Region (2021-2032)
Figure 25. Rest of Middle East Antioxidant Beverages Revenue (USD Million) By Region (2021-2032)
Figure 26. South Africa Antioxidant Beverages Revenue (USD Million) By Region (2021-2032)
Figure 27. Africa Antioxidant Beverages Revenue (USD Million) By Region (2021-2032)
Figure 28. North America Antioxidant Beverages Revenue (USD Million) By Type (2021-2032)
Figure 29. North America Antioxidant Beverages Revenue (USD Million) By Application (2021-2032)
Figure 30. North America Antioxidant Beverages Revenue (USD Million) By Product (2021-2032)
Figure 31. Europe Antioxidant Beverages Revenue (USD Million) By Type (2021-2032)
Figure 32. Europe Antioxidant Beverages Revenue (USD Million) By Application (2021-2032)
Figure 33. Europe Antioxidant Beverages Revenue (USD Million) By Product (2021-2032)
Figure 34. Asia Pacific Antioxidant Beverages Revenue (USD Million) By Type (2021-2032)
Figure 35. Asia Pacific Antioxidant Beverages Revenue (USD Million) By Application (2021-2032)
Figure 36. Asia Pacific Antioxidant Beverages Revenue (USD Million) By Product (2021-2032)
Figure 37. South America Antioxidant Beverages Revenue (USD Million) By Type (2021-2032)
Figure 38. South America Antioxidant Beverages Revenue (USD Million) By Application (2021-2032)
Figure 39. South America Antioxidant Beverages Revenue (USD Million) By Product (2021-2032)
Figure 40. Middle East and Africa Antioxidant Beverages Revenue (USD Million) By Type (2021-2032)
Figure 41. Middle East and Africa Antioxidant Beverages Revenue (USD Million) By Application (2021-2032)
Figure 42. Middle East and Africa Antioxidant Beverages Revenue (USD Million) By Product (2021-2032)
By Type
Green Tea
Antioxidant-Rich Fruits
Vegetable-Based Beverages
Others
By Distribution Channel
Supermarkets/Hypermarkets
Specialty Stores
Online Retail Stores
Others
Countries Analyzed
North America (US, Canada, Mexico)
Europe (Germany, UK, France, Spain, Italy, Russia, Rest of Europe)
Asia Pacific (China, India, Japan, South Korea, Australia, South East Asia, Rest of Asia)
South America (Brazil, Argentina, Rest of South America)
Middle East and Africa (Saudi Arabia, UAE, Rest of Middle East, South Africa, Egypt, Rest of Africa)
