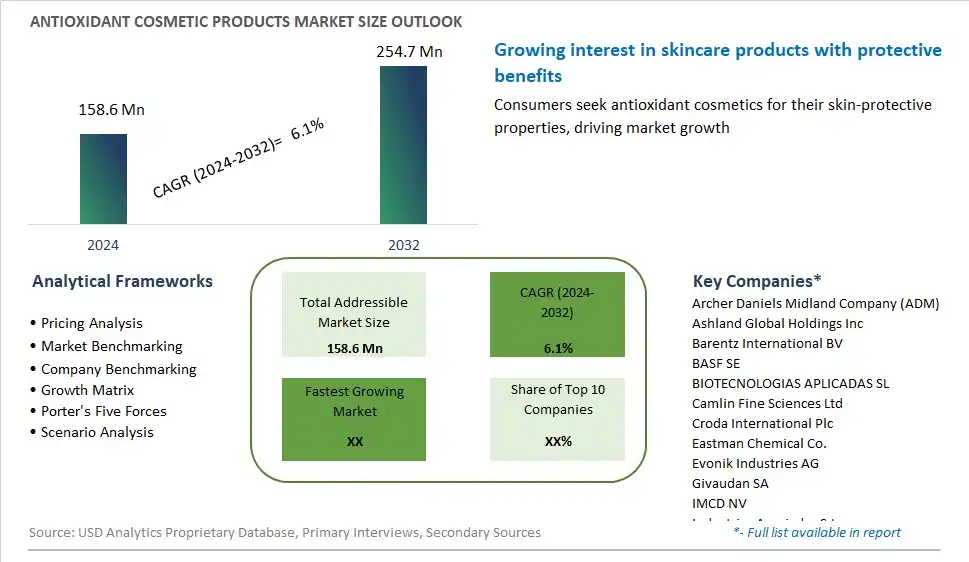
Global Antioxidant Cosmetic Products Market Size is valued at $158.6 Million in 2024 and is forecast to register a growth rate (CAGR) of 6.1% to reach $254.7 Million by 2032.
The global Antioxidant Cosmetic Products Market Comprehensive Study analyzes and forecasts the market size across 6 regions and 24 countries for diverse segments -By Application (Skincare, Haircare, Color cosmetics), By Distribution Channel (Offline, Online)
An Introduction to Antioxidant Cosmetic Products Market
The antioxidant cosmetic products market in 2024 is thriving as consumers increasingly prioritize skincare solutions that offer protection against environmental stressors and promote skin health and vitality. Antioxidants, renowned for their ability to neutralize free radicals and mitigate oxidative damage, have become sought-after ingredients in a wide range of skincare formulations. From serums and moisturizers to facial masks and sunscreens, cosmetic manufacturers are incorporating antioxidants such as vitamins C and E, coenzyme Q10, resveratrol, and green tea extract into their products to address various skin concerns, including premature aging, dullness, and hyperpigmentation. Moreover, advancements in cosmetic science have led to the development of stable and bioavailable forms of antioxidants, ensuring optimal efficacy and penetration into the skin. With growing awareness of the link between environmental exposure and skin aging, there's a rising demand for antioxidant-rich cosmetics that offer protection against UV radiation, pollution, and other external aggressors. As consumers seek skincare solutions that deliver visible results and long-term benefits, the antioxidant cosmetic products market is poised for continued growth and innovation in 2024, with opportunities for personalized formulations and targeted treatments tailored to individual skin needs.
Antioxidant Cosmetic Products Competitive Landscape
The market report analyses the leading companies in the industry including Archer Daniels Midland Company (ADM), Ashland Global Holdings Inc, Barentz International BV, BASF SE, BIOTECNOLOGIAS APLICADAS SL, Camlin Fine Sciences Ltd, Croda International Plc, Eastman Chemical Co., Evonik Industries AG, Givaudan SA, IMCD NV, Industrias Asociadas S.L., Koninklijke DSM NV, L’Oréal S.A., Lonza Group Ltd, and Others.
Antioxidant Cosmetic Products Market Dynamics
Antioxidant Cosmetic Products Market Trend: Shift Towards Clean Beauty and Natural Ingredients
A significant trend in the antioxidant cosmetic products market is the shift towards clean beauty and natural ingredients. As consumers become more conscious of the ingredients in their skincare and makeup products, there is a growing demand for cosmetics formulated with antioxidants and other natural, plant-based ingredients. Antioxidants, such as vitamins C and E, green tea extract, and grapeseed oil, are valued for their ability to protect the skin from environmental damage, reduce signs of aging, and promote overall skin health. This trend is driven by the desire for safer, more sustainable beauty options that align with ethical and environmental values, reflecting evolving consumer preferences towards clean, transparent, and eco-friendly beauty products.
Market Driver: Rising Awareness of Skin Health and Aging Concerns
A key driver shaping the antioxidant cosmetic products market is the rising awareness of skin health and aging concerns. With growing concerns over environmental pollution, UV radiation, and lifestyle factors that contribute to premature aging, consumers are seeking skincare and makeup solutions that offer protection and prevention against visible signs of aging, such as wrinkles, fine lines, and hyperpigmentation. Antioxidant-rich cosmetic products are perceived as effective tools for combating oxidative stress, neutralizing free radicals, and maintaining youthful-looking skin. This driver is fueled by the desire to achieve and maintain healthy, radiant skin at any age, as well as the influence of social media, beauty influencers, and marketing campaigns promoting the benefits of antioxidant skincare and makeup products.
Market Opportunity: Innovation in Formulations and Product Categories
An opportunity for growth in the antioxidant cosmetic products market lies in innovation in formulations and product categories. Manufacturers can capitalize on the demand for antioxidant-rich cosmetics by developing innovative formulations that combine skincare and makeup benefits, offering multifunctional products that deliver both color and care. This includes antioxidant-infused foundations, BB creams, tinted moisturizers, lipsticks, and eyeshadows that provide long-lasting color payoff while nourishing and protecting the skin. Additionally, there is opportunity for expansion into new product categories such as antioxidant serums, facial oils, masks, and mists, offering consumers a comprehensive skincare regimen that targets oxidative stress and supports overall skin health. By embracing innovation and offering diverse product options that cater to various skin concerns and preferences, manufacturers can unlock new opportunities and drive growth in the antioxidant cosmetic products market.
Antioxidant Cosmetic Products Market Share Analysis: Skincare held the dominant market share in 2024
The Skincare segment stands as the largest within the Antioxidant Cosmetic Products Market due to the widespread recognition of antioxidants' benefits for maintaining healthy and youthful-looking skin. Antioxidant-rich skincare products, including serums, moisturizers, and cleansers, are formulated with potent ingredients such as vitamins C and E, green tea extract, and niacinamide, known for their ability to neutralize free radicals and protect the skin from environmental damage. These products are highly sought after by consumers seeking solutions for various skincare concerns, including aging, hyperpigmentation, and inflammation. Further, the skincare routine has become an integral part of daily self-care rituals for many individuals, further driving the demand for antioxidant-infused products to address a wide range of skin concerns. Additionally, the rising consumer awareness of the importance of preventive skincare and the growing preference for natural and clean beauty products contribute to the dominance of the Skincare segment in the Antioxidant Cosmetic Products Market.
Antioxidant Cosmetic Products Market Share Analysis: Online market is poised to register the fastest growth rae over the forecast period to 2032
The Online segment within the Antioxidant Cosmetic Products Market is the fastest-growing, driven by the increasing prevalence of e-commerce platforms and the convenience of online shopping for beauty products. Consumers are increasingly turning to online channels to purchase antioxidant cosmetic products due to the ease of browsing, extensive product variety, and access to customer reviews and recommendations. Additionally, the COVID-19 pandemic has accelerated the adoption of online shopping as consumers prioritize safety and social distancing measures. Furthermore, the online space provides opportunities for personalized recommendations, virtual consultations, and targeted marketing efforts, catering to the diverse needs and preferences of consumers seeking antioxidant-infused beauty products. As a result, the Online segment of the Antioxidant Cosmetic Products Market is experiencing rapid growth, reshaping the beauty industry landscape and driving innovation in digital marketing strategies.
Antioxidant Cosmetic Products Market Segmentation
By Application
Skincare
Haircare
Color cosmetics
By Distribution Channel
Offline
Online
Countries Analyzed
North America (US, Canada, Mexico)
Europe (Germany, UK, France, Spain, Italy, Russia, Rest of Europe)
Asia Pacific (China, India, Japan, South Korea, Australia, South East Asia, Rest of Asia)
South America (Brazil, Argentina, Rest of South America)
Middle East and Africa (Saudi Arabia, UAE, Rest of Middle East, South Africa, Egypt, Rest of Africa)
Antioxidant Cosmetic Products Companies Profiled in the Study
Archer Daniels Midland Company (ADM)
Ashland Global Holdings Inc
Barentz International BV
BASF SE
BIOTECNOLOGIAS APLICADAS SL
Camlin Fine Sciences Ltd
Croda International Plc
Eastman Chemical Co.
Evonik Industries AG
Givaudan SA
IMCD NV
Industrias Asociadas S.L.
Koninklijke DSM NV
L’Oréal S.A.
Lonza Group Ltd
*- List Not Exhaustive
Chapter 1. TABLE OF CONTENTS
Chapter 2. Introduction to Antioxidant Cosmetic Products Market
2.1. Market Overview
2.2. Key Statistics and Report Highlights
2.3. Scope of the Comprehensive Study
2.3.1. Market Definition
2.3.2 Countries and Regions Covered
2.3.3 Research Objective
2.3.4 Units, Currency, and Conversions
2.3.5 Industry Value Chain
2.4. Key Market Segments
2.5. Key Companies
2.6. Study Period
Chapter 3. Strategic Analysis Review
3.1. Antioxidant Cosmetic Products Pricing Analysis and Forecast
3.2. Porter’s Five Forces
3.3. Market Ecosystem
3.4. SWOT Analysis
3.5. Regulatory Scenario
3.3. Effects of Inflation, Russia-Ukraine War, moderating economic growth, and other macroeconomic factors
Chapter 4. Competitive Landscape
4.1. Market Share Analysis
4.1.1. Global Antioxidant Cosmetic Products Market Share by Company, 2023
4.1.2. Product Offerings of Leading Antioxidant Cosmetic Products Companies
4.2. Market Entropy
4.2.1. New Product Launches in the Industry
4.2.2. Mergers, Acquisitions, Joint ventures, and Partnerships
4.3. Key Strategies and Best Practices
Chapter 5. Global Market Projections: Best, Reference, and Low Case Scenarios
5.1. Growth Analysis- Case Scenario Definitions
5.2. Low Growth Case Scenario Forecasts
5.3. Reference Growth Case Scenario Forecasts
5.4. High Growth Case Scenario Forecasts
Chapter 6. Market Dynamics
6.1. Antioxidant Cosmetic Products Market Drivers
6.2. Antioxidant Cosmetic Products Market Challenges
6.6. Antioxidant Cosmetic Products Market Opportunities
6.4. Antioxidant Cosmetic Products Market Trends
Chapter 7. Global Antioxidant Cosmetic Products Market Outlook Trends
7.1. Global Antioxidant Cosmetic Products Revenue (USD Million) and CAGR (%) by Type (2021-2032)
7.2. Global Antioxidant Cosmetic Products Revenue (USD Million) and CAGR (%) by Application (2021-2032)
7.3. Global Antioxidant Cosmetic Products Revenue (USD Million) and CAGR (%) by Product (2021-2032)
By Application
Skincare
Haircare
Color cosmetics
By Distribution Channel
Offline
Online
Chapter 8. Global Antioxidant Cosmetic Products Regional Analysis and Outlook
8.1. Global Antioxidant Cosmetic Products Revenue (USD Million) By Regions (2021- 2032)
8.2. North America Antioxidant Cosmetic Products Revenue (USD Million) by Country (2021-2032)
8.2.1. United States Antioxidant Cosmetic Products Regional Analysis and Outlook
8.2.2. Canada Antioxidant Cosmetic Products Regional Analysis and Outlook
8.2.3. Mexico Antioxidant Cosmetic Products Regional Analysis and Outlook
8.3. Europe Antioxidant Cosmetic Products Revenue (USD Million), by Country (2021-2032)
8.3.1. Germany Antioxidant Cosmetic Products Regional Analysis and Outlook
8.3.2. France Antioxidant Cosmetic Products Regional Analysis and Outlook
8.3.3. United Kingdom Antioxidant Cosmetic Products Regional Analysis and Outlook
8.3.4. Spain Antioxidant Cosmetic Products Regional Analysis and Outlook
8.3.5. Italy Antioxidant Cosmetic Products Regional Analysis and Outlook
8.3.6. Russia Antioxidant Cosmetic Products Regional Analysis and Outlook
8.3.7. Rest of Europe Antioxidant Cosmetic Products Regional Analysis and Outlook
8.4. Asia Pacific Antioxidant Cosmetic Products Revenue (USD Million) by Country (2021-2032)
8.4.1. China Antioxidant Cosmetic Products Regional Analysis and Outlook
8.4.2. Japan Antioxidant Cosmetic Products Regional Analysis and Outlook
8.4.3. India Antioxidant Cosmetic Products Regional Analysis and Outlook
8.4.4. South Korea Antioxidant Cosmetic Products Regional Analysis and Outlook
8.4.5. Australia Antioxidant Cosmetic Products Regional Analysis and Outlook
8.4.6. South East Asia Antioxidant Cosmetic Products Regional Analysis and Outlook
8.4.7. Rest of Asia Pacific Antioxidant Cosmetic Products Regional Analysis and Outlook
8.5. South America Antioxidant Cosmetic Products Revenue (USD Million), by Country (2021-2032)
8.5.1. Brazil Antioxidant Cosmetic Products Regional Analysis and Outlook
8.5.2. Argentina Antioxidant Cosmetic Products Regional Analysis and Outlook
8.5.3. Rest of South America Antioxidant Cosmetic Products Regional Analysis and Outlook
8.6. Middle East and Africa Antioxidant Cosmetic Products Revenue (USD Million) by Country (2021-2032)
8.6.1. Middle East Antioxidant Cosmetic Products Regional Analysis and Outlook
8.6.2. Africa Antioxidant Cosmetic Products Regional Analysis and Outlook
Chapter 9. North America Antioxidant Cosmetic Products Analysis and Outlook
9.1. North America Antioxidant Cosmetic Products Revenue (USD Million) by Segments (2021-2032)
9.1.1. North America Antioxidant Cosmetic Products Revenue (USD Million) by Type (2021-2032)
9.1.2. North America Antioxidant Cosmetic Products Revenue (USD Million) by Application (2021-2032)
9.1.3. North America Antioxidant Cosmetic Products Revenue (USD Million) by Product (2021-2032)
By Application
Skincare
Haircare
Color cosmetics
By Distribution Channel
Offline
Online
Chapter 10. Europe Antioxidant Cosmetic Products Analysis and Outlook
10.1. Europe Antioxidant Cosmetic Products Revenue (USD Million), by Segments (USD Million) (2021-2032)
10.1.1. Europe Antioxidant Cosmetic Products Revenue (USD Million) by Type (2021-2032)
10.1.2. Europe Antioxidant Cosmetic Products Revenue (USD Million) by Application (2021-2032)
10.1.3. Europe Antioxidant Cosmetic Products Revenue (USD Million) by Product (2021-2032)
By Application
Skincare
Haircare
Color cosmetics
By Distribution Channel
Offline
Online
Chapter 11. Asia Pacific Antioxidant Cosmetic Products Analysis and Outlook
11.1. Asia Pacific Antioxidant Cosmetic Products Revenue (USD Million), and Revenue (USD Million) by Segments (2021-2032)
11.1.1. Asia Pacific Antioxidant Cosmetic Products Revenue (USD Million) by Type (2021-2032)
11.1.2. Asia Pacific Antioxidant Cosmetic Products Revenue (USD Million) by Application (2021-2032)
11.1.3. Asia Pacific Antioxidant Cosmetic Products Revenue (USD Million) by Product (2021-2032)
By Application
Skincare
Haircare
Color cosmetics
By Distribution Channel
Offline
Online
Chapter 12. South America Antioxidant Cosmetic Products Analysis and Outlook
12.1. South America Antioxidant Cosmetic Products Revenue (USD Million), by Segments (2021-2032)
12.1.1. South America Antioxidant Cosmetic Products Revenue (USD Million) by Type (2021-2032)
12.1.2. South America Antioxidant Cosmetic Products Revenue (USD Million) by Application (2021-2032)
12.1.3. South America Antioxidant Cosmetic Products Revenue (USD Million) by Product (2021-2032)
By Application
Skincare
Haircare
Color cosmetics
By Distribution Channel
Offline
Online
Chapter 13. Middle East and Africa Antioxidant Cosmetic Products Analysis and Outlook
13.1. Middle East and Africa Antioxidant Cosmetic Products Revenue (USD Million), by Segments (2021-2032)
13.1.1. Middle East and Africa Antioxidant Cosmetic Products Revenue (USD Million) by Type (2021-2032)
13.1.2. Middle East and Africa Antioxidant Cosmetic Products Revenue (USD Million) by Application (2021-2032)
13.1.3. Middle East and Africa Antioxidant Cosmetic Products Revenue (USD Million) by Product (2021-2032)
By Application
Skincare
Haircare
Color cosmetics
By Distribution Channel
Offline
Online
Chapter 14. Antioxidant Cosmetic Products Company Profiles
14.1 Business Overview
14.2 Product Profiles
14.3 SWOT Profiles
14.5 Recent Developments
14.6 Financial Profile
List of Companies
Archer Daniels Midland Company (ADM)
Ashland Global Holdings Inc
Barentz International BV
BASF SE
BIOTECNOLOGIAS APLICADAS SL
Camlin Fine Sciences Ltd
Croda International Plc
Eastman Chemical Co.
Evonik Industries AG
Givaudan SA
IMCD NV
Industrias Asociadas S.L.
Koninklijke DSM NV
L’Oréal S.A.
Lonza Group Ltd
15. Methodology and Data Sources
15.1 Customization Offerings
15.2 Subscription Services
15.3 Related Reports
15.4 Publisher Expertise
LIST OF TABLES
Table 1 Market Segmentation Analysis
Table 2 Global Antioxidant Cosmetic Products Market Share of Leading Companies, 2023
Table 3 Product Offerings of Leading Companies
Table 4 Low Growth Scenario Forecasts
Table 5 Reference Case Growth Scenario
Table 6 High Growth Case Scenario
Table 7 Global Antioxidant Cosmetic Products Revenue (USD Million) And CAGR (%) By Type (2021-2032)
Table 8 Global Antioxidant Cosmetic Products Revenue (USD Million) And CAGR (%) By Application (2021-2032)
Table 9 Global Antioxidant Cosmetic Products Revenue (USD Million) And CAGR (%) By Product (2021-2032)
Table 10 Global Antioxidant Cosmetic Products Market Revenue (USD Million) By Regions (2021-2032)
Table 11 Global Antioxidant Cosmetic Products Market Share (%) By Regions (2021-2032)
Table 12 North America Antioxidant Cosmetic Products Revenue (USD Million) By Country (2021-2032)
Table 13 Europe Antioxidant Cosmetic Products Revenue (USD Million) By Country (2021-2032)
Table 14 Asia Pacific Antioxidant Cosmetic Products Revenue (USD Million) By Country (2021-2032)
Table 15 South America Antioxidant Cosmetic Products Revenue (USD Million) By Country (2021-2032)
Table 16 Middle East and Africa Antioxidant Cosmetic Products Revenue (USD Million) By Region (2021-2032)
Table 17 North America Antioxidant Cosmetic Products Revenue (USD Million) By Type (2021-2032)
Table 18 North America Antioxidant Cosmetic Products Revenue (USD Million) By Application (2021-2032)
Table 19 North America Antioxidant Cosmetic Products Revenue (USD Million) By Product (2021-2032)
Table 20 Europe Antioxidant Cosmetic Products Revenue (USD Million) By Type (2021-2032)
Table 21 Europe Antioxidant Cosmetic Products Revenue (USD Million) By Application (2021-2032)
Table 22 Europe Antioxidant Cosmetic Products Revenue (USD Million) By Product (2021-2032)
Table 23 Asia Pacific Antioxidant Cosmetic Products Revenue (USD Million) By Type (2021-2032)
Table 24 Asia Pacific Antioxidant Cosmetic Products Revenue (USD Million) By Application (2021-2032)
Table 25 Asia Pacific Antioxidant Cosmetic Products Revenue (USD Million) By Product (2021-2032)
Table 26 South America Antioxidant Cosmetic Products Revenue (USD Million) By Type (2021-2032)
Table 27 South America Antioxidant Cosmetic Products Revenue (USD Million) By Application (2021-2032)
Table 28 South America Antioxidant Cosmetic Products Revenue (USD Million) By Product (2021-2032)
Table 29 Middle East and Africa Antioxidant Cosmetic Products Revenue (USD Million) By Type (2021-2032)
Table 30 Middle East and Africa Antioxidant Cosmetic Products Revenue (USD Million) By Application (2021-2032)
Table 31 Middle East and Africa Antioxidant Cosmetic Products Revenue (USD Million) By Product (2021-2032)
LIST OF FIGURES
Figure 1. Market Scope
Figure 2. Pricing Forecasts Per Unit, 2023- 2032
Figure 3. Porter’s Five Forces
Figure 4. Global Antioxidant Cosmetic Products Market Revenue (USD Million) By Regions (2021-2032)
Figure 5. Global Antioxidant Cosmetic Products Market Share (%) By Regions (2023)
Figure 6. North America Antioxidant Cosmetic Products Revenue (USD Million) By Country (2021-2032)
Figure 7. United States Antioxidant Cosmetic Products Revenue (USD Million) By Country (2021-2032)
Figure 8. Canada Antioxidant Cosmetic Products Revenue (USD Million) By Country (2021-2032)
Figure 9. Mexico Antioxidant Cosmetic Products Revenue (USD Million) By Country (2021-2032)
Figure 10. Europe Antioxidant Cosmetic Products Revenue (USD Million) By Country (2021-2032)
Figure 11. Germany Antioxidant Cosmetic Products Revenue (USD Million) By Country (2021-2032)
Figure 12. France Antioxidant Cosmetic Products Revenue (USD Million) By Country (2021-2032)
Figure 13. United Kingdom Antioxidant Cosmetic Products Revenue (USD Million) By Country (2021-2032)
Figure 14. Spain Antioxidant Cosmetic Products Revenue (USD Million) By Country (2021-2032)
Figure 15. Italy Antioxidant Cosmetic Products Revenue (USD Million) By Country (2021-2032)
Figure 16. Russia Antioxidant Cosmetic Products Revenue (USD Million) By Country (2021-2032)
Figure 17. Rest of Europe Antioxidant Cosmetic Products Revenue (USD Million) By Country (2021-2032)
Figure 11. Asia Pacific Antioxidant Cosmetic Products Revenue (USD Million) By Country (2021-2032)
Figure 12. China Antioxidant Cosmetic Products Revenue (USD Million) By Country (2021-2032)
Figure 13. Japan Antioxidant Cosmetic Products Revenue (USD Million) By Country (2021-2032)
Figure 14. India Antioxidant Cosmetic Products Revenue (USD Million) By Country (2021-2032)
Figure 15. South Korea Antioxidant Cosmetic Products Revenue (USD Million) By Country (2021-2032)
Figure 16. Australia Antioxidant Cosmetic Products Revenue (USD Million) By Country (2021-2032)
Figure 17. South East Asia Antioxidant Cosmetic Products Revenue (USD Million) By Country (2021-2032)
Figure 18. South America Antioxidant Cosmetic Products Revenue (USD Million) By Country (2021-2032)
Figure 19. Brazil Antioxidant Cosmetic Products Revenue (USD Million) By Country (2021-2032)
Figure 20. Argentina Antioxidant Cosmetic Products Revenue (USD Million) By Country (2021-2032)
Figure 21. Rest of Asia Pacific Antioxidant Cosmetic Products Revenue (USD Million) By Country (2021-2032)
Figure 22. Middle East and Africa Antioxidant Cosmetic Products Revenue (USD Million) By Region (2021-2032)
Figure 23. Saudi Arabia Antioxidant Cosmetic Products Revenue (USD Million) By Region (2021-2032)
Figure 24. The UAE Antioxidant Cosmetic Products Revenue (USD Million) By Region (2021-2032)
Figure 25. Rest of Middle East Antioxidant Cosmetic Products Revenue (USD Million) By Region (2021-2032)
Figure 26. South Africa Antioxidant Cosmetic Products Revenue (USD Million) By Region (2021-2032)
Figure 27. Africa Antioxidant Cosmetic Products Revenue (USD Million) By Region (2021-2032)
Figure 28. North America Antioxidant Cosmetic Products Revenue (USD Million) By Type (2021-2032)
Figure 29. North America Antioxidant Cosmetic Products Revenue (USD Million) By Application (2021-2032)
Figure 30. North America Antioxidant Cosmetic Products Revenue (USD Million) By Product (2021-2032)
Figure 31. Europe Antioxidant Cosmetic Products Revenue (USD Million) By Type (2021-2032)
Figure 32. Europe Antioxidant Cosmetic Products Revenue (USD Million) By Application (2021-2032)
Figure 33. Europe Antioxidant Cosmetic Products Revenue (USD Million) By Product (2021-2032)
Figure 34. Asia Pacific Antioxidant Cosmetic Products Revenue (USD Million) By Type (2021-2032)
Figure 35. Asia Pacific Antioxidant Cosmetic Products Revenue (USD Million) By Application (2021-2032)
Figure 36. Asia Pacific Antioxidant Cosmetic Products Revenue (USD Million) By Product (2021-2032)
Figure 37. South America Antioxidant Cosmetic Products Revenue (USD Million) By Type (2021-2032)
Figure 38. South America Antioxidant Cosmetic Products Revenue (USD Million) By Application (2021-2032)
Figure 39. South America Antioxidant Cosmetic Products Revenue (USD Million) By Product (2021-2032)
Figure 40. Middle East and Africa Antioxidant Cosmetic Products Revenue (USD Million) By Type (2021-2032)
Figure 41. Middle East and Africa Antioxidant Cosmetic Products Revenue (USD Million) By Application (2021-2032)
Figure 42. Middle East and Africa Antioxidant Cosmetic Products Revenue (USD Million) By Product (2021-2032)
By Application
Skincare
Haircare
Color cosmetics
By Distribution Channel
Offline
Online
Countries Analyzed
North America (US, Canada, Mexico)
Europe (Germany, UK, France, Spain, Italy, Russia, Rest of Europe)
Asia Pacific (China, India, Japan, South Korea, Australia, South East Asia, Rest of Asia)
South America (Brazil, Argentina, Rest of South America)
Middle East and Africa (Saudi Arabia, UAE, Rest of Middle East, South Africa, Egypt, Rest of Africa)
